Research
"Zero" Is a Rounded Thing: What Illinois' Pay Stubs Actually Say Since 2019
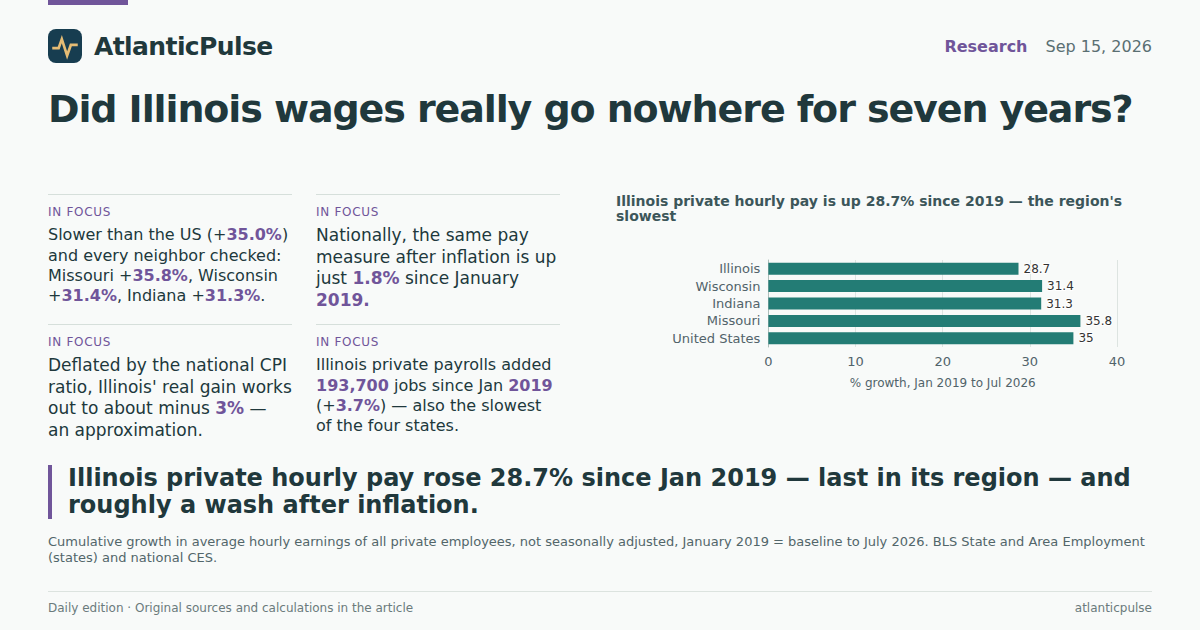
The claim in the wild
Somewhere in the flood of mailers, debates and cable hits that will make up the 2026 Illinois governor's race, you will meet a number that sounds like a verdict: Illinois wages grew 0% in seven years. The line traces to a Wirepoints analysis distributed September 15, whose own summary is more careful than the headline — it says real, inflation-adjusted hourly wages in Illinois shrank about 0.02 percent a year on average from 2018 to 2025, one of only seven states to dip, and concedes that nominal paychecks did rise before inflation "made the gains basically a wash."
Headlines compress; that is their job. But when a compressed number becomes the whole argument — zero means nothing happened, therefore nothing worked — it is worth lining the claim up against the official books. The federal data here are about as boring and reliable as economic statistics get: BLS' monthly survey of payroll records, the same series economists use when they are not trying to win an election.
Illinois private hourly pay is up 28.7% since 2019 — the region's slowest

View exact chart values
| geo | ahe_jan2019 | ahe_jul2026 | growth_pct | yoy_pct | dollar_gain |
|---|---|---|---|---|---|
| Illinois | 28.43 | 36.6 | 28.7 | 4.4 | 8.17 |
| Wisconsin | 26.09 | 34.27 | 31.4 | 1.2 | 8.18 |
| Indiana | 25.3 | 33.23 | 31.3 | 4.1 | 7.93 |
| Missouri | 25.09 | 34.06 | 35.8 | 5.6 | 8.97 |
| United States | 27.72 | 37.42 | 35 | 3.1 | 9.7 |
What the official books say
Start with the number the headline rounds to zero. Average hourly earnings for all Illinois private-sector employees — the plain, not-seasonally-adjusted payroll measure — stood at $28.43 in January 2019, the month Governor Pritzker took office. By July 2026 the same series read $36.60. That is a gain of $8.17 an hour, or 28.7 percent (BLS State and Area Employment). A paycheck that grew by more than a quarter is many things; it is not nothing.
The more interesting story in the same table is relative. Over the identical window, the United States as a whole gained 35.0 percent on this measure, Missouri 35.8, Wisconsin 31.4 and Indiana 31.3 (BLS). Illinois finished last of the five — by about six points against the nation and a hair behind both of its northern and eastern neighbors. The claim's directional instinct, that Illinois underperformed, survives the fact-check. Its arithmetic does not.
Watch the lines rather than the endpoints, too. Illinois tracked the region closely until late 2022, then fell behind as national wage growth accelerated through 2023 and 2024 — the chart gap is a post-inflation-surge phenomenon, not a straight-line seven-year slide.
The gap opens after 2022: Illinois vs the nation and its neighbors

View exact chart values
| date | illinois | us | wisconsin | indiana | missouri |
|---|---|---|---|---|---|
| 2018-12 | 100.6 | 99.9 | 100.4 | 99.8 | 100.1 |
| 2019-01 | 100 | 100 | 100 | 100 | 100 |
| 2019-02 | 101 | 100.3 | 100.5 | 101.1 | 100.1 |
| 2019-03 | 100.4 | 100.3 | 100.6 | 101 | 100.2 |
| 2019-04 | 100.6 | 100.5 | 100.6 | 100.2 | 100 |
| 2019-05 | 100 | 100.2 | 100 | 99.9 | 100 |
| 2019-06 | 100.8 | 100.6 | 100.1 | 100.4 | 100.5 |
| 2019-07 | 101.3 | 100.5 | 100.5 | 100.7 | 100.7 |
| 2019-08 | 101.4 | 100.8 | 100.5 | 100.5 | 101.2 |
| 2019-09 | 102.8 | 102.1 | 102.6 | 102 | 102.7 |
| 2019-10 | 102 | 101.7 | 103.1 | 102.2 | 102 |
| 2019-11 | 102.5 | 101.9 | 103 | 102.3 | 102.5 |
| 2019-12 | 103.7 | 102.8 | 103.8 | 102.9 | 103.8 |
| 2020-01 | 103.6 | 103 | 103.6 | 103.8 | 104.6 |
| 2020-02 | 104.7 | 103.9 | 104.9 | 103.3 | 105.1 |
| 2020-03 | 103.8 | 104.3 | 104.7 | 102.6 | 105.1 |
| 2020-04 | 107.2 | 108.7 | 108.6 | 107.1 | 107.7 |
| 2020-05 | 106.3 | 106.9 | 107.3 | 104.9 | 105.8 |
| 2020-06 | 105.2 | 105 | 104.6 | 102 | 104.2 |
| 2020-07 | 104.8 | 105.4 | 104.6 | 103.2 | 104.2 |
| 2020-08 | 106.2 | 106.5 | 104.9 | 103.1 | 105.9 |
| 2020-09 | 105.4 | 106.3 | 105.4 | 103.3 | 106.5 |
| 2020-10 | 105.8 | 106.3 | 106.3 | 103.2 | 106.9 |
| 2020-11 | 107.6 | 107.4 | 106.6 | 104.7 | 107.3 |
| 2020-12 | 108 | 107.6 | 106.8 | 104.6 | 106.9 |
| 2021-01 | 107.8 | 108.4 | 106.8 | 104.3 | 106.8 |
| 2021-02 | 108.5 | 108.7 | 107.1 | 104.9 | 109.8 |
| 2021-03 | 108.3 | 108.3 | 106.8 | 103.8 | 108.7 |
| 2021-04 | 109.3 | 109.3 | 106.8 | 105.4 | 108.4 |
| 2021-05 | 110.5 | 110.1 | 107.5 | 106.4 | 110.2 |
| 2021-06 | 109.5 | 109.2 | 106.4 | 106 | 108.6 |
| 2021-07 | 110.3 | 110 | 107.3 | 107.4 | 109.6 |
| 2021-08 | 112.1 | 111.1 | 108.4 | 108.3 | 110.5 |
| 2021-09 | 112 | 111.5 | 110.2 | 109.4 | 109.8 |
| 2021-10 | 112.5 | 112.1 | 110.4 | 109.7 | 111.5 |
| 2021-11 | 112.8 | 112.3 | 111.2 | 110.3 | 112.4 |
| 2021-12 | 112.7 | 113 | 111.7 | 111.6 | 113.9 |
| 2022-01 | 114.7 | 115.3 | 113.8 | 115 | 117.5 |
| 2022-02 | 114 | 114.4 | 114 | 113.7 | 114 |
| 2022-03 | 113.9 | 114.7 | 113.8 | 113 | 112.7 |
| 2022-04 | 115.1 | 115.6 | 114.9 | 113.7 | 112.8 |
| 2022-05 | 115.7 | 116.2 | 116.2 | 113.8 | 111.8 |
| 2022-06 | 114.2 | 115.2 | 113 | 113 | 111 |
| 2022-07 | 115.1 | 116.2 | 114.3 | 114.4 | 113 |
| 2022-08 | 115 | 116.3 | 114.3 | 113.6 | 113.4 |
| 2022-09 | 115.9 | 117.2 | 116.3 | 114.4 | 114.6 |
| 2022-10 | 116.8 | 118.6 | 117.2 | 116.2 | 117.7 |
| 2022-11 | 116.9 | 118 | 117.2 | 115.5 | 117.9 |
| 2022-12 | 116.4 | 118.5 | 118.1 | 115.8 | 118.9 |
| 2023-01 | 117.1 | 120.5 | 118.1 | 118.4 | 122.4 |
| 2023-02 | 115.7 | 119.8 | 117.1 | 117.3 | 120.6 |
| 2023-03 | 115.4 | 120 | 117.6 | 116.3 | 120 |
| 2023-04 | 117.7 | 121.8 | 119.5 | 118.7 | 121.8 |
| 2023-05 | 116.1 | 120.7 | 119.1 | 116.8 | 120.8 |
| 2023-06 | 116.1 | 120.6 | 118.6 | 117.2 | 122.3 |
| 2023-07 | 118.5 | 122.4 | 120.2 | 118.1 | 123 |
| 2023-08 | 117.2 | 121.6 | 120.2 | 116.9 | 122.9 |
| 2023-09 | 118.1 | 122.4 | 123 | 117.9 | 123.3 |
| 2023-10 | 118.9 | 123.5 | 123.6 | 118.9 | 124.2 |
| 2023-11 | 117.9 | 122.8 | 123.7 | 118.6 | 124.1 |
| 2023-12 | 118.3 | 123.5 | 126 | 117.8 | 126.3 |
| 2024-01 | 118.9 | 125 | 126.9 | 118.3 | 125.9 |
| 2024-02 | 117.9 | 124.7 | 129.3 | 118.1 | 124.1 |
| 2024-03 | 117.1 | 125 | 128.1 | 118.3 | 124.1 |
| 2024-04 | 117 | 125.8 | 127.7 | 118.8 | 124.4 |
| 2024-05 | 116.7 | 125.6 | 128.9 | 119.1 | 123.5 |
| 2024-06 | 118 | 126.2 | 127.6 | 119.2 | 125 |
| 2024-07 | 118.5 | 126 | 127.3 | 121.2 | 125 |
| 2024-08 | 118.9 | 126.3 | 127.9 | 120.9 | 125.9 |
| 2024-09 | 120 | 127.9 | 128.6 | 122.6 | 128 |
| 2024-10 | 119.9 | 127.7 | 128.1 | 124.3 | 127.4 |
| 2024-11 | 120.2 | 128 | 128.6 | 123.9 | 127.9 |
| 2024-12 | 121.8 | 129.2 | 130.7 | 125.3 | 129.1 |
| 2025-01 | 122.4 | 129.9 | 130.7 | 126.5 | 129.5 |
| 2025-02 | 123.5 | 130.6 | 131.9 | 127.7 | 131.6 |
| 2025-03 | 122.9 | 130.9 | 131 | 126.7 | 130.1 |
| 2025-04 | 122.1 | 130.7 | 131.5 | 125.6 | 129.7 |
| 2025-05 | 123 | 130.6 | 130.5 | 125.4 | 129.4 |
| 2025-06 | 123.5 | 131.1 | 129.4 | 125.8 | 130.2 |
| 2025-07 | 123.4 | 131 | 129.8 | 126.2 | 128.5 |
| 2025-08 | 124 | 131.3 | 130.6 | 127.1 | 129.2 |
| 2025-09 | 124.5 | 132.1 | 132.1 | 128.6 | 129.4 |
| 2025-10 | 125.6 | 132.7 | 131.9 | 129.5 | 129.2 |
| 2025-11 | 127.6 | 133.9 | 133.2 | 129.9 | 130.6 |
| 2025-12 | 126.5 | 133.3 | 132.2 | 129.4 | 130 |
| 2026-01 | 128.1 | 134.6 | 133.3 | 129.1 | 131.8 |
| 2026-02 | 129.5 | 135.5 | 134.5 | 130.7 | 133.5 |
| 2026-03 | 128.4 | 135.4 | 134.1 | 130.2 | 133.4 |
| 2026-04 | 127.8 | 135.2 | 133.2 | 130.4 | 134.5 |
| 2026-05 | 127.5 | 135 | 132.7 | 129.6 | 134.5 |
| 2026-06 | 127.8 | 134.6 | 131.7 | 130.8 | 133.3 |
| 2026-07 | 128.7 | 135 | 131.4 | 131.3 | 135.8 |
The inflation asterisk is the whole ballgame
Now the part the headline gets at, badly. The same BLS tables report the national earnings series again after deflating it to 1982–84 dollars — BLS' own CPI-adjusted version of the measure. On that real series, the average US private wage is up 1.8 percent since January 2019: from 11.01 to 11.21 in 1982–84 dollars (BLS CES). Along the way it spent the better part of 2022 and 2023 below its starting point, when inflation outran raises. A 35 percent raise, squeezed through the price level, comes out a rounding error.
Illinois publishes no price index of its own in this data environment, so an exact real wage for the state cannot be computed here. What can be said, carefully: if you deflate Illinois' 28.7 percent nominal gain by the national nominal-to-real ratio, Illinois' inflation-adjusted hourly pay comes out roughly 3 percent below its January 2019 level. That is an approximation, not a BLS product — but it lands in the same neighborhood as the Wirepoints summary it started from, just with the arithmetic visible.
This is the unglamorous truth both sides of the ad war gloss over. The defenders who quote $36.60 are right and slightly beside the point; the attackers who say zero are wrong and slightly beside the point. American workers, in Illinois and nearly everywhere, traded a big nominal raise for roughly flat purchasing power.
Nationally, a 35% raise shrank to 1.8% after inflation

View exact chart values
| date | nominal_index | real_index |
|---|---|---|
| 2018-12 | 99.9 | 100.1 |
| 2019-01 | 100 | 100 |
| 2019-02 | 100.3 | 99.8 |
| 2019-03 | 100.3 | 99.3 |
| 2019-04 | 100.5 | 99 |
| 2019-05 | 100.2 | 98.5 |
| 2019-06 | 100.6 | 98.9 |
| 2019-07 | 100.5 | 98.6 |
| 2019-08 | 100.8 | 98.9 |
| 2019-09 | 102.1 | 100.1 |
| 2019-10 | 101.7 | 99.5 |
| 2019-11 | 101.9 | 99.8 |
| 2019-12 | 102.8 | 100.7 |
| 2020-01 | 103 | 100.5 |
| 2020-02 | 103.9 | 101.2 |
| 2020-03 | 104.3 | 101.7 |
| 2020-04 | 108.7 | 106.7 |
| 2020-05 | 106.9 | 105 |
| 2020-06 | 105 | 102.5 |
| 2020-07 | 105.4 | 102.5 |
| 2020-08 | 106.5 | 103.1 |
| 2020-09 | 106.3 | 102.8 |
| 2020-10 | 106.3 | 102.8 |
| 2020-11 | 107.4 | 103.9 |
| 2020-12 | 107.6 | 104.1 |
| 2021-01 | 108.4 | 104.4 |
| 2021-02 | 108.7 | 104.1 |
| 2021-03 | 108.3 | 103 |
| 2021-04 | 109.3 | 103.1 |
| 2021-05 | 110.1 | 103 |
| 2021-06 | 109.2 | 101.2 |
| 2021-07 | 110 | 101.5 |
| 2021-08 | 111.1 | 102.3 |
| 2021-09 | 111.5 | 102.3 |
| 2021-10 | 112.1 | 102.1 |
| 2021-11 | 112.3 | 101.7 |
| 2021-12 | 113 | 102 |
| 2022-01 | 115.3 | 103.3 |
| 2022-02 | 114.4 | 101.5 |
| 2022-03 | 114.7 | 100.5 |
| 2022-04 | 115.6 | 100.7 |
| 2022-05 | 116.2 | 100.1 |
| 2022-06 | 115.2 | 97.9 |
| 2022-07 | 116.2 | 98.7 |
| 2022-08 | 116.3 | 98.9 |
| 2022-09 | 117.2 | 99.5 |
| 2022-10 | 118.6 | 100.2 |
| 2022-11 | 118 | 99.8 |
| 2022-12 | 118.5 | 100.5 |
| 2023-01 | 120.5 | 101.4 |
| 2023-02 | 119.8 | 100.3 |
| 2023-03 | 120 | 100.1 |
| 2023-04 | 121.8 | 101.1 |
| 2023-05 | 120.7 | 99.9 |
| 2023-06 | 120.6 | 99.5 |
| 2023-07 | 122.4 | 100.8 |
| 2023-08 | 121.6 | 99.7 |
| 2023-09 | 122.4 | 100.2 |
| 2023-10 | 123.5 | 101.1 |
| 2023-11 | 122.8 | 100.7 |
| 2023-12 | 123.5 | 101.4 |
| 2024-01 | 125 | 102 |
| 2024-02 | 124.7 | 101.2 |
| 2024-03 | 125 | 100.7 |
| 2024-04 | 125.8 | 101 |
| 2024-05 | 125.6 | 100.6 |
| 2024-06 | 126.2 | 101.2 |
| 2024-07 | 126 | 100.9 |
| 2024-08 | 126.3 | 101 |
| 2024-09 | 127.9 | 102.2 |
| 2024-10 | 127.7 | 101.9 |
| 2024-11 | 128 | 102.2 |
| 2024-12 | 129.2 | 103.1 |
| 2025-01 | 129.9 | 102.9 |
| 2025-02 | 130.6 | 103.1 |
| 2025-03 | 130.9 | 103 |
| 2025-04 | 130.7 | 102.5 |
| 2025-05 | 130.6 | 102.3 |
| 2025-06 | 131.1 | 102.3 |
| 2025-07 | 131 | 102.1 |
| 2025-08 | 131.3 | 102.1 |
| 2025-09 | 132.1 | 102.4 |
| 2025-10 | 132.7 | — |
| 2025-11 | 133.9 | 104 |
| 2025-12 | 133.3 | 103.5 |
| 2026-01 | 134.6 | 104.2 |
| 2026-02 | 135.5 | 104.4 |
| 2026-03 | 135.4 | 103.3 |
| 2026-04 | 135.2 | 102.3 |
| 2026-05 | 135 | 101.5 |
| 2026-06 | 134.6 | 101.5 |
| 2026-07 | 135 | 101.8 |
The sharper Illinois fact: last in the neighborhood
Wages are only half a living. The other half is whether there is a job paying one. Illinois private payrolls stood at 5,186,700 in January 2019 and 5,380,400 in July 2026 — growth of 193,700 jobs, or 3.7 percent, with the level only clearing its pre-pandemic self for good in the last couple of years (BLS). Wisconsin's private payroll grew 6.4 percent over the same span, Indiana's 6.3, Missouri's 7.4.
Set the two halves side by side and Illinois occupies the same unenviable corner twice: lowest wage growth and lowest job growth among the states compared. The four points slope upward together — the faster-pay states were, if anything, the faster-hiring states over this window — which is at least an inconvenient data point for anyone arguing that Illinois' slower pay growth was the price of stronger job growth. Four states is a small sample and none of this proves anything about cause; it is a picture, not an econometric model.
One mechanical honesty note: these employment counts are not seasonally adjusted, so the Illinois line sawtooths every January. The dips are the calendar, not the economy.
Illinois private payrolls only lately passed their pre-pandemic self

View exact chart values
| date | emp_thousands |
|---|---|
| 2018-12 | 5325.1 |
| 2019-01 | 5186.7 |
| 2019-02 | 5182 |
| 2019-03 | 5216.6 |
| 2019-04 | 5273.9 |
| 2019-05 | 5322.7 |
| 2019-06 | 5367.3 |
| 2019-07 | 5357.9 |
| 2019-08 | 5361.5 |
| 2019-09 | 5320.8 |
| 2019-10 | 5338.7 |
| 2019-11 | 5350.2 |
| 2019-12 | 5341.9 |
| 2020-01 | 5210.2 |
| 2020-02 | 5211.9 |
| 2020-03 | 5182.5 |
| 2020-04 | 4521.6 |
| 2020-05 | 4592.5 |
| 2020-06 | 4762.5 |
| 2020-07 | 4864.3 |
| 2020-08 | 4907 |
| 2020-09 | 4902.9 |
| 2020-10 | 4968.4 |
| 2020-11 | 4941.5 |
| 2020-12 | 4922.6 |
| 2021-01 | 4820.7 |
| 2021-02 | 4855 |
| 2021-03 | 4910.9 |
| 2021-04 | 4964.8 |
| 2021-05 | 5004.6 |
| 2021-06 | 5068.1 |
| 2021-07 | 5092.4 |
| 2021-08 | 5094.9 |
| 2021-09 | 5068.9 |
| 2021-10 | 5147.3 |
| 2021-11 | 5183.8 |
| 2021-12 | 5197.1 |
| 2022-01 | 5053.9 |
| 2022-02 | 5092.7 |
| 2022-03 | 5136.7 |
| 2022-04 | 5197.9 |
| 2022-05 | 5240.1 |
| 2022-06 | 5287.1 |
| 2022-07 | 5317.3 |
| 2022-08 | 5322.5 |
| 2022-09 | 5296.4 |
| 2022-10 | 5310.5 |
| 2022-11 | 5326.5 |
| 2022-12 | 5305.1 |
| 2023-01 | 5205 |
| 2023-02 | 5206.7 |
| 2023-03 | 5243.4 |
| 2023-04 | 5282.3 |
| 2023-05 | 5319.6 |
| 2023-06 | 5389.9 |
| 2023-07 | 5362 |
| 2023-08 | 5357.5 |
| 2023-09 | 5337 |
| 2023-10 | 5329.1 |
| 2023-11 | 5342.6 |
| 2023-12 | 5324.7 |
| 2024-01 | 5182.8 |
| 2024-02 | 5191.4 |
| 2024-03 | 5235 |
| 2024-04 | 5274.6 |
| 2024-05 | 5322.7 |
| 2024-06 | 5365.5 |
| 2024-07 | 5355.4 |
| 2024-08 | 5349.2 |
| 2024-09 | 5336.3 |
| 2024-10 | 5337.1 |
| 2024-11 | 5347 |
| 2024-12 | 5332.9 |
| 2025-01 | 5196.8 |
| 2025-02 | 5205.6 |
| 2025-03 | 5231.3 |
| 2025-04 | 5282.8 |
| 2025-05 | 5333.1 |
| 2025-06 | 5360.7 |
| 2025-07 | 5366.8 |
| 2025-08 | 5355.6 |
| 2025-09 | 5321.7 |
| 2025-10 | 5340.4 |
| 2025-11 | 5323.8 |
| 2025-12 | 5315.7 |
| 2026-01 | 5193 |
| 2026-02 | 5186.2 |
| 2026-03 | 5216.4 |
| 2026-04 | 5276.8 |
| 2026-05 | 5318.4 |
| 2026-06 | 5368.4 |
| 2026-07 | 5380.4 |
Four states, one pattern: Illinois is lowest on both axes

View exact chart values
| geo | wage_growth_pct | jobs_growth_pct |
|---|---|---|
| Illinois | 28.7 | 3.7 |
| Wisconsin | 31.4 | 6.4 |
| Indiana | 31.3 | 6.3 |
| Missouri | 35.8 | 7.4 |
| United States | 35 | — |
The last twelve months complicate the story
If the seven-year race is Illinois' worst exhibit, the most recent one is its best. From July 2025 to July 2026, Illinois' private hourly pay rose 4.4 percent — ahead of the nation's 3.1 percent and well ahead of Wisconsin's 1.2 percent, though behind Missouri's 5.6 (BLS). On the indexed chart, the Illinois line spends 2025 and 2026 narrowing a gap it spent 2023 opening.
Whether that is a turnaround, a late-cycle catch-up, or just the same approximation noise in a different month is exactly the kind of question a single number cannot settle. Data through July, released on the usual monthly lag, is what the official system can currently say.
How to read a zero
The payoff of the exercise is not a scoreboard for one politician. It is a reminder of what happens to numbers in transit. "Real wages shrank 0.02 percent a year" became "wages grew 0% in 7 years," which became, by the time it reaches a mailer, the claim that paychecks did not move. Each compression is small; compounding them deletes the difference between a nominal raise eaten by inflation and no raise at all — between a policy argument about purchasing power and a factual assertion that is simply false.
The official series supports three statements at once: Illinois paychecks are 28.7 percent bigger than in January 2019; after national inflation, average American pay — and probably Illinois' — buys almost exactly what it did; and Illinois lagged every neighbor checked on both pay and jobs, though less so lately. Anyone offering you one of those sentences as the whole story is selling something.
Sources and methods
Data: BLS Current Employment Statistics (national CES) and State and Area Employment (SM), pinned snapshot of 2026-08-24; observations run monthly through July 2026, a normal monthly production lag behind the September 15 edition; observation dates are not release dates.
Series used are total-private, all-employee, not-seasonally-adjusted measures: average hourly earnings in dollars for Illinois, Wisconsin, Indiana, Missouri and the US, plus total-private employment in thousands for the four states and the CPI-deflated US real earnings series (1982-84 dollars).
State series carry BLS' 2025 benchmark revision; the catalogue's duplicate annual/monthly partitions were resolved by using the monthly partitions only (the annual partitions returned no monthly rows).
The real Illinois figure is an approximation: no Illinois CPI deflator exists in this catalogue, so Illinois' nominal gain was deflated by the national CES nominal-to-real ratio (1.3258). It is labelled an estimate wherever it appears.
The US real series is missing October 2025 in the snapshot; that month is preserved as missing, not zeroed. NSA employment shows seasonal January dips; no seasonal adjustment was applied.
The audited claim originates from a Wirepoints analysis syndicated September 15, 2026, whose own summary (real hourly wages down about 0.02% a year 2018–2025; nominal gains "basically a wash") is more careful than its headline; the claim text is quoted from stored basket evidence.
All comparisons are descriptive; nothing here supports a causal claim about why Illinois' pay or job growth differs, and four-state scatter patterns are not evidence of a law.
Research completed 2026-09-16, for the September 15, 2026 news edition. The available source data may cover earlier periods; see the observation periods and source vintages above.