Research
Workers are paying more for job-based insurance. The official employer benefit bill has not outrun wages.
The picnic that paid for the premium
KFF’s 2026 Employer Health Benefits Survey, released Thursday, found that workers on employer coverage are paying an average of $7,471 toward family premiums this year, up about 9 percent, or $621, from last year. At small firms the employee share averages $9,687, versus $6,840 at companies with 200 or more staff; a third of covered workers at small firms pay more than half the family premium. Jenna Caligaris, who manages a 25-person contractor in upstate New York, told the Associated Press her firm is eating a 25 percent premium increase by stretching trucks, shrinking bonuses and cancelling the company picnic.
That is the household side of a midterm affordability argument. The other side is what employers themselves book as benefit costs. The official economic accounts do not split health premiums from pensions, and they do not split small firms from large ones. They do record, every year, how much U.S. employers paid into employee pension and insurance funds — a bundle that includes group health and life insurance, workers’ compensation and supplemental unemployment insurance, as well as pension plans. Those BEA regional accounts are the closest official ledger to the bill Caligaris is trying not to pass on.
A $1.82 trillion employer bill, and a smaller slice of the paycheck
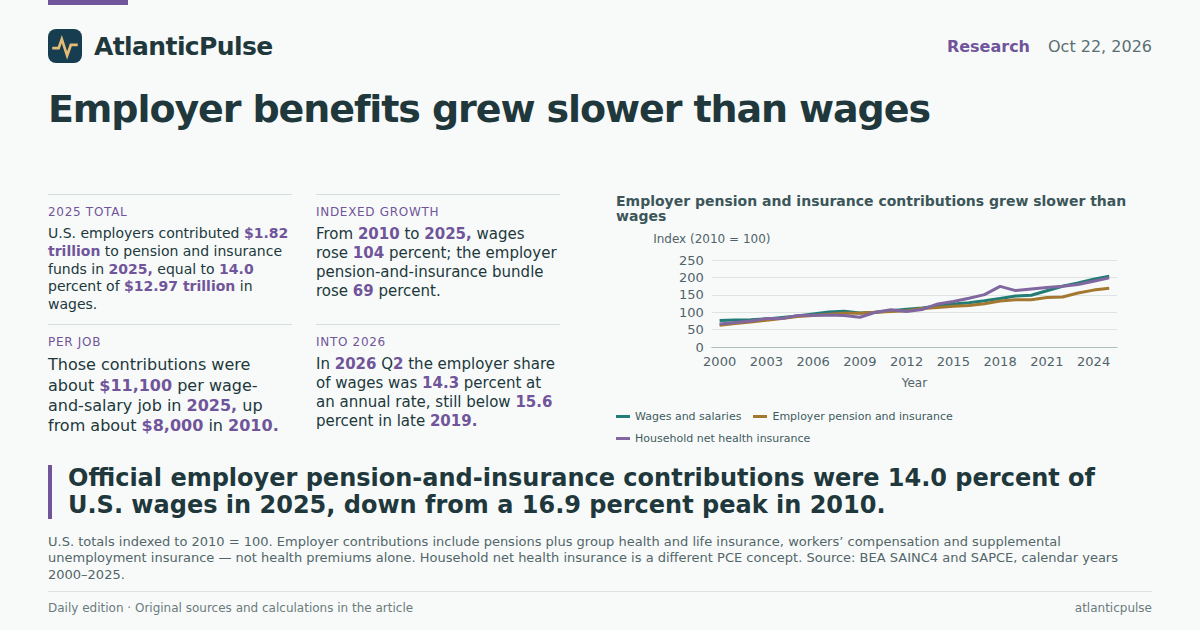
In calendar year 2025, U.S. employers contributed $1.82 trillion to employee pension and insurance funds, against $12.97 trillion in wages and salaries. That is 14.0 percent of wages. The same ratio was 14.0 percent in 2000. It climbed through the 2000s, peaked at 16.9 percent in 2010, and has drifted back down even as the dollar total more than doubled. From 2010 to 2025, wages rose 104 percent; the employer pension-and-insurance bundle rose 69 percent. Household spending on net health insurance, a different personal-consumption concept that nets premiums against benefits paid, rose 98 percent over the same stretch — closer to wages than to the employer bundle.
The comparison is not a claim that job-based health insurance got cheaper. The BEA line mixes pensions with insurance. A freeze in pension contributions, or a shift toward defined-contribution plans, can pull the ratio down even if group health premiums are still rising. What the books do show is that the official employer benefit load, taken as a whole, has not been racing ahead of paychecks. If workers and small firms feel a tighter squeeze, it is likelier to be a shift in who pays inside the premium — the pattern KFF is measuring — than a blowout in the employer total relative to wages.
Employer pension and insurance contributions grew slower than wages

View exact chart values
| year | wages_index | benefits_index | jobs_index | pce_net_health_ins_index | real_pc_pi_index |
|---|---|---|---|---|---|
| 2000 | 75.8 | 62.6 | 101.6 | 66 | — |
| 2001 | 77.8 | 67.2 | 101.4 | 70.7 | — |
| 2002 | 78.5 | 71.5 | 100.7 | 74.5 | — |
| 2003 | 80.7 | 76.9 | 100.4 | 81.6 | — |
| 2004 | 85.1 | 82.1 | 101.5 | 81.5 | — |
| 2005 | 89.4 | 87.4 | 102.9 | 90.5 | — |
| 2006 | 95.1 | 90.1 | 104.6 | 91.3 | — |
| 2007 | 100.5 | 94.2 | 105.7 | 91.8 | — |
| 2008 | 102.6 | 97.1 | 105.3 | 90.2 | 102.2 |
| 2009 | 98.1 | 97.1 | 100.6 | 85.6 | 98.7 |
| 2010 | 100 | 100 | 100 | 100 | 100 |
| 2011 | 104 | 102.1 | 101.1 | 107.2 | 102.6 |
| 2012 | 108.7 | 103.9 | 103.1 | 102 | 104.4 |
| 2013 | 111.7 | 110.3 | 104.8 | 107.7 | 103.5 |
| 2014 | 117.4 | 113.3 | 106.9 | 123.8 | 106.4 |
| 2015 | 123.4 | 117.3 | 109 | 130.8 | 110.2 |
| 2016 | 127.1 | 119.5 | 110.8 | 139.9 | 111.2 |
| 2017 | 133.1 | 124.3 | 112.2 | 150.5 | 113.8 |
| 2018 | 139.7 | 132.2 | 114 | 174.1 | 116.6 |
| 2019 | 146.4 | 135.7 | 115.6 | 162.2 | 119.8 |
| 2020 | 148.5 | 135.9 | 108.8 | 166.9 | 126.1 |
| 2021 | 161.9 | 142 | 112.1 | 171.1 | 132.5 |
| 2022 | 174.7 | 143.6 | 116.7 | 174.7 | 127.4 |
| 2023 | 184.3 | 155.3 | 119 | 179.5 | 129.6 |
| 2024 | 194.9 | 163.4 | 120.5 | 189 | 132.1 |
| 2025 | 203.8 | 168.8 | 120.9 | 198.5 | — |
Those contributions are a smaller slice of the paycheck than in 2010

View exact chart values
| year | wages_billion | benefits_billion | supplements_billion | jobs_million | benefits_pct_of_wages | supplements_pct_of_wages | benefits_per_job | wages_per_job | pce_net_health_ins_billion | real_pc_pi_2017 |
|---|---|---|---|---|---|---|---|---|---|---|
| 2000 | 4823.8 | 674.9 | 1019.6 | 137.61 | 13.99 | 21.14 | 4904 | 35054 | 94.4 | — |
| 2001 | 4950.1 | 724.5 | 1081.9 | 137.334 | 14.64 | 21.86 | 5275 | 36044 | 101.1 | — |
| 2002 | 4992.6 | 770.6 | 1136.1 | 136.301 | 15.44 | 22.76 | 5654 | 36629 | 106.5 | — |
| 2003 | 5133.7 | 828.9 | 1210.7 | 135.967 | 16.15 | 23.58 | 6096 | 37757 | 116.7 | — |
| 2004 | 5416.8 | 885.7 | 1293.7 | 137.404 | 16.35 | 23.88 | 6446 | 39422 | 116.5 | — |
| 2005 | 5688.4 | 942.4 | 1369.7 | 139.341 | 16.57 | 24.08 | 6763 | 40824 | 129.4 | — |
| 2006 | 6051.4 | 971.3 | 1417.9 | 141.66 | 16.05 | 23.43 | 6857 | 42717 | 130.6 | — |
| 2007 | 6392.8 | 1016.1 | 1477.1 | 143.17 | 15.89 | 23.11 | 7097 | 44652 | 131.3 | — |
| 2008 | 6531.1 | 1046.8 | 1517.5 | 142.584 | 16.03 | 23.24 | 7342 | 45805 | 129.1 | 45816 |
| 2009 | 6241.5 | 1046.9 | 1504.2 | 136.242 | 16.77 | 24.1 | 7684 | 45812 | 122.4 | 44204 |
| 2010 | 6363.4 | 1078.3 | 1546.4 | 135.393 | 16.95 | 24.3 | 7964 | 46999 | 143 | 44808 |
| 2011 | 6615.8 | 1101.1 | 1592.9 | 136.918 | 16.64 | 24.08 | 8042 | 48319 | 153.3 | 45957 |
| 2012 | 6918.2 | 1119.9 | 1632.3 | 139.619 | 16.19 | 23.59 | 8021 | 49550 | 145.8 | 46796 |
| 2013 | 7104.8 | 1188.9 | 1714.3 | 141.932 | 16.73 | 24.13 | 8377 | 50058 | 154.1 | 46358 |
| 2014 | 7467.7 | 1221.6 | 1767.1 | 144.722 | 16.36 | 23.66 | 8441 | 51600 | 177 | 47661 |
| 2015 | 7851.8 | 1264.9 | 1833.3 | 147.641 | 16.11 | 23.35 | 8567 | 53182 | 187.1 | 49396 |
| 2016 | 8086.7 | 1289 | 1869.1 | 149.96 | 15.94 | 23.11 | 8595 | 53926 | 200.1 | 49828 |
| 2017 | 8469.5 | 1340.4 | 1944.3 | 151.949 | 15.83 | 22.96 | 8822 | 55739 | 215.2 | 51006 |
| 2018 | 8888.1 | 1425.8 | 2049.4 | 154.362 | 16.04 | 23.06 | 9236 | 57580 | 248.9 | 52242 |
| 2019 | 9313.6 | 1463.1 | 2112.5 | 156.541 | 15.71 | 22.68 | 9346 | 59497 | 232 | 53683 |
| 2020 | 9449.1 | 1465.7 | 2123.2 | 147.243 | 15.51 | 22.47 | 9954 | 64174 | 238.7 | 56514 |
| 2021 | 10302.9 | 1531.2 | 2236.8 | 151.774 | 14.86 | 21.71 | 10089 | 67883 | 244.8 | 59365 |
| 2022 | 11116.3 | 1548.8 | 2312.7 | 157.95 | 13.93 | 20.8 | 9805 | 70379 | 249.8 | 57104 |
| 2023 | 11729.8 | 1674.2 | 2487.2 | 161.096 | 14.27 | 21.2 | 10393 | 72813 | 256.8 | 58088 |
| 2024 | 12404.9 | 1761.7 | 2618.1 | 163.092 | 14.2 | 21.11 | 10802 | 76061 | 270.3 | 59195 |
| 2025 | 12969.6 | 1820.1 | 2706.8 | 163.724 | 14.03 | 20.87 | 11117 | 79216 | 283.8 | — |
Per job, the bill is still larger
The falling share is not a shrinking bill. Divided by wage-and-salary jobs — positions, including part-time work, not unique workers — employer pension and insurance contributions were about $11,100 per job in 2025, up from about $8,000 in 2010 and about $4,900 in 2000. Average wages per job rose faster, from about $47,000 in 2010 to about $79,200 in 2025, which is why the ratio fell. Nominal dollars also include inflation. Real per capita personal income, a broader measure than wages, was 32 percent above its 2010 level by 2024, the latest year in BEA’s constant-2017-dollar series.
None of that tells Caligaris her 25 percent premium hike is imaginary. A national average per job mixes federal contractors, hospital systems and 25-person shops. It also mixes fully insured small-group coverage with large-firm self-insurance. The official number is a reminder that the employer benefit account grew in dollars and still lost ground as a share of a paycheck that grew faster.
Per job, the employer benefit bill still climbed past $11,000

View exact chart values
| year | wages_billion | benefits_billion | supplements_billion | jobs_million | benefits_pct_of_wages | supplements_pct_of_wages | benefits_per_job | wages_per_job | pce_net_health_ins_billion | real_pc_pi_2017 |
|---|---|---|---|---|---|---|---|---|---|---|
| 2000 | 4823.8 | 674.9 | 1019.6 | 137.61 | 13.99 | 21.14 | 4904 | 35054 | 94.4 | — |
| 2001 | 4950.1 | 724.5 | 1081.9 | 137.334 | 14.64 | 21.86 | 5275 | 36044 | 101.1 | — |
| 2002 | 4992.6 | 770.6 | 1136.1 | 136.301 | 15.44 | 22.76 | 5654 | 36629 | 106.5 | — |
| 2003 | 5133.7 | 828.9 | 1210.7 | 135.967 | 16.15 | 23.58 | 6096 | 37757 | 116.7 | — |
| 2004 | 5416.8 | 885.7 | 1293.7 | 137.404 | 16.35 | 23.88 | 6446 | 39422 | 116.5 | — |
| 2005 | 5688.4 | 942.4 | 1369.7 | 139.341 | 16.57 | 24.08 | 6763 | 40824 | 129.4 | — |
| 2006 | 6051.4 | 971.3 | 1417.9 | 141.66 | 16.05 | 23.43 | 6857 | 42717 | 130.6 | — |
| 2007 | 6392.8 | 1016.1 | 1477.1 | 143.17 | 15.89 | 23.11 | 7097 | 44652 | 131.3 | — |
| 2008 | 6531.1 | 1046.8 | 1517.5 | 142.584 | 16.03 | 23.24 | 7342 | 45805 | 129.1 | 45816 |
| 2009 | 6241.5 | 1046.9 | 1504.2 | 136.242 | 16.77 | 24.1 | 7684 | 45812 | 122.4 | 44204 |
| 2010 | 6363.4 | 1078.3 | 1546.4 | 135.393 | 16.95 | 24.3 | 7964 | 46999 | 143 | 44808 |
| 2011 | 6615.8 | 1101.1 | 1592.9 | 136.918 | 16.64 | 24.08 | 8042 | 48319 | 153.3 | 45957 |
| 2012 | 6918.2 | 1119.9 | 1632.3 | 139.619 | 16.19 | 23.59 | 8021 | 49550 | 145.8 | 46796 |
| 2013 | 7104.8 | 1188.9 | 1714.3 | 141.932 | 16.73 | 24.13 | 8377 | 50058 | 154.1 | 46358 |
| 2014 | 7467.7 | 1221.6 | 1767.1 | 144.722 | 16.36 | 23.66 | 8441 | 51600 | 177 | 47661 |
| 2015 | 7851.8 | 1264.9 | 1833.3 | 147.641 | 16.11 | 23.35 | 8567 | 53182 | 187.1 | 49396 |
| 2016 | 8086.7 | 1289 | 1869.1 | 149.96 | 15.94 | 23.11 | 8595 | 53926 | 200.1 | 49828 |
| 2017 | 8469.5 | 1340.4 | 1944.3 | 151.949 | 15.83 | 22.96 | 8822 | 55739 | 215.2 | 51006 |
| 2018 | 8888.1 | 1425.8 | 2049.4 | 154.362 | 16.04 | 23.06 | 9236 | 57580 | 248.9 | 52242 |
| 2019 | 9313.6 | 1463.1 | 2112.5 | 156.541 | 15.71 | 22.68 | 9346 | 59497 | 232 | 53683 |
| 2020 | 9449.1 | 1465.7 | 2123.2 | 147.243 | 15.51 | 22.47 | 9954 | 64174 | 238.7 | 56514 |
| 2021 | 10302.9 | 1531.2 | 2236.8 | 151.774 | 14.86 | 21.71 | 10089 | 67883 | 244.8 | 59365 |
| 2022 | 11116.3 | 1548.8 | 2312.7 | 157.95 | 13.93 | 20.8 | 9805 | 70379 | 249.8 | 57104 |
| 2023 | 11729.8 | 1674.2 | 2487.2 | 161.096 | 14.27 | 21.2 | 10393 | 72813 | 256.8 | 58088 |
| 2024 | 12404.9 | 1761.7 | 2618.1 | 163.092 | 14.2 | 21.11 | 10802 | 76061 | 270.3 | 59195 |
| 2025 | 12969.6 | 1820.1 | 2706.8 | 163.724 | 14.03 | 20.87 | 11117 | 79216 | 283.8 | — |
The Great Lakes carry more of the load
The national 14 percent average hides a regional spread. In 2025, employer pension and insurance contributions were 15.2 percent of wages in the Great Lakes and 12.8 percent in the Southwest. The Plains and Mideast sat near 14.6 percent; New England, the Rocky Mountains and the Far West were below the national figure. That is not a small-firm map. It is closer to an industrial-and-union map: places with older manufacturing and public-sector pension systems book a heavier employer contribution relative to wages.
It also does not reverse KFF’s small-firm finding. A 25-person contractor in upstate New York can face a sharper premium increase than the Mideast average implies, because the BEA region blends New York hospitals, New Jersey pharmaceuticals and Pennsylvania factories. The regional bars are a check on the idea that every labor market is equally insurance-heavy, not a substitute for firm-size data the accounts do not publish.
Great Lakes paychecks carry the heaviest employer benefit load

View exact chart values
| region | wages_billion | benefits_billion | benefits_pct_of_wages |
|---|---|---|---|
| Southwest | 1571.1 | 201.4 | 12.82 |
| Rocky Mountain | 503.7 | 65.1 | 12.93 |
| New England | 695.6 | 92.2 | 13.25 |
| Far West | 2593.3 | 355.9 | 13.72 |
| Southeast | 2916.1 | 410.9 | 14.09 |
| Mideast | 2242.6 | 327.1 | 14.59 |
| Plains | 776.4 | 113.7 | 14.64 |
| Great Lakes | 1670.8 | 253.7 | 15.18 |
Into 2026, the share is still below 2019
Quarterly estimates, published as seasonally adjusted annual rates, tell the same story in closer to real time. In 2019 Q4, employer pension and insurance contributions ran at a $1.47 trillion annual rate, 15.6 percent of wages. By 2026 Q2 they were $1.93 trillion at an annual rate — and 14.3 percent of wages. The dollar bill is larger. The share of the paycheck is not. Those 2026 figures are quarterly annualized estimates, not a completed calendar year, and they remain a bundle rather than a health-premium series.
Put next to Thursday’s KFF survey, the official books suggest a split screen. Workers, especially at small firms, are being asked to pay more toward family coverage. Employers, in the aggregate, are not booking pension-and-insurance contributions that outrun wage growth. The picnic can still disappear. The national ratio says the disappearance is more about who inside the premium is paying than about an employer benefit account that has broken away from the paycheck.
Into 2026, the employer-benefit share of wages is still below 2019

View exact chart values
| period | period_start | wages_saar_billion | benefits_saar_billion | benefits_pct_of_wages |
|---|---|---|---|---|
| 2019 Q1 | 2019-01-01 | 9210.1 | 1455 | 15.8 |
| 2019 Q2 | 2019-04-01 | 9261.8 | 1460 | 15.76 |
| 2019 Q3 | 2019-07-01 | 9317.6 | 1465.5 | 15.73 |
| 2019 Q4 | 2019-10-01 | 9465.1 | 1471.7 | 15.55 |
| 2020 Q1 | 2020-01-01 | 9612.8 | 1477.7 | 15.37 |
| 2020 Q2 | 2020-04-01 | 8980.6 | 1410.3 | 15.7 |
| 2020 Q3 | 2020-07-01 | 9417.5 | 1468.6 | 15.59 |
| 2020 Q4 | 2020-10-01 | 9785.5 | 1506.1 | 15.39 |
| 2021 Q1 | 2021-01-01 | 9867.8 | 1524.8 | 15.45 |
| 2021 Q2 | 2021-04-01 | 10159.9 | 1531.8 | 15.08 |
| 2021 Q3 | 2021-07-01 | 10443.9 | 1534.3 | 14.69 |
| 2021 Q4 | 2021-10-01 | 10740.1 | 1533.9 | 14.28 |
| 2022 Q1 | 2022-01-01 | 10893.8 | 1531.6 | 14.06 |
| 2022 Q2 | 2022-04-01 | 10989.4 | 1533.7 | 13.96 |
| 2022 Q3 | 2022-07-01 | 11265.9 | 1549.5 | 13.75 |
| 2022 Q4 | 2022-10-01 | 11316.1 | 1580.2 | 13.96 |
| 2023 Q1 | 2023-01-01 | 11472.1 | 1624.4 | 14.16 |
| 2023 Q2 | 2023-04-01 | 11636.7 | 1659.3 | 14.26 |
| 2023 Q3 | 2023-07-01 | 11834.4 | 1692.7 | 14.3 |
| 2023 Q4 | 2023-10-01 | 11976.1 | 1720.5 | 14.37 |
| 2024 Q1 | 2024-01-01 | 12161.5 | 1745 | 14.35 |
| 2024 Q2 | 2024-04-01 | 12335.8 | 1758.6 | 14.26 |
| 2024 Q3 | 2024-07-01 | 12478.9 | 1769.4 | 14.18 |
| 2024 Q4 | 2024-10-01 | 12643.5 | 1773.9 | 14.03 |
| 2025 Q1 | 2025-01-01 | 12783.6 | 1781.6 | 13.94 |
| 2025 Q2 | 2025-04-01 | 12900.4 | 1802.3 | 13.97 |
| 2025 Q3 | 2025-07-01 | 13034.4 | 1831.6 | 14.05 |
| 2025 Q4 | 2025-10-01 | 13159.9 | 1864.7 | 14.17 |
| 2026 Q1 | 2026-01-01 | 13327 | 1899.6 | 14.25 |
| 2026 Q2 | 2026-04-01 | 13473.9 | 1927.9 | 14.31 |
Sources and methods
Annual figures are BEA SAINC4 personal income by major component, United States and BEA regions, from the 2026-09-30 regional release. Calendar year 2025 is the latest annual observation in that vintage, not a current-week print.
Employer contributions for employee pension and insurance funds include private and government pension plans and private insurance funds such as group health and life insurance, workers’ compensation and supplemental unemployment insurance. The line is not a pure health-premium series and cannot be split by firm size.
Wage-and-salary employment counts jobs, including part-time positions, not unique workers. Per-job dollars are the contribution total divided by that job count. They are not household averages.
Quarterly figures are BEA SQINC4 seasonally adjusted annual rates through 2026 Q2, not realized quarterly totals and not a completed 2026 year.
Household net health insurance is BEA SAPCE personal consumption expenditures, a different concept from employer contributions. It nets household insurance spending against benefits and should not be added to the employer line.
Real per capita personal income is BEA SARPI in constant 2017 dollars through 2024. It is broader than wages. Indexed comparisons use 2010 = 100. No year was missing or duplicated in the matched 2000–2025 annual extracts. Ratios are descriptive; they are not an estimate of causal cost-shifting from employers to workers.
Research completed 2026-10-23, for the October 22, 2026 news edition. The available source data may cover earlier periods; see the observation periods and source vintages above.