Research
Washington is rich. Its income-tax till is still almost empty.
The tax on the ballot is not on the books yet
Washington’s latest revenue forecast still shows a hole. The 9.9 percent tax on wage income above $1 million, signed in March and slated to take effect in 2028, is what the state’s economist is counting on for billions of dollars that would not be collected until 2029 — if Initiative 645 fails and the courts play along. That is a political argument. It is not yet a line in the Bureau of Economic Analysis accounts.
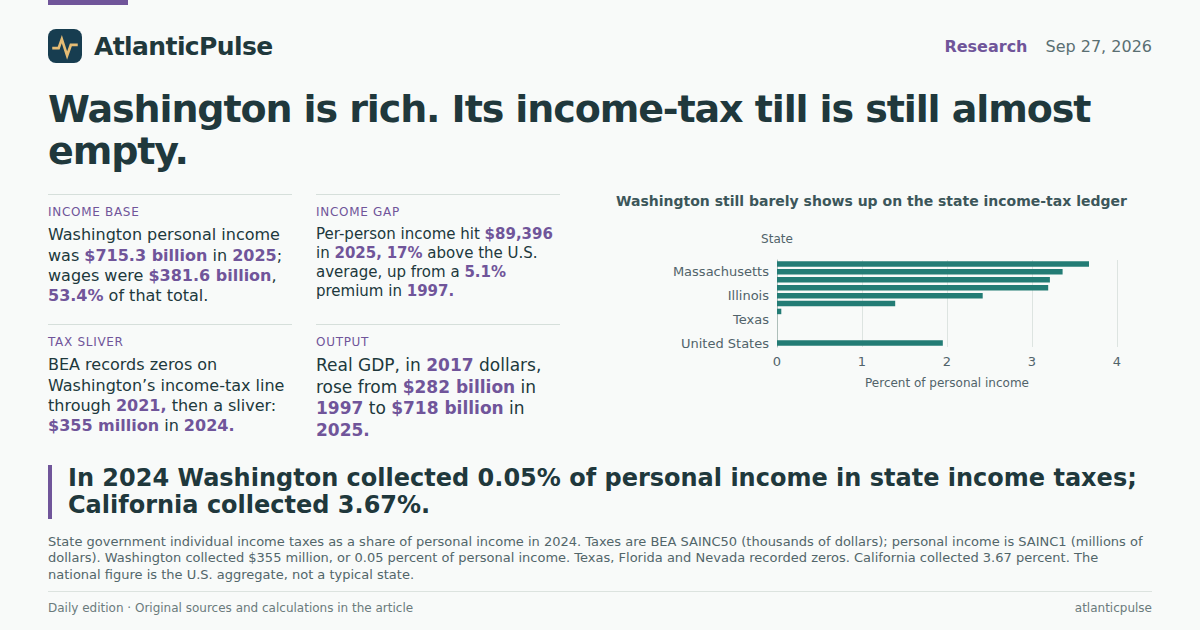
Those accounts, in the April 2026 state personal-income release, still describe a state that barely taxes individual income at all. For every year from 1997 through 2021, BEA records Washington state government income taxes as zero. The line turns on in 2022 at $458.5 million, peaks at $588.7 million in 2023, and falls to $355.0 million in 2024. Against $677.9 billion of personal income that year, the take is 0.05 percent. The proposed wage tax on millionaires is not in those totals. Whatever the 2022–24 sliver is — BEA labels it simply as individual income taxes net of refunds — it is a rounding error next to the budget numbers now being argued in Olympia.
That is the useful fact for readers trying to decode the repeal campaign. Washington is not a poor state hunting for revenue because the economy shrank. It is a rich state whose existing income-tax till is almost empty, asking voters whether to fill it a little.
Washington still barely shows up on the state income-tax ledger

View exact chart values
| state | share_pct | tax_billions | year |
|---|---|---|---|
| United States | 1.95 | 485.608 | 2024 |
| Florida | 0 | 0 | 2024 |
| Nevada | 0 | 0 | 2024 |
| Texas | 0 | 0 | 2024 |
| Washington | 0.05 | 0.355 | 2024 |
| Colorado | 1.39 | 6.889 | 2024 |
| Illinois | 2.42 | 22.926 | 2024 |
| Oregon | 3.19 | 9.663 | 2024 |
| New York | 3.21 | 54.546 | 2024 |
| Massachusetts | 3.36 | 22.425 | 2024 |
| California | 3.67 | 124.715 | 2024 |
The income base is large, and it has pulled away from the country
In 2025, Washington personal income was $715.3 billion, or $89,396 per person. The U.S. average was $76,393. That is a 17 percent premium, up from 5 percent in 1997. California, the other West Coast money machine, was still a bit higher at $91,116. Oregon, which has long run a conventional income tax, was at $73,678 — below the national average. Dividing Washington’s personal income by its per-person figure implies about 8.0 million residents.
Wages are the piece the new tax would actually touch. BEA wages and salaries in Washington were $381.6 billion in 2025, 53.4 percent of personal income, in line with the mid-50s share the state has posted for most of the past three decades. The tax as written applies only to wage income above $1 million, not to the whole paycheck, and not to capital gains, rents or transfers. The official wage total is the pond. It is not the fish.
Price-adjusted income tells the same story with less drama. Using BEA’s regional price parities, Washington real per capita personal income in 2017 dollars was $64,421 in 2024, 8.8 percent above the U.S. figure of $59,195. The current-dollar gap is wider because Washington is expensive. Even after that adjustment, the state is not living on fumes.
Washington’s income per person pulled away from the U.S. average

View exact chart values
| year | wa | us | ca | or | wa_vs_us_pct |
|---|---|---|---|---|---|
| 1997 | 27245 | 25925 | 26979 | 24900 | 5.1 |
| 1998 | 29355 | 27493 | 28901 | 25915 | 6.8 |
| 1999 | 30786 | 28592 | 30529 | 26498 | 7.7 |
| 2000 | 32538 | 30551 | 33175 | 28257 | 6.5 |
| 2001 | 32986 | 31548 | 33915 | 28774 | 4.6 |
| 2002 | 33222 | 31801 | 34047 | 28759 | 4.5 |
| 2003 | 34267 | 32659 | 35191 | 29523 | 4.9 |
| 2004 | 36309 | 34183 | 36969 | 30980 | 6.2 |
| 2005 | 37202 | 35669 | 38737 | 32125 | 4.3 |
| 2006 | 39744 | 37843 | 41454 | 34488 | 5 |
| 2007 | 42524 | 39588 | 43070 | 35624 | 7.4 |
| 2008 | 44098 | 40854 | 43391 | 36856 | 7.9 |
| 2009 | 41679 | 39307 | 41660 | 35286 | 6 |
| 2010 | 42327 | 40557 | 43137 | 35941 | 4.4 |
| 2011 | 44279 | 42650 | 45508 | 37531 | 3.8 |
| 2012 | 47053 | 44238 | 47793 | 39128 | 6.4 |
| 2013 | 47448 | 44402 | 48074 | 39462 | 6.9 |
| 2014 | 50259 | 46289 | 50617 | 41654 | 8.6 |
| 2015 | 52408 | 48062 | 53816 | 44166 | 9 |
| 2016 | 54296 | 48974 | 55862 | 45467 | 10.9 |
| 2017 | 56800 | 51006 | 58214 | 47566 | 11.4 |
| 2018 | 59824 | 53311 | 60984 | 50209 | 12.2 |
| 2019 | 63431 | 55567 | 64219 | 52190 | 14.2 |
| 2020 | 67669 | 59151 | 70090 | 56663 | 14.4 |
| 2021 | 73944 | 64692 | 77113 | 62647 | 14.3 |
| 2022 | 76120 | 66303 | 77230 | 63691 | 14.8 |
| 2023 | 81280 | 70013 | 81231 | 67518 | 16.1 |
| 2024 | 85512 | 73227 | 86378 | 70940 | 16.8 |
| 2025 | 89396 | 76393 | 91116 | 73678 | 17 |
Even after local prices, Washington still out-earns the country

View exact chart values
| year | wa | us | wa_vs_us_pct |
|---|---|---|---|
| 2008 | 47369 | 45816 | 3.4 |
| 2009 | 44854 | 44204 | 1.5 |
| 2010 | 45578 | 44808 | 1.7 |
| 2011 | 46278 | 45957 | 0.7 |
| 2012 | 48605 | 46796 | 3.9 |
| 2013 | 48400 | 46358 | 4.4 |
| 2014 | 49860 | 47661 | 4.6 |
| 2015 | 51679 | 49396 | 4.6 |
| 2016 | 52446 | 49828 | 5.3 |
| 2017 | 53192 | 51006 | 4.3 |
| 2018 | 54837 | 52242 | 5 |
| 2019 | 56862 | 53683 | 5.9 |
| 2020 | 60102 | 56514 | 6.3 |
| 2021 | 62496 | 59365 | 5.3 |
| 2022 | 59601 | 57104 | 4.4 |
| 2023 | 62138 | 58088 | 7 |
| 2024 | 64421 | 59195 | 8.8 |
Neighbors already collect what Washington does not
Put the 2024 income-tax line next to personal income and the neighborhood looks lopsided. California collected $124.7 billion in state individual income taxes, 3.67 percent of personal income. Oregon collected $9.66 billion, or 3.19 percent. New York was at 3.21 percent, Massachusetts 3.36 percent, Illinois 2.42 percent. The U.S. aggregate — every state’s income taxes stacked against national personal income — was 1.95 percent, or $485.6 billion.
Texas, Florida and Nevada recorded zeros, as Washington did for a quarter-century. Colorado, which has been cutting its income-tax rate, still collected 1.39 percent. Washington’s 0.05 percent sits in a class with the no-tax states, not with Oregon. If you are a voter being told that a 9.9 percent levy on millionaire wages is either a modest repair or a civilizational betrayal, the books say something drier: the state has not been taxing this base in any serious way.
That comparison is not a verdict on sales taxes, business taxes or property taxes, which BEA keeps on other ledgers. Washington has long loaded more of the bill onto consumption. Personal current taxes of the income-tax type are the slice the millionaire measure would change. On that slice, the state is an outlier among rich coastal peers.
The pie grew. The state payroll did not eat it.
Washington real GDP, in chained 2017 dollars, rose from $282 billion in 1997 to $718 billion in 2025, a 155 percent increase. There were pauses in 2001, 2009 and 2020. There was not a lost decade. Growth is not the same thing as a balanced budget — Olympia can overspend a boom — but it does undercut the idea that the tax fight is happening because the economy stalled.
State-government jobs tell a similar story from the other side of the ledger. In July 2000, Washington had 140,500 state-government jobs and 2.74 million total nonfarm jobs; the state share was 5.13 percent. By July 2026, in the latest BLS snapshot, state government was 151,700 and total nonfarm 3.65 million. The state share had slipped to 4.15 percent. Indexed to 2000, the broader payroll is up 33 percent; the state-government payroll is up 8 percent. The public workforce grew. It did not grow like the private one.
None of this says the 9.9 percent tax is the right size, or that Initiative 645 is a free lunch. BEA will not record a dollar of that tax until it is collected. The forecast’s $3.5 billion and $9.4 billion figures are Olympia’s, not the national accounts’. What the national accounts do show is simpler, and harder to campaign against: Washington already has a large wage and income base, it has been pulling away from the country for a decade, and it still collects almost nothing that BEA is willing to call a state income tax.
The pie grew: Washington real GDP more than doubled since 1997

View exact chart values
| year | real_gdp_billions_chained_2017 | index_1997 |
|---|---|---|
| 1997 | 281.5 | 100 |
| 1998 | 299.8 | 106.5 |
| 1999 | 322.7 | 114.6 |
| 2000 | 325.9 | 115.7 |
| 2001 | 317.9 | 112.9 |
| 2002 | 322 | 114.4 |
| 2003 | 327.6 | 116.4 |
| 2004 | 335.4 | 119.2 |
| 2005 | 358.4 | 127.3 |
| 2006 | 372.1 | 132.2 |
| 2007 | 394.2 | 140 |
| 2008 | 401.1 | 142.5 |
| 2009 | 390.8 | 138.8 |
| 2010 | 403.5 | 143.3 |
| 2011 | 411.6 | 146.2 |
| 2012 | 426.4 | 151.5 |
| 2013 | 439.5 | 156.1 |
| 2014 | 456.2 | 162 |
| 2015 | 476.7 | 169.3 |
| 2016 | 495.7 | 176.1 |
| 2017 | 527.2 | 187.3 |
| 2018 | 561.8 | 199.6 |
| 2019 | 588.8 | 209.1 |
| 2020 | 587.2 | 208.6 |
| 2021 | 626.1 | 222.4 |
| 2022 | 643 | 228.4 |
| 2023 | 671 | 238.3 |
| 2024 | 702.2 | 249.4 |
| 2025 | 717.5 | 254.9 |
State-government jobs did not keep pace with the private payroll

View exact chart values
| year | state_gov_index | total_nonfarm_index | gov_share_pct | state_gov_thousands | total_nonfarm_thousands |
|---|---|---|---|---|---|
| 2000 | 100 | 100 | 5.13 | 140.5 | 2741 |
| 2001 | 102.4 | 99.7 | 5.26 | 143.9 | 2734 |
| 2002 | 103.6 | 98.4 | 5.4 | 145.6 | 2697.4 |
| 2003 | 104.5 | 98.5 | 5.44 | 146.8 | 2700.9 |
| 2004 | 105.6 | 100 | 5.41 | 148.3 | 2741.4 |
| 2005 | 105.3 | 102.8 | 5.25 | 148 | 2818 |
| 2006 | 104.5 | 105.6 | 5.07 | 146.8 | 2893.5 |
| 2007 | 106.8 | 108.5 | 5.05 | 150.1 | 2973.2 |
| 2008 | 108.7 | 109.7 | 5.08 | 152.7 | 3007.7 |
| 2009 | 107.3 | 103.9 | 5.29 | 150.7 | 2847.1 |
| 2010 | 108 | 103.4 | 5.36 | 151.8 | 2834.4 |
| 2011 | 105.3 | 105 | 5.14 | 148 | 2877.5 |
| 2012 | 105.4 | 106.5 | 5.07 | 148.1 | 2920.5 |
| 2013 | 106.7 | 108.7 | 5.03 | 149.9 | 2980.2 |
| 2014 | 109.2 | 111.6 | 5.01 | 153.4 | 3059.6 |
| 2015 | 111 | 114.9 | 4.96 | 156 | 3148.2 |
| 2016 | 113.5 | 118.5 | 4.91 | 159.5 | 3247.7 |
| 2017 | 115.4 | 121.4 | 4.87 | 162.1 | 3327.2 |
| 2018 | 109.1 | 124 | 4.51 | 153.3 | 3398.6 |
| 2019 | 106 | 126.8 | 4.28 | 148.9 | 3475.8 |
| 2020 | 102.5 | 117.1 | 4.49 | 144 | 3210.2 |
| 2021 | 101.8 | 123.3 | 4.23 | 143 | 3381 |
| 2022 | 98.2 | 129.2 | 3.9 | 138 | 3542.7 |
| 2023 | 101.7 | 130.9 | 3.98 | 142.9 | 3588.8 |
| 2024 | 112.5 | 132.1 | 4.37 | 158.1 | 3621.5 |
| 2025 | 112.5 | 132.6 | 4.35 | 158 | 3635.3 |
| 2026 | 108 | 133.3 | 4.15 | 151.7 | 3652.5 |
Sources and methods
This package uses pinned catalogue snapshots, not live downloads. BEA annual state GDP and income observations come from the April 9, 2026 regional release (normalized snapshot dated 2026-08-31). Personal income, wages and real GDP run through calendar 2025. The state income-tax series (SAINC50) runs only through 2024. Real per capita personal income uses BEA regional price parities in constant 2017 dollars, through 2024, from the February 19, 2026 RPP release. BLS State and Area Employment figures are seasonally adjusted statewide monthly series from the August 24, 2026 snapshot and end in July 2026. These are vintage accounts, not current-day observations.
State income taxes are recorded in thousands of dollars; personal income and wages in millions of dollars. The tax-to-income share is (tax in thousands) / (personal income in millions) / 10, expressed as a percent. Zeros are observed zeros, not missing values. Washington’s 2022–24 income-tax totals are small and positive; they are not the 9.9 percent wage tax, which has not taken effect. Population is implied as personal income divided by per capita personal income and is rounded. Florida and Nevada appear on the 2024 tax-share chart with a zero share because their tax totals are zero; their personal-income extracts were not required for that identity. No causal claim is made about the ballot measure, the budget forecast, or whether Washington’s sales-and-business tax mix is adequate. Duplicate calendar years, if any, kept the first observation; none appeared in the employment extracts.
Research completed 2026-09-28, for the September 27, 2026 news edition. The available source data may cover earlier periods; see the observation periods and source vintages above.