Research
Virginia’s GDP kept rising. The jobs did not.
The payroll peak is already behind us
A University of Virginia forecast published this week put a polite label on an awkward combination: real GDP in Virginia is expanding again, but the state is still losing jobs, and a lot of the remaining growth may be tied to data centers. The official books do not need a forecast to show the second half of that sentence. Seasonally adjusted nonfarm payrolls in Virginia stood at 4,232,200 in July 2026, according to the Bureau of Labor Statistics. That was 47,900 jobs, or 1.1 percent, below July 2025. The series peaked in May 2025 at 4,289,400. From that high-water mark to July, Virginia shed about 57,000 jobs.
Those are establishment jobs, not a household survey and not a labor-force count. They still answer the question the forecast is dancing around. Virginia is not waiting to see whether hiring slows. Hiring already reversed. A 1.1 percent 12-month drop is not a 2009-style collapse. It is large enough, in a state that spent the post-pandemic years adding workers, to be the entire story if you live on a paycheck rather than on an output table.
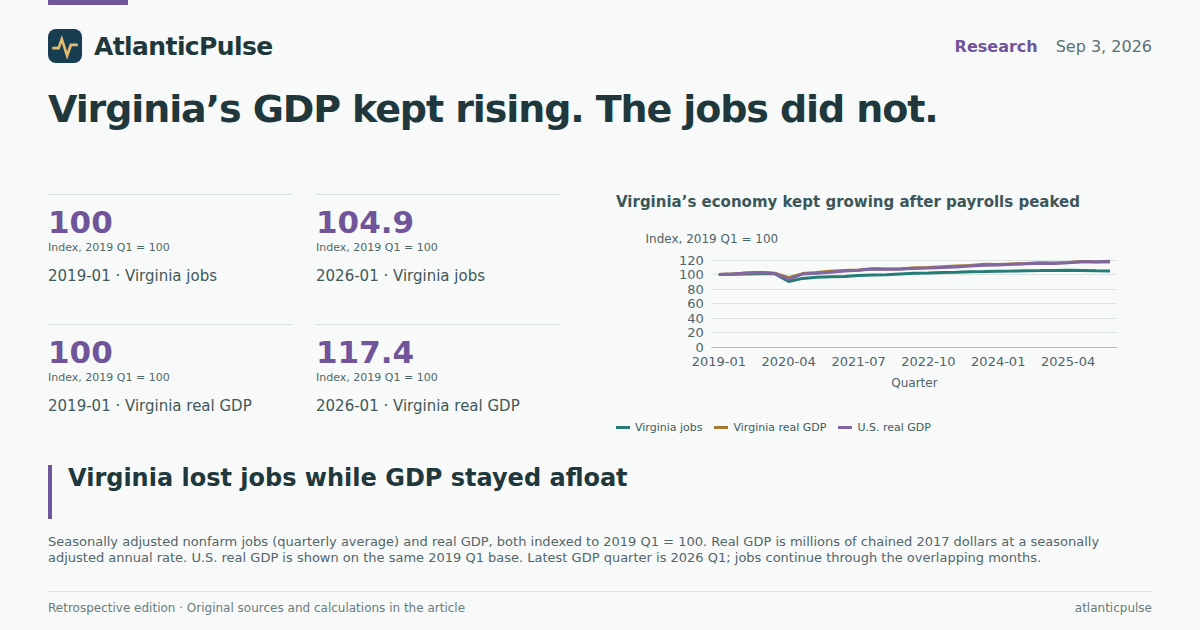
Virginia’s economy kept growing after payrolls peaked

View exact chart values
| quarter | va_jobs_index | va_gdp_index | va_jobs_thousands_qavg | va_gdp_chained2017_millions | us_gdp_index |
|---|---|---|---|---|---|
| 2019-01 | 100 | 100 | 4046.2 | 533744.8 | 100 |
| 2019-04 | 100.4 | 100.6 | 4061.63 | 536849 | 100.8 |
| 2019-07 | 100.6 | 102.2 | 4069.27 | 545541.4 | 102 |
| 2019-10 | 101 | 102.7 | 4085.1 | 547976.6 | 102.7 |
| 2020-01 | 101.1 | 101.7 | 4090.97 | 542710.3 | 101.4 |
| 2020-04 | 90.4 | 95.4 | 3657.03 | 509416.3 | 93.4 |
| 2020-07 | 94.6 | 101.3 | 3827.2 | 540752.7 | 100.6 |
| 2020-10 | 96.2 | 102.7 | 3893.73 | 548018.2 | 101.8 |
| 2021-01 | 96.8 | 104.4 | 3914.7 | 557136.8 | 103.2 |
| 2021-04 | 97.2 | 105.5 | 3934 | 563312.2 | 104.9 |
| 2021-07 | 98.5 | 106.3 | 3984.53 | 567481.1 | 105.8 |
| 2021-10 | 99.4 | 107.8 | 4020.5 | 575232.5 | 107.6 |
| 2022-01 | 99.7 | 107.4 | 4036.07 | 573454.6 | 107.3 |
| 2022-04 | 100.7 | 107.7 | 4074.43 | 574729.9 | 107.5 |
| 2022-07 | 101.7 | 109.2 | 4114.83 | 582924.4 | 108.3 |
| 2022-10 | 102.1 | 109.8 | 4130.9 | 586098.5 | 109 |
| 2023-01 | 102.9 | 110.8 | 4161.97 | 591222.1 | 109.8 |
| 2023-04 | 103.2 | 111.7 | 4175.07 | 596129.8 | 110.5 |
| 2023-07 | 103.8 | 112.6 | 4198.73 | 601251.1 | 111.8 |
| 2023-10 | 104 | 114 | 4209.27 | 608440.9 | 112.7 |
| 2024-01 | 104.5 | 113.8 | 4227.83 | 607243.5 | 113 |
| 2024-04 | 104.8 | 114.6 | 4241.2 | 611835 | 114 |
| 2024-07 | 105.2 | 115.3 | 4255.97 | 615503.9 | 114.9 |
| 2024-10 | 105.4 | 116.2 | 4266.57 | 620252.5 | 115.4 |
| 2025-01 | 105.7 | 116 | 4277.1 | 619328.1 | 115.3 |
| 2025-04 | 105.9 | 116.5 | 4286.8 | 622001.2 | 116.3 |
| 2025-07 | 105.7 | 117.8 | 4278.1 | 628655.8 | 117.6 |
| 2025-10 | 105.2 | 117.2 | 4256.17 | 625810.6 | 117.7 |
| 2026-01 | 104.9 | 117.4 | 4243.93 | 626535.1 | 118.3 |
Output kept climbing after hiring stopped
Real GDP is the other half of the forecast, and it is not moving in lockstep with payrolls. In 2026 Q1, Virginia’s real GDP was $626.5 billion at a seasonally adjusted annual rate, in chained 2017 dollars, according to the Bureau of Economic Analysis. That was 1.2 percent above 2025 Q1. The United States grew 2.7 percent over the same year. North Carolina grew 3.4 percent. Maryland grew 0.8 percent. Virginia is not in recession on this measure. It is also not matching the country.
Index both series to 2019 Q1 and the split is harder to miss. Virginia real GDP in 2026 Q1 was 17.4 percent above early 2019. Quarterly-average jobs were 4.9 percent above that same starting point. U.S. real GDP was 18.3 percent higher. The gap opened during the recovery and widened after payrolls peaked. GDP in Virginia actually slipped from 2025 Q3 to 2025 Q4, then edged up in 2026 Q1; the 12-month comparison is still positive. Jobs, by contrast, have been falling for a year. A growing economy with a shrinking workforce is not a slogan here. It is a pair of official lines that stopped traveling together.
That does not prove data centers caused the GDP number, and it does not prove artificial intelligence caused the job number. It does show that Virginia can post more output without posting more paychecks. The forecast’s warning that a data-center slowdown could take the remaining growth with it is a separate claim. The history already on the page is simpler: the state’s recent growth has been cheap in jobs.
Who actually lost the jobs
The losses are not a little of everything. Over the year to July 2026, professional and business services accounted for 22,100 of the missing jobs, a 2.7 percent drop. Most of that was the consulting-and-technical core: professional, scientific and technical services fell 18,100, or 3.9 percent. Federal government employment in Virginia fell 19,400, or 10.3 percent, to 169,900. Manufacturing lost 8,200. Construction lost 5,800. Information, a small sector on the payroll, lost 3,400, almost 5 percent.
The plus column is thinner and more public. Local government added 5,300 jobs. Health care and social assistance added 4,000. State government added 3,900. Leisure and hospitality added 3,400. Retail was roughly unchanged. Total government still fell 10,200 because the federal drop swamped the state and local gains. That is the opposite of a private-sector hiring boom with government getting out of the way. It is a federal contraction in a Beltway state, a consulting contraction in a contractor state, and a health-care sector that kept doing what health care does: hire through almost anything.
From December 2024 to July 2026 the same pattern is louder. Professional and business services were down 27,700. Federal employment was down 25,700. Manufacturing was down 13,100. Local government was up 14,000 and health care up 11,200. Construction, often cited as the data-center offset, was 2,100 above December 2024 even after the recent slip — so the year-over-year construction loss is a comedown from a 2025 bulge, not a collapse from the pre-pandemic floor.
Consulting and federal jobs accounted for most of Virginia’s payroll drop

View exact chart values
| industry | jul2025_thousands | jul2026_thousands | change_thousands | pct_change | dec2024_thousands | change_since_dec2024_thousands |
|---|---|---|---|---|---|---|
| Professional and business services | 806.8 | 784.7 | -22.1 | -2.74 | 812.4 | -27.7 |
| Federal government | 189.3 | 169.9 | -19.4 | -10.25 | 195.6 | -25.7 |
| Government (all) | 767.9 | 757.7 | -10.2 | -1.33 | 764.4 | -6.7 |
| Manufacturing | 237.2 | 229 | -8.2 | -3.46 | 242.1 | -13.1 |
| Construction | 230.6 | 224.8 | -5.8 | -2.52 | 222.7 | 2.1 |
| Information | 68.5 | 65.1 | -3.4 | -4.96 | 68.8 | -3.7 |
| Retail trade | 392.5 | 391.1 | -1.4 | -0.36 | 392.5 | -1.4 |
| Leisure and hospitality | 419.9 | 423.3 | 3.4 | 0.81 | 420 | 3.3 |
| State government | 164.3 | 168.2 | 3.9 | 2.37 | 163.2 | 5 |
| Health care and social assistance | 522.3 | 526.3 | 4 | 0.77 | 515.1 | 11.2 |
| Local government | 414.3 | 419.6 | 5.3 | 1.28 | 405.6 | 14 |
Federal payrolls broke first. Health care kept hiring.

View exact chart values
| month | pbs_index | mfg_index | gov_index | con_index | health_index | fed_index |
|---|---|---|---|---|---|---|
| 2019-07 | 100 | 100 | 100 | 100 | 100 | 100 |
| 2019-08 | 100.2 | 99.9 | 100 | 100.2 | 100.3 | 100.4 |
| 2019-09 | 100.1 | 99.7 | 99.9 | 100.2 | 101 | 100.1 |
| 2019-10 | 100.6 | 99.7 | 100.3 | 100.4 | 100.6 | 100.2 |
| 2019-11 | 100.9 | 99.7 | 100.2 | 100.5 | 100.7 | 100.3 |
| 2019-12 | 100.6 | 99.6 | 100 | 100.3 | 101.1 | 100.3 |
| 2020-01 | 101.1 | 99.9 | 100.5 | 101 | 100.8 | 101.5 |
| 2020-02 | 101 | 99.7 | 100.4 | 101.5 | 101 | 101.6 |
| 2020-03 | 100.8 | 99.6 | 101.1 | 101.2 | 100.8 | 101.9 |
| 2020-04 | 96.1 | 92.2 | 96.8 | 95.9 | 89.8 | 101 |
| 2020-05 | 96.5 | 91.3 | 95.1 | 97.3 | 91.7 | 101.3 |
| 2020-06 | 96.5 | 93.3 | 94.1 | 98.3 | 93.2 | 101.4 |
| 2020-07 | 97.2 | 94.4 | 93.3 | 98.3 | 94.4 | 102.2 |
| 2020-08 | 97.8 | 95.2 | 97.3 | 99.4 | 95.3 | 105.2 |
| 2020-09 | 98.4 | 95.7 | 96.3 | 100 | 96 | 105.1 |
| 2020-10 | 98.8 | 96.7 | 95.8 | 100.3 | 96.4 | 103.6 |
| 2020-11 | 99 | 97.1 | 95.6 | 100.5 | 97.1 | 102.5 |
| 2020-12 | 99.6 | 97.5 | 95.6 | 100.9 | 97.1 | 102.7 |
| 2021-01 | 100 | 97.5 | 95.6 | 101 | 97.2 | 102.5 |
| 2021-02 | 100.1 | 97.5 | 95.4 | 100.7 | 97 | 102.5 |
| 2021-03 | 100.6 | 97.7 | 95.7 | 100.9 | 97.1 | 102.5 |
| 2021-04 | 100.6 | 97.2 | 95.9 | 101.6 | 97.4 | 102.8 |
| 2021-05 | 100.9 | 97.1 | 96 | 101.8 | 97.5 | 102.5 |
| 2021-06 | 100.8 | 95.9 | 96.3 | 101.5 | 97.1 | 102.5 |
| 2021-07 | 101.4 | 97.2 | 96.2 | 101.8 | 98.4 | 102.5 |
| 2021-08 | 101.6 | 97.5 | 97.5 | 101.5 | 98.1 | 102.4 |
| 2021-09 | 101.8 | 97.3 | 97 | 101 | 97.1 | 102.6 |
| 2021-10 | 102.7 | 97.9 | 96.9 | 101.9 | 98.3 | 102.1 |
| 2021-11 | 103.1 | 98.3 | 96.4 | 102 | 98.6 | 102.1 |
| 2021-12 | 103.3 | 98.7 | 97.1 | 102.1 | 98.1 | 102 |
| 2022-01 | 103 | 98.6 | 96.6 | 101.2 | 98.3 | 102 |
| 2022-02 | 103.7 | 99.3 | 96.8 | 102 | 98.8 | 102.1 |
| 2022-03 | 103.6 | 100.1 | 96.8 | 102.2 | 98.6 | 101.9 |
| 2022-04 | 104.4 | 100.4 | 96.9 | 102.9 | 100.5 | 102.5 |
| 2022-05 | 104.5 | 100.4 | 97 | 102.7 | 100.7 | 102.7 |
| 2022-06 | 104.4 | 100.5 | 96.9 | 102.8 | 100.6 | 102.6 |
| 2022-07 | 105.3 | 100.8 | 97.1 | 103.4 | 100.8 | 102.7 |
| 2022-08 | 105.4 | 100.9 | 98.3 | 103.6 | 101.3 | 102.8 |
| 2022-09 | 105.5 | 101 | 98.4 | 104.1 | 101.4 | 103 |
| 2022-10 | 105.1 | 101.1 | 98.2 | 104.4 | 101.8 | 103.1 |
| 2022-11 | 105.2 | 101.1 | 98.6 | 104.5 | 102.2 | 103 |
| 2022-12 | 105 | 100.8 | 98.2 | 104.7 | 102.2 | 102.8 |
| 2023-01 | 105.5 | 101.3 | 98.2 | 105.6 | 103.4 | 103 |
| 2023-02 | 105.7 | 101.3 | 98.9 | 105.4 | 104 | 103 |
| 2023-03 | 105.4 | 101 | 99 | 105.5 | 103.9 | 103.2 |
| 2023-04 | 105.4 | 100.7 | 99.1 | 104.8 | 104.3 | 103.6 |
| 2023-05 | 105.5 | 100.8 | 99.3 | 104.8 | 104.9 | 103.7 |
| 2023-06 | 105.8 | 100.9 | 99.7 | 105 | 105.3 | 104 |
| 2023-07 | 105.3 | 100.8 | 99.9 | 104.9 | 106.1 | 104.1 |
| 2023-08 | 105.4 | 100.9 | 100.8 | 105.4 | 106.4 | 104.4 |
| 2023-09 | 105.5 | 100.9 | 100.9 | 106 | 106.8 | 104.9 |
| 2023-10 | 105.1 | 100.3 | 101 | 106 | 107.5 | 104.9 |
| 2023-11 | 105 | 100.4 | 101 | 106.4 | 107.5 | 104.7 |
| 2023-12 | 105.2 | 100.4 | 101.2 | 106.4 | 108.2 | 104.8 |
| 2024-01 | 104.9 | 100.8 | 101.7 | 106.4 | 108.5 | 105 |
| 2024-02 | 105.1 | 100.6 | 102.1 | 106.6 | 108.7 | 105.5 |
| 2024-03 | 105.4 | 100.4 | 103.1 | 106.7 | 109.2 | 105.5 |
| 2024-04 | 105.5 | 100.3 | 102 | 106.8 | 109.5 | 105.6 |
| 2024-05 | 105.7 | 100.2 | 102.4 | 106.9 | 109.5 | 106 |
| 2024-06 | 105.8 | 100.4 | 103 | 107.4 | 110.3 | 106.2 |
| 2024-07 | 106 | 100 | 102.3 | 108 | 111 | 106.4 |
| 2024-08 | 106 | 100 | 102.7 | 108.1 | 111.1 | 106.7 |
| 2024-09 | 106.2 | 100 | 103.2 | 108.2 | 111.7 | 106.7 |
| 2024-10 | 106 | 99.5 | 103.6 | 108.4 | 111.7 | 107.1 |
| 2024-11 | 105.9 | 99.5 | 103.8 | 108.9 | 112.2 | 107.4 |
| 2024-12 | 105.7 | 99.4 | 104 | 109.3 | 112.6 | 107.5 |
| 2025-01 | 106 | 98.9 | 103.9 | 109.6 | 112.8 | 107.5 |
| 2025-02 | 106 | 98.7 | 104 | 110.6 | 112.7 | 107.3 |
| 2025-03 | 105.7 | 98.6 | 103.8 | 111.3 | 113.4 | 105.5 |
| 2025-04 | 105.7 | 98.8 | 103.9 | 112.1 | 113.8 | 105.1 |
| 2025-05 | 105.6 | 98.6 | 103.9 | 112.8 | 114.2 | 104.6 |
| 2025-06 | 105.2 | 97.7 | 104.1 | 113.5 | 114.8 | 104.2 |
| 2025-07 | 104.9 | 97.4 | 104.4 | 113.2 | 114.2 | 104 |
| 2025-08 | 104.6 | 96.6 | 104.3 | 113.7 | 114.4 | 103.6 |
| 2025-09 | 104.5 | 96.3 | 104.3 | 113.7 | 114.4 | 103.3 |
| 2025-10 | 103.8 | 95.8 | 102.7 | 111.4 | 113.9 | 96 |
| 2025-11 | 104.6 | 95.6 | 103.3 | 111.3 | 114.1 | 96 |
| 2025-12 | 104.4 | 95.4 | 102.8 | 111.3 | 114.5 | 95.4 |
| 2026-01 | 103.6 | 94.5 | 102.4 | 111.7 | 114.8 | 93.6 |
| 2026-02 | 103.1 | 93.8 | 103 | 110.8 | 114.1 | 94.3 |
| 2026-03 | 102.8 | 94 | 103.1 | 112.1 | 114.6 | 93.8 |
| 2026-04 | 102.7 | 93.9 | 103.3 | 112.3 | 114.8 | 93.8 |
| 2026-05 | 102.1 | 93.6 | 103.5 | 111.4 | 114.7 | 93.6 |
| 2026-06 | 102.5 | 93.9 | 103.9 | 111 | 114.8 | 93.7 |
| 2026-07 | 102.1 | 94 | 103 | 110.4 | 115.1 | 93.4 |
Neighbors that are still hiring
If this were just a national soft patch, Virginia’s neighbors would look the same. They do not. Over the year to July 2026, the District of Columbia lost 4.2 percent of its nonfarm jobs, a steeper drop than Virginia’s. Maryland was essentially flat, down 600 jobs. West Virginia eked out a 0.2 percent gain. Georgia was slightly negative. Florida added 0.4 percent. Pennsylvania added 0.5 percent. North Carolina added 1.0 percent, or about 52,000 jobs — more than Virginia lost.
A Beltway federal-jobs shock explains some of this map and none of North Carolina’s. Virginia is not unique in depending on Washington, but it is unique among these eight states in pairing a federal drop with a consulting drop large enough to pull the whole payroll negative. The forecast’s line that Virginia is heading for a second straight year of job losses is, on the official monthly series, no longer a projection. It is a description of the last 12 months.
Construction is the industry the data-center debate wants to carry. Indexed to July 2019, Virginia construction jobs were still about 10 percent higher in July 2026. They peaked in the summer of 2025 and then gave some of that back. Real construction GDP, also from the BEA, was 7 percent above early 2019 in 2026 Q1. That is not a sector in free fall, and it is not large enough on the payroll to cancel a 22,000-job hole in professional services. If data-center building is propping up the economy, it is doing so more visibly in output than in a statewide construction headcount.
Among nearby states, only D.C. lost jobs faster than Virginia

View exact chart values
| state | jul2025_thousands | jul2026_thousands | change_thousands | pct_change |
|---|---|---|---|---|
| District of Columbia | 753.9 | 722.4 | -31.5 | -4.18 |
| Virginia | 4280.1 | 4232.2 | -47.9 | -1.12 |
| Georgia | 4993.2 | 4977.5 | -15.7 | -0.31 |
| Maryland | 2816.5 | 2815.9 | -0.6 | -0.02 |
| West Virginia | 718.8 | 720.2 | 1.4 | 0.19 |
| Florida | 9996.3 | 10037.3 | 41 | 0.41 |
| Pennsylvania | 6169.2 | 6201.1 | 31.9 | 0.52 |
| North Carolina | 5060.4 | 5112 | 51.6 | 1.02 |
The information boom without the information payroll
The cleanest official picture of a jobless boom is not construction. It is information. Real GDP in Virginia’s information sector — publishing, telecom, data processing and related services — was 84 percent above early 2019 in 2026 Q1. Information payrolls, as a quarterly average, were 1.2 percent below early 2019. The lines do not merely diverge. One nearly doubles; the other falls back through the starting gate.
That sector is not a synonym for data centers. It includes businesses that have nothing to do with a Loudoun County warehouse full of servers. It is still the industry group where the forecast’s story would show up if more output were coming from computing and less from people. On these books, that is what happened. Information jobs in July 2026 were 65,100, down 3,400 from a year earlier, while information GDP ran at a $40.2 billion annual rate. You can hire fewer people and still produce more of this stuff. Virginia appears to have been doing exactly that.
None of this measures household welfare, and none of it assigns a causal weight to any campus, tax break or moratorium. It does tell a reader what “GDP up, jobs down” looked like before the next forecast revision. The payroll peak was May 2025. The job losses are concentrated in the industries Virginia used to brag about. The output that kept rising is concentrated, at least in the information accounts, where the headcount did not. If the argument over data centers is an argument over whether Virginia wants that trade, the official statistics have already taken a side on the arithmetic.
Virginia’s information economy nearly doubled. Its information payroll did not.

View exact chart values
| quarter | information_gdp_index | information_jobs_index | information_gdp_millions | information_jobs_thousands_qavg |
|---|---|---|---|---|
| 2019-01 | 100 | 100 | 21828.1 | 67.43 |
| 2019-04 | 97.4 | 100.5 | 21250.7 | 67.77 |
| 2019-07 | 98.9 | 100.8 | 21595.6 | 67.97 |
| 2019-10 | 104.1 | 101 | 22726.7 | 68.13 |
| 2020-01 | 96.8 | 101.5 | 21129.5 | 68.47 |
| 2020-04 | 99.1 | 94.8 | 21633.7 | 63.9 |
| 2020-07 | 104.5 | 95.3 | 22812.5 | 64.27 |
| 2020-10 | 106.4 | 96.4 | 23223.8 | 65 |
| 2021-01 | 121 | 96.8 | 26419.3 | 65.3 |
| 2021-04 | 120.7 | 98.2 | 26342.1 | 66.2 |
| 2021-07 | 122.5 | 99.7 | 26748.5 | 67.23 |
| 2021-10 | 129.7 | 100.9 | 28308.2 | 68.07 |
| 2022-01 | 131.9 | 102.1 | 28795.6 | 68.83 |
| 2022-04 | 131.9 | 102.9 | 28799.9 | 69.37 |
| 2022-07 | 140.3 | 104.4 | 30614.3 | 70.4 |
| 2022-10 | 139.5 | 104.6 | 30456.9 | 70.53 |
| 2023-01 | 157.1 | 105 | 34298.1 | 70.83 |
| 2023-04 | 160.7 | 104.4 | 35082.2 | 70.4 |
| 2023-07 | 160.7 | 103.5 | 35082.1 | 69.77 |
| 2023-10 | 162.5 | 103.5 | 35479.3 | 69.77 |
| 2024-01 | 162.3 | 103.1 | 35427.7 | 69.53 |
| 2024-04 | 163.2 | 103.3 | 35620.4 | 69.63 |
| 2024-07 | 168.8 | 103 | 36853.4 | 69.43 |
| 2024-10 | 169.8 | 102.2 | 37066.9 | 68.93 |
| 2025-01 | 171.2 | 102 | 37380.6 | 68.77 |
| 2025-04 | 176.4 | 101.7 | 38497.2 | 68.57 |
| 2025-07 | 181.1 | 101.4 | 39530.4 | 68.4 |
| 2025-10 | 182 | 100.4 | 39730.8 | 67.7 |
| 2026-01 | 184.2 | 98.8 | 40198.5 | 66.6 |
Sources and methods
This is retrospective enrichment using pinned catalogue snapshots available to the research tools, not an as-known-on-2026-09-03 reconstruction. Later revisions may be present.
Research was prepared on 2026-09-11 against the 2026-09-03 State-News edition. Payroll observations are monthly from January 2015 through July 2026 for Virginia statewide series and from January 2023 through July 2026 for comparison states. Real GDP observations are quarterly through 2026 Q1.
Payroll source vintage is the BLS State and Area Employment snapshot dated 2026-08-24 (benchmark year 2025 in series metadata). GDP source vintage is the BEA regional quarterly release identified as bea-regional-state-quarterly-2026-06-25. PCE and other products were inspected in discovery and not used.
Employment figures are seasonally adjusted all-employees counts in thousands. They measure establishment jobs, not labor-force participation, unemployment, or population. Supersectors are not a complete accounting of every private industry. Federal, state and local government are components of total government; professional, scientific and technical services is a component of professional and business services. Those components are cited in prose and omitted from the industry bar chart where they would double-count.
Real GDP is in millions of chained 2017 dollars at a seasonally adjusted annual rate. Jobs-versus-GDP indexes use 2019 Q1 as 100, with jobs converted to a three-month quarterly average so the frequencies match. Supersector indexes use July 2019 = 100. Information GDP includes publishing, motion picture, broadcasting, telecom, data processing and related services; it is not a data-center employment count. Construction GDP and construction jobs are similarly descriptive, not a project-level census of data-center sites.
Null observations were excluded from calculations; missing is not treated as zero. No causal effect is inferred from the descriptive comparisons. The Weldon Cooper Center forecast discussed in the originating news is a separate model; this article reports BLS and BEA published series, which can differ from a calendar-year forecast in window, seasonal adjustment and revision status.
Research completed 2026-09-11, for the September 3, 2026 news edition. This is retrospective analysis, not a reconstruction of information available that day.