Research
Two scoreboards for the Trump-Xi table
The dollar scoreboard still favors Washington
China confirmed on Monday that Xi Jinping will make a state visit September 23–25, his first trip to the United States since 2023, after Treasury Secretary Scott Bessent called Sunday’s New York talks with Vice Premier He Lifeng “very successful.” The public agenda is a trade-truce extension, an AI incident channel, farm purchases, and the usual red lines. The private argument, in Washington and Beijing alike, is leverage: who needs the meeting more. Dollar GDP is the scoreboard American officials still reach for first.
On the IMF’s World Economic Outlook extract in this catalogue — a snapshot dated August 24, 2026, from a raw run on August 10 — the 2025 near-term estimate puts U.S. GDP at about $30.8 trillion at current dollars, against about $19.6 trillion for China. That is a Chinese economy equal to roughly 64 percent of America’s on the market-exchange measure, up from about 12 percent in 2000, when the IMF’s figures were $10.3 trillion and $1.2 trillion. The 2024 historical estimates were $29.3 trillion and $18.9 trillion. None of those 2025–26 readings is a live observation from UN week; years from 2026 onward in the same file are IMF projections.
The dollar gap is real, and it is also incomplete. Market GDP converts every Chinese factory, apartment, and high-speed rail line at whatever the yuan is fetching against the dollar that year. A weak yuan shrinks China on this chart without a single workshop closing. A strong dollar does the reverse for the United States. That is why the same IMF vintage tells a different story the moment the unit of account changes.
Market-exchange GDP: the U.S. is still the larger dollar economy

View exact chart values
| year | usa_trillion_usd | china_trillion_usd | china_share_of_usa_pct | status |
|---|---|---|---|---|
| 2000 | 10.25 | 1.22 | 11.9 | historical_estimate |
| 2001 | 10.58 | 1.35 | 12.8 | historical_estimate |
| 2002 | 10.93 | 1.49 | 13.6 | historical_estimate |
| 2003 | 11.46 | 1.68 | 14.7 | historical_estimate |
| 2004 | 12.22 | 1.98 | 16.2 | historical_estimate |
| 2005 | 13.04 | 2.33 | 17.8 | historical_estimate |
| 2006 | 13.82 | 2.8 | 20.3 | historical_estimate |
| 2007 | 14.47 | 3.61 | 25 | historical_estimate |
| 2008 | 14.77 | 4.66 | 31.5 | historical_estimate |
| 2009 | 14.48 | 5.18 | 35.8 | historical_estimate |
| 2010 | 15.05 | 6.14 | 40.8 | historical_estimate |
| 2011 | 15.6 | 7.63 | 48.9 | historical_estimate |
| 2012 | 16.25 | 8.68 | 53.4 | historical_estimate |
| 2013 | 16.88 | 9.79 | 58 | historical_estimate |
| 2014 | 17.61 | 10.7 | 60.8 | historical_estimate |
| 2015 | 18.3 | 11.31 | 61.8 | historical_estimate |
| 2016 | 18.8 | 11.45 | 60.9 | historical_estimate |
| 2017 | 19.61 | 12.52 | 63.8 | historical_estimate |
| 2018 | 20.66 | 14.11 | 68.3 | historical_estimate |
| 2019 | 21.54 | 14.59 | 67.8 | historical_estimate |
| 2020 | 21.38 | 15.11 | 70.7 | historical_estimate |
| 2021 | 23.73 | 18.18 | 76.6 | historical_estimate |
| 2022 | 26.05 | 18.34 | 70.4 | historical_estimate |
| 2023 | 27.81 | 18.37 | 66 | historical_estimate |
| 2024 | 29.3 | 18.95 | 64.7 | historical_estimate |
| 2025 | 30.77 | 19.63 | 63.8 | near_term_estimate |
| 2026 | 32.38 | 20.85 | 64.4 | projection |
| 2027 | 33.79 | 21.93 | 64.9 | projection |
| 2028 | 35.07 | 23.26 | 66.3 | projection |
| 2029 | 36.36 | 24.66 | 67.8 | projection |
| 2030 | 37.68 | 26.05 | 69.1 | projection |
| 2031 | 39.03 | 27.5 | 70.4 | projection |
Purchasing-power is a different country
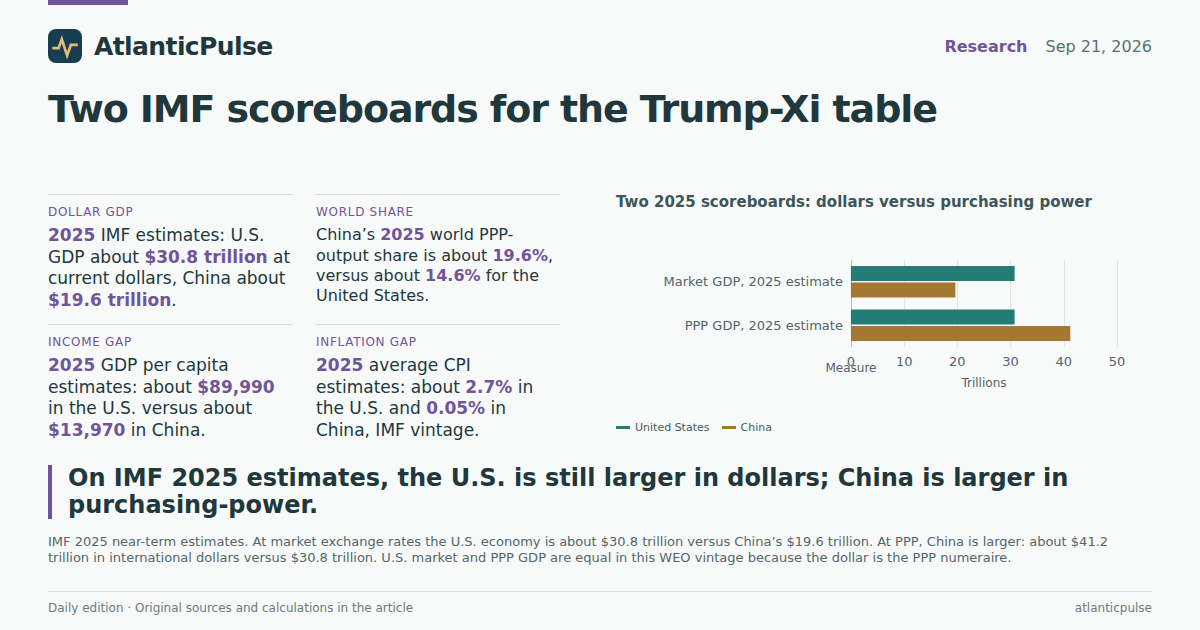
At purchasing-power parity, which tries to compare what a bundle of goods actually costs inside each economy, the IMF’s 2025 estimate puts China at about $41.2 trillion in international dollars and the United States at about $30.8 trillion — the same U.S. figure as on the market chart, because the dollar is the PPP numeraire in this vintage. China is larger on that measure by about $10.5 trillion. It first edged ahead in 2016 ($19.2 trillion versus $18.8 trillion) and has widened the lead since.
The world-share series makes the same point without the trillion-dollar adjectives. In 2000 the United States accounted for about 20.4 percent of world PPP output and China for 6.7 percent. By the 2025 estimate those shares are about 14.6 percent and 19.6 percent. The IMF’s 2026 projections, which should not be confused with this week’s data, nudge those figures to 14.5 percent and 19.9 percent. If the question is “who is a bigger piece of the global economy as households actually experience prices,” the IMF’s answer is China. If the question is “who clears more transactions in dollars,” it is still the United States.
That fork is the whole argument in miniature. Rare-earths leverage, soybean purchases, and an AI hotline are not settled by a single GDP print. They are settled, if at all, by the fact that both prints can be true at once.
On purchasing-power, China already has the larger slice of world output

View exact chart values
| year | usa_world_share_pct | china_world_share_pct | status |
|---|---|---|---|
| 2000 | 20.42 | 6.65 | historical_estimate |
| 2001 | 20.13 | 7.03 | historical_estimate |
| 2002 | 19.92 | 7.47 | historical_estimate |
| 2003 | 19.76 | 7.94 | historical_estimate |
| 2004 | 19.51 | 8.32 | historical_estimate |
| 2005 | 19.3 | 8.86 | historical_estimate |
| 2006 | 18.86 | 9.49 | historical_estimate |
| 2007 | 18.29 | 10.3 | historical_estimate |
| 2008 | 17.81 | 10.98 | historical_estimate |
| 2009 | 17.46 | 12.1 | historical_estimate |
| 2010 | 17.06 | 12.72 | historical_estimate |
| 2011 | 16.69 | 13.41 | historical_estimate |
| 2012 | 16.53 | 14.01 | historical_estimate |
| 2013 | 16.34 | 14.62 | historical_estimate |
| 2014 | 16.19 | 15.18 | historical_estimate |
| 2015 | 16.13 | 15.72 | historical_estimate |
| 2016 | 15.92 | 16.28 | historical_estimate |
| 2017 | 15.72 | 16.77 | historical_estimate |
| 2018 | 15.57 | 17.19 | historical_estimate |
| 2019 | 15.32 | 17.64 | historical_estimate |
| 2020 | 15.24 | 18.51 | historical_estimate |
| 2021 | 15.1 | 18.73 | historical_estimate |
| 2022 | 14.94 | 18.63 | historical_estimate |
| 2023 | 14.89 | 19.01 | historical_estimate |
| 2024 | 14.81 | 19.31 | historical_estimate |
| 2025 | 14.63 | 19.61 | near_term_estimate |
| 2026 | 14.54 | 19.88 | projection |
| 2027 | 14.38 | 20.05 | projection |
| 2028 | 14.23 | 20.2 | projection |
| 2029 | 14.06 | 20.31 | projection |
| 2030 | 13.88 | 20.37 | projection |
| 2031 | 13.71 | 20.41 | projection |
Two 2025 scoreboards: dollars versus purchasing power

View exact chart values
| metric | usa | china | unit |
|---|---|---|---|
| Market GDP, 2025 estimate | 30.77 | 19.63 | trillion current US$ |
| PPP GDP, 2025 estimate | 30.77 | 41.24 | trillion international $ |
China still grows faster. Double digits are a memory.
The growth series is the one Chinese communiqués prefer and American hawks discount. The IMF’s 2025 real-GDP estimate is about 5.0 percent for China and 2.1 percent for the United States. The 2026 projections are 4.4 percent and 2.3 percent. Those are still faster Chinese expansions. They are not the 10-to-14 percent rates of the mid-2000s, and they are not proof that a trade truce will, or will not, be extended on Friday.
What the history does show is a long downshift that was already in the books before this week’s summit choreography. China’s 2022 reading was 3.1 percent; 2023 was 5.4 percent; 2024’s estimate is 5.0 percent. The United States, after the 2020 contraction and 2021 rebound, has been in a 2-to-3 percent band. The IMF does not, in this extract, identify which years are fully realized outturns versus still-open estimates; the conservative reading is that 2024 is a historical estimate, 2025 is near-term, and 2026–31 are projections from an August snapshot that cannot see September’s diesel spike.
China still grows faster, but the double-digit years are gone

View exact chart values
| year | usa_real_growth_pct | china_real_growth_pct | status |
|---|---|---|---|
| 2000 | 4.08 | 8.57 | historical_estimate |
| 2001 | 0.96 | 8.32 | historical_estimate |
| 2002 | 1.7 | 9.21 | historical_estimate |
| 2003 | 2.8 | 10.12 | historical_estimate |
| 2004 | 3.85 | 10.12 | historical_estimate |
| 2005 | 3.48 | 11.44 | historical_estimate |
| 2006 | 2.78 | 12.66 | historical_estimate |
| 2007 | 2 | 14.15 | historical_estimate |
| 2008 | 0.11 | 9.64 | historical_estimate |
| 2009 | -2.58 | 9.45 | historical_estimate |
| 2010 | 2.7 | 10.59 | historical_estimate |
| 2011 | 1.56 | 9.45 | historical_estimate |
| 2012 | 2.29 | 7.85 | historical_estimate |
| 2013 | 2.12 | 7.77 | historical_estimate |
| 2014 | 2.52 | 7.49 | historical_estimate |
| 2015 | 2.95 | 7.02 | historical_estimate |
| 2016 | 1.82 | 6.78 | historical_estimate |
| 2017 | 2.46 | 6.89 | historical_estimate |
| 2018 | 2.97 | 6.76 | historical_estimate |
| 2019 | 2.58 | 6.06 | historical_estimate |
| 2020 | -2.08 | 2.34 | historical_estimate |
| 2021 | 6.15 | 8.56 | historical_estimate |
| 2022 | 2.52 | 3.11 | historical_estimate |
| 2023 | 2.93 | 5.38 | historical_estimate |
| 2024 | 2.79 | 5 | historical_estimate |
| 2025 | 2.12 | 4.96 | near_term_estimate |
| 2026 | 2.32 | 4.41 | projection |
| 2027 | 2.1 | 4.03 | projection |
| 2028 | 2.1 | 4 | projection |
| 2029 | 1.88 | 3.67 | projection |
| 2030 | 1.75 | 3.35 | projection |
| 2031 | 1.75 | 3.29 | projection |
Inflation, the current account, and a 6-to-1 income gap
The inflation comparison is the least comfortable chart for a White House that is asking voters to treat $4 gasoline as a bargain. Average consumer-price inflation in the IMF’s 2025 estimate is about 2.7 percent in the United States and 0.05 percent in China. The 2024 estimates were 3.0 percent and 0.2 percent. The 2026 projections, made before this week’s record diesel print, are 3.2 percent and 1.2 percent. That is not a claim that Chinese statistics are freely collected, and it is not a household grocery bill. It is the official WEO series, and it says the two economies are not in the same price cycle.
The external balances line up with the trade-talk talking points, without proving them. The IMF’s 2025 current-account estimate is a U.S. deficit of about 3.6 percent of GDP and a Chinese surplus of about 3.7 percent. In 2024 those figures were a 4.1 percent U.S. deficit and a 2.2 percent Chinese surplus. A surplus is not a moral victory and a deficit is not a surrender; they are accounting identities with political afterlives. They help explain why Washington wants China to buy more soybeans and Boeing jets, and why Beijing can treat those purchases as concessions rather than favors.
Income per person remains the American trump card, if the metaphor can be forgiven. The 2025 GDP-per-capita estimates are about $89,990 in the United States and $13,970 in China, a ratio of roughly 6.4 to 1. In 2000 the ratio was about 38 to 1 ($36,310 versus $960). The catch-up is enormous. The remaining gap is still the difference between a rich country and a middle-income one. General-government gross debt, on the same vintage, is estimated at about 124 percent of GDP in the United States in 2025 and 99 percent in China — a narrower gap than the income comparison, and a reminder that “who is bigger” depends on which column you read.
The inflation gap is as wide as the growth gap, in the other direction

View exact chart values
| year | usa_cpi_pct | china_cpi_pct | status |
|---|---|---|---|
| 2000 | 3.37 | 0.35 | historical_estimate |
| 2001 | 2.82 | 0.72 | historical_estimate |
| 2002 | 1.6 | -0.77 | historical_estimate |
| 2003 | 2.3 | 1.16 | historical_estimate |
| 2004 | 2.67 | 3.89 | historical_estimate |
| 2005 | 3.37 | 1.81 | historical_estimate |
| 2006 | 3.22 | 1.47 | historical_estimate |
| 2007 | 2.87 | 4.77 | historical_estimate |
| 2008 | 3.81 | 5.84 | historical_estimate |
| 2009 | -0.32 | -0.69 | historical_estimate |
| 2010 | 1.64 | 3.33 | historical_estimate |
| 2011 | 3.14 | 5.42 | historical_estimate |
| 2012 | 2.07 | 2.62 | historical_estimate |
| 2013 | 1.47 | 2.63 | historical_estimate |
| 2014 | 1.62 | 1.99 | historical_estimate |
| 2015 | 0.12 | 1.44 | historical_estimate |
| 2016 | 1.27 | 2 | historical_estimate |
| 2017 | 2.13 | 1.58 | historical_estimate |
| 2018 | 2.44 | 2.09 | historical_estimate |
| 2019 | 1.81 | 2.91 | historical_estimate |
| 2020 | 1.25 | 2.49 | historical_estimate |
| 2021 | 4.68 | 0.92 | historical_estimate |
| 2022 | 7.99 | 1.98 | historical_estimate |
| 2023 | 4.13 | 0.23 | historical_estimate |
| 2024 | 2.95 | 0.21 | historical_estimate |
| 2025 | 2.73 | 0.05 | near_term_estimate |
| 2026 | 3.23 | 1.22 | projection |
| 2027 | 2.14 | 1.51 | projection |
| 2028 | 2.18 | 1.8 | projection |
| 2029 | 2.19 | 1.9 | projection |
| 2030 | 2.19 | 2 | projection |
| 2031 | 2.18 | 1.99 | projection |
What the books do not tell Thursday’s dinner guests
None of this measures rare earths, AI chips, or the Strait of Hormuz. It does not say whether an AI notification mechanism becomes a hotline or a press release. It does not score the Board of Trade, the $17 billion farm pledge, or Taiwan. The IMF file in this catalogue is a semi-annual macro dataset with mixed historical estimates and projections; the snapshot is mid-August 2026, so it cannot incorporate this week’s oil move, the UN speeches, or whatever is said over the state dinner Tim Cook and Sam Altman are expected to attend.
What it can do is puncture two equally lazy stories. One is that China has already “won” and is dictating terms. On dollar GDP and income per person, it has not. The other is that the United States still towers over the only peer competitor that matters. On purchasing-power and world share, it does not. Xi is visiting a country whose IMF-estimated 2025 economy is still larger in dollars and much richer per person, and which is also the smaller slice of world PPP output, running a current-account deficit, with faster consumer-price inflation. That is an awkward pair of facts. It is also a better briefing note than a single chart labeled “who’s winning.”
Sources and methods
All figures come from the pinned IMF World Economic Outlook product (catalogue snapshot created 2026-08-24 UTC; raw run 20260810). Observation dates are January 1 of each year and are not release dates or current-day readings.
Years through 2024 are treated as historical estimates; 2025 as a near-term estimate; 2026–2031 as IMF projections. The extract does not flag realized versus projected rows; that split is a conservative reading of WEO practice, not a field in the file.
U.S. market-dollar GDP and U.S. PPP GDP are identical in this vintage because the U.S. dollar is the PPP numeraire. That is a unit-of-account feature, not a finding that the two measures “agree” on the American economy.
GDP totals are converted from stored U.S. dollars into trillions by dividing by 1e12. Percentages and ratios are rounded for display; underlying extracts keep full precision. Nulls are omitted, not zeroed. U.S. general-government debt is missing for 2000 in this extract. Chinese unemployment exists only from 2017 and was not used in the article charts.
No causal claim is made about the trade truce, AI talks, rare earths, or the Iran war. IMF inflation is an annual average CPI series and is not the weekly AAA diesel or gasoline average in today’s reporting.
Provider/refresh lag is normal. This is not a reconstruction of what officials knew on September 21, 2026.
Research completed 2026-09-22, for the September 21, 2026 news edition. The available source data may cover earlier periods; see the observation periods and source vintages above.
- IMF World Economic Outlook: Source 1