Research
Thirteen-to-one, and the factories already in the fight
The size of the table they just flipped
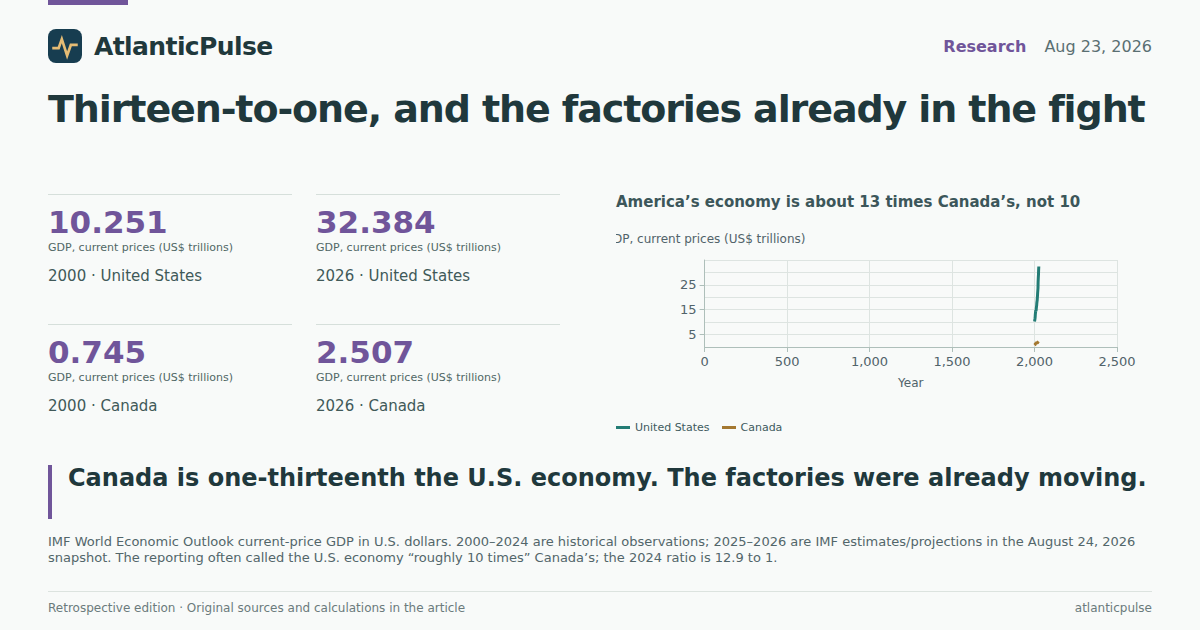
Prime Minister Mark Carney said Canada had been “attacked.” U.S. officials promised that retaliation would be devastating for Ottawa. Both claims rest on a fact the two countries have lived with for decades: this is not a fight between peers. The IMF World Economic Outlook puts U.S. current-price GDP at $29.3 trillion in 2024 and Canada’s at $2.27 trillion — a ratio of 12.9 to 1. The 2025 IMF estimates, which should be read as estimates rather than settled history, put the gap at 13.3 to 1. News copy this weekend often rounded the U.S. economy to “roughly 10 times” Canada’s. The official ratio is larger than that, and it has been in that neighborhood for most of the past decade.
Size is not the same as pain. Canada’s goods exports still run overwhelmingly south, which is why a 50% levy on a slice of those shipments can rattle Ontario and Alberta even when it is a rounding error in U.S. GDP. The IMF does not, in this extract, give bilateral trade. What it does show is how differently the two countries sit in the world. In 2024 the United States ran a current-account deficit equal to 4.05% of GDP; Canada’s deficit was 0.48%. America is the larger, more closed economy that still borrows from the rest of the world. Canada is the smaller one whose external accounts are closer to balance — and whose factories, mines, and pipelines are wired into a single North American production line.
Per-person, the gap is smaller but still real. IMF current-price GDP per capita in 2024 was about $86,200 in the United States and $55,200 in Canada. Inflation last year averaged 2.95% in the U.S. and 2.38% in Canada; real GDP grew 2.79% and 2.05%. The 2025 IMF estimates slow both countries (2.12% and 1.74%) without closing the size gap. None of that tells you who “wins” a tariff war. It does tell you why Ottawa can match Washington dollar for dollar on a $20 billion list and still be the side that feels the hit first.
America’s economy is about 13 times Canada’s, not 10

View exact chart values
| year | us_gdp_trillion | canada_gdp_trillion | us_to_canada_ratio | status |
|---|---|---|---|---|
| 2000 | 10.251 | 0.745 | 13.77 | historical |
| 2001 | 10.582 | 0.739 | 14.32 | historical |
| 2002 | 10.929 | 0.76 | 14.38 | historical |
| 2003 | 11.456 | 0.896 | 12.79 | historical |
| 2004 | 12.217 | 1.026 | 11.9 | historical |
| 2005 | 13.039 | 1.174 | 11.11 | historical |
| 2006 | 13.816 | 1.319 | 10.47 | historical |
| 2007 | 14.474 | 1.469 | 9.85 | historical |
| 2008 | 14.77 | 1.553 | 9.51 | historical |
| 2009 | 14.478 | 1.377 | 10.52 | historical |
| 2010 | 15.049 | 1.617 | 9.3 | historical |
| 2011 | 15.6 | 1.793 | 8.7 | historical |
| 2012 | 16.254 | 1.828 | 8.89 | historical |
| 2013 | 16.881 | 1.847 | 9.14 | historical |
| 2014 | 17.608 | 1.806 | 9.75 | historical |
| 2015 | 18.295 | 1.557 | 11.75 | historical |
| 2016 | 18.805 | 1.528 | 12.31 | historical |
| 2017 | 19.612 | 1.649 | 11.89 | historical |
| 2018 | 20.657 | 1.725 | 11.97 | historical |
| 2019 | 21.54 | 1.744 | 12.35 | historical |
| 2020 | 21.375 | 1.656 | 12.91 | historical |
| 2021 | 23.726 | 2.022 | 11.73 | historical |
| 2022 | 26.055 | 2.201 | 11.84 | historical |
| 2023 | 27.812 | 2.197 | 12.66 | historical |
| 2024 | 29.298 | 2.27 | 12.91 | historical |
| 2025 | 30.767 | 2.32 | 13.26 | IMF projection/estimate |
| 2026 | 32.384 | 2.507 | 12.92 | IMF projection/estimate |
The U.S. runs a much wider current-account deficit

View exact chart values
| year | us_current_account_pct_gdp | canada_current_account_pct_gdp | status |
|---|---|---|---|
| 2000 | -3.92 | 2.55 | historical |
| 2001 | -3.72 | 2.21 | historical |
| 2002 | -4.17 | 1.74 | historical |
| 2003 | -4.56 | 1.23 | historical |
| 2004 | -5.2 | 2.35 | historical |
| 2005 | -5.75 | 1.93 | historical |
| 2006 | -5.91 | 1.44 | historical |
| 2007 | -5.09 | 0.82 | historical |
| 2008 | -4.72 | 0.15 | historical |
| 2009 | -2.62 | -2.91 | historical |
| 2010 | -2.87 | -3.56 | historical |
| 2011 | -2.92 | -2.71 | historical |
| 2012 | -2.57 | -3.53 | historical |
| 2013 | -2.01 | -3.14 | historical |
| 2014 | -2.1 | -2.32 | historical |
| 2015 | -2.23 | -3.5 | historical |
| 2016 | -2.11 | -3.09 | historical |
| 2017 | -1.87 | -2.8 | historical |
| 2018 | -2.13 | -2.38 | historical |
| 2019 | -2.05 | -1.95 | historical |
| 2020 | -2.78 | -2.02 | historical |
| 2021 | -3.62 | -0.02 | historical |
| 2022 | -3.81 | -0.46 | historical |
| 2023 | -3.34 | -0.69 | historical |
| 2024 | -4.05 | -0.48 | historical |
| 2025 | -3.63 | -0.94 | IMF projection/estimate |
| 2026 | -3.7 | -0.22 | IMF projection/estimate |
The auto line was already drifting
The collapsed deal was not about hockey sticks. It was about cars, steel, aluminum, and who gets to write the next trade clause. BLS payrolls for motor vehicles and parts — seasonally adjusted, in thousands — stood at 975,500 in January 2025, when the second Trump term began. By July 2026 they were 964,500, down 1.1%. That is not a collapse. It is also not growth. The same industry employed 661,200 people in January 2010, so the long recovery from the financial crisis is still intact even as the latest eighteen months have given some of it back.
Primary metal manufacturing, the closest official stand-in for the steel mills in the political argument, moved the other way: 363,900 jobs in January 2025 and 367,000 in July 2026, up 0.9%. All manufacturing slipped 0.5%, from 12.673 million to 12.611 million. Average hourly earnings in motor vehicles and parts rose from $35.57 to $37.98 over the same stretch. Indexed to January 2025, auto payrolls are the weak line; metals are the flat-to-up one. The pandemic crater is still visible in 2020. What is not visible is a sudden 2026 break that matches the Saturday tariff. These are establishment counts through July, before the new 50% list took effect.
The honest reading is modest and unsatisfying, which is usually the honest reading. Auto employment has been easing since late 2023, when it last sat above 1.03 million. Steel-related payrolls never got that far above their 2010s range. Anyone who wants the new tariffs to “bring the jobs home” is arguing with a line that has already been mostly rebuilt. Anyone who wants them to be costless is arguing with an industry that has already stopped adding people.
Auto payrolls have slipped since the second-term start. Steel has not.

View exact chart values
| month | auto_index | metals_index | manufacturing_index |
|---|---|---|---|
| 2020-01 | 100.41 | 104.37 | 100.57 |
| 2020-02 | 101.2 | 104.4 | 100.55 |
| 2020-03 | 100.5 | 104.26 | 100.09 |
| 2020-04 | 64.44 | 96.02 | 89.81 |
| 2020-05 | 68.91 | 93.51 | 91.61 |
| 2020-06 | 88.82 | 94.89 | 94.29 |
| 2020-07 | 93.29 | 94.39 | 94.48 |
| 2020-08 | 92.89 | 94.42 | 94.68 |
| 2020-09 | 94.13 | 94.12 | 95.14 |
| 2020-10 | 94.14 | 94.64 | 95.37 |
| 2020-11 | 96.16 | 95.08 | 95.62 |
| 2020-12 | 96.69 | 94.81 | 95.9 |
| 2021-01 | 97.42 | 94.75 | 95.81 |
| 2021-02 | 97.79 | 94.48 | 96.05 |
| 2021-03 | 98.82 | 95.14 | 96.5 |
| 2021-04 | 93.39 | 95.63 | 96.21 |
| 2021-05 | 95.66 | 95.82 | 96.39 |
| 2021-06 | 95.85 | 96.4 | 96.64 |
| 2021-07 | 97.72 | 97 | 97.1 |
| 2021-08 | 99.36 | 96.81 | 97.47 |
| 2021-09 | 99.19 | 96.84 | 97.79 |
| 2021-10 | 102.27 | 97 | 98.26 |
| 2021-11 | 101.6 | 97.69 | 98.62 |
| 2021-12 | 101.63 | 98.05 | 98.93 |
| 2022-01 | 101.97 | 98.57 | 99.14 |
| 2022-02 | 99.61 | 99.26 | 99.43 |
| 2022-03 | 102.12 | 99.01 | 100.01 |
| 2022-04 | 103.07 | 99.2 | 100.42 |
| 2022-05 | 101.68 | 99.45 | 100.49 |
| 2022-06 | 102.04 | 99.51 | 100.74 |
| 2022-07 | 102.36 | 99.92 | 101 |
| 2022-08 | 104.1 | 100.36 | 101.25 |
| 2022-09 | 104.19 | 101.24 | 101.39 |
| 2022-10 | 104.95 | 101.65 | 101.66 |
| 2022-11 | 105.17 | 101.79 | 101.76 |
| 2022-12 | 105.64 | 102.14 | 101.75 |
| 2023-01 | 105.22 | 102.03 | 101.81 |
| 2023-02 | 105.42 | 102.17 | 101.78 |
| 2023-03 | 105.19 | 102.69 | 101.7 |
| 2023-04 | 105.69 | 102.45 | 101.66 |
| 2023-05 | 105.41 | 102.75 | 101.55 |
| 2023-06 | 105.33 | 103.16 | 101.59 |
| 2023-07 | 105.07 | 103.52 | 101.49 |
| 2023-08 | 104.85 | 103.65 | 101.48 |
| 2023-09 | 105.39 | 103.41 | 101.57 |
| 2023-10 | 102.41 | 103.22 | 101.29 |
| 2023-11 | 105.21 | 102.67 | 101.47 |
| 2023-12 | 105.34 | 102.89 | 101.57 |
| 2024-01 | 105.32 | 102.69 | 101.59 |
| 2024-02 | 104.4 | 102.45 | 101.41 |
| 2024-03 | 104.57 | 102.12 | 101.29 |
| 2024-04 | 104.3 | 102.75 | 101.26 |
| 2024-05 | 104.13 | 102.2 | 101.2 |
| 2024-06 | 104.33 | 102.09 | 101.11 |
| 2024-07 | 104.71 | 101.54 | 101.05 |
| 2024-08 | 103.13 | 101.35 | 100.78 |
| 2024-09 | 102.47 | 100.82 | 100.67 |
| 2024-10 | 102.12 | 100.58 | 100.19 |
| 2024-11 | 101.92 | 100.3 | 100.3 |
| 2024-12 | 101.26 | 100.03 | 100.16 |
| 2025-01 | 100 | 100 | 100 |
| 2025-02 | 100.41 | 100.33 | 99.98 |
| 2025-03 | 99.98 | 100.25 | 99.94 |
| 2025-04 | 99.65 | 100.19 | 99.91 |
| 2025-05 | 99.88 | 100.22 | 99.83 |
| 2025-06 | 99.54 | 99.97 | 99.71 |
| 2025-07 | 99.99 | 100.19 | 99.62 |
| 2025-08 | 98.74 | 99.84 | 99.54 |
| 2025-09 | 98.5 | 99.86 | 99.52 |
| 2025-10 | 97.96 | 99.64 | 99.45 |
| 2025-11 | 97.93 | 99.67 | 99.37 |
| 2025-12 | 97.49 | 99.84 | 99.27 |
| 2026-01 | 97.62 | 100.08 | 99.28 |
| 2026-02 | 98.14 | 100.05 | 99.29 |
| 2026-03 | 98.32 | 100 | 99.41 |
| 2026-04 | 97.77 | 100.44 | 99.4 |
| 2026-05 | 98.1 | 100.71 | 99.38 |
| 2026-06 | 98.06 | 100.69 | 99.47 |
| 2026-07 | 98.87 | 100.85 | 99.51 |
Michigan added factory jobs. New York did not.
National totals hide the border. State manufacturing payrolls, seasonally adjusted, show Ohio adding 13,600 factory jobs between January 2025 and July 2026, Michigan adding 6,800, and Washington adding 1,200. New York lost 12,400, Indiana 6,500, Wisconsin 2,700. Those are not tiny states in the Canada story. Michigan and Ontario still share an auto industry that treats the Detroit River as an inconvenience. Indiana and Ohio stamp, assemble, and ship. New York and Washington sit on other edges of the old free-trade map — dairy, lumber, aircraft parts, pulp.
The same series, stretched back to January 2015, is a reminder that “factory state” is not a frozen identity. New York manufacturing has been shrinking for a decade (455,200 then, 397,200 now). Michigan in July 2026 (585,500) is almost exactly where it was in January 2015 (585,400), after a long round trip through boom, pandemic, and strike years. Ohio is slightly above its 2015 level. Indiana is roughly flat. If the new tariffs are meant to reverse a collapse, they are arriving after the collapse, in most of these states, already happened — or didn’t.
Do not read those bars as a scorecard for Carney or Lutnick. State factory jobs move with vehicle cycles, Boeing and GM schedules, local energy costs, and sampling noise. The only claim the data support is narrower: as of July, before Saturday’s 50% list, the Great Lakes manufacturing payroll had not rolled over as a bloc.
Great Lakes factories did not all shrink as the fight deepened

View exact chart values
| state | jan_2025_thousands | jul_2026_thousands | change_thousands | pct_change | jan_2015_thousands |
|---|---|---|---|---|---|
| New York | 409.6 | 397.2 | -12.4 | -3.03 | 455.2 |
| Indiana | 518.5 | 512 | -6.5 | -1.25 | 515.1 |
| Wisconsin | 461.1 | 458.4 | -2.7 | -0.59 | 470.4 |
| Washington | 274.8 | 276 | 1.2 | 0.44 | 291.4 |
| Michigan | 578.7 | 585.5 | 6.8 | 1.18 | 585.4 |
| Ohio | 675.1 | 688.7 | 13.6 | 2.01 | 685.2 |
Where the cars actually get made
Payrolls count heads. Output counts engines. BEA real GDP in motor vehicles, bodies, trailers, and parts — chained 2017 dollars — put the U.S. industry at $204.0 billion in 2024, the latest complete year in this extract (2025 cells were not populated). Michigan alone accounted for $48.2 billion, 23.6% of the national total. Indiana contributed $22.8 billion, Ohio $13.1 billion, Tennessee $12.3 billion, Kentucky $11.7 billion, Alabama $8.8 billion. The old map still holds, even as the South has taken a larger slice than it did in 2010.
That geography is why a fight over Canadian-built trucks and U.S. steel content is not an abstraction in Lansing or Kokomo. A plant on one side of the river buys stampings from the other. A 50% tariff that hits “some products that were previously protected under” the USMCA, as the weekend reporting put it, is a tax on that wiring. The BEA figures cannot say how much of Michigan’s $48 billion crosses the Ambassador Bridge. They can say the state still has more auto output than Indiana and Ohio combined, and that the industry’s real value has more than doubled nationally since 2010 ($96.9 billion then).
Hourly earnings in the auto plants have risen too, which is the part of the story that rarely fits a tariff speech. The jobs that remain are more expensive than they were. Flooding the market with imported metal or protecting it with a Depression-era statute does not, by itself, recreate the 1970s headcount.
Michigan still makes about a quarter of U.S. auto output

View exact chart values
| state | real_gdp_billions | real_gdp_2010_billions | pct_change_since_2010 |
|---|---|---|---|
| Michigan | 48.2 | 28.04 | 71.9 |
| Indiana | 22.75 | 14.38 | 58.2 |
| Ohio | 13.11 | 7.45 | 76.1 |
| Tennessee | 12.31 | 4.71 | 161.3 |
| Kentucky | 11.74 | 5.51 | 113.1 |
| Alabama | 8.84 | 3.36 | 162.7 |
What the numbers cannot tell you
Two limits matter more than the charts. First, none of these series measure bilateral U.S.–Canada trade. The IMF current account is global; BLS payrolls are domestic; BEA auto GDP is production on U.S. soil. Canada’s 72% export share to the United States, cited in the weekend reporting, is not in this catalogue, and inventing it from GDP ratios would be malpractice. Second, a descriptive comparison is not a causal estimate. Auto jobs can fall because of a strike, a model-year changeover, or a tariff threat that never shows up as a line item labeled “Section 338.”
What the official record does support is a more useful kind of caution. The United States is more than twelve times Canada’s size, runs a much larger current-account deficit, and still concentrates nearly a quarter of its auto output in one state that shares a river with Ontario. Its auto payrolls have already stopped rising. Some of the factory states most entangled with Canada have added jobs since January 2025; others have not. Matching tariffs “dollar for dollar” on a $20 billion list is political symmetry, not economic symmetry. The data will not tell you who blinked. They will tell you who had more room to.
The next payroll print after Saturday’s tariffs will be more interesting than this one. Until then, the scoreboard is the one that was already hanging on the wall: a 13-to-1 economy, a thinner auto headcount than last winter, and a Michigan that still builds a lot of cars.
Sources and methods
This is retrospective enrichment using pinned catalogue snapshots, not an as-known-on-edition-date reconstruction. The historical edition date is 2026-08-23. Research was compiled on 2026-09-11 from sealed local extracts.
IMF World Economic Outlook series (GDP at current U.S. dollars, GDP per capita, current-account balance as a percent of GDP, average consumer-price inflation, and real GDP growth) were extracted for USA and CAN for 2000–2026. The IMF snapshot is dated 2026-08-24. Years 2000–2024 are treated as historical; 2025–2026 are labeled IMF estimates/projections. The WEO file does not attach a realized/forecast flag to each row, so that split is a dating convention, not a field in the extract. Export and import level series returned no observations for these geographies and were not used.
BLS Current Employment Statistics (national, seasonally adjusted monthly) cover all employees in manufacturing, motor vehicles and parts, and primary metal manufacturing, plus average hourly earnings in motor vehicles and parts, January 2010–July 2026. Snapshot release bls-ce-snapshot-2026-08-24. Units are thousands of jobs except earnings in dollars per hour.
BLS State and Area Employment, seasonally adjusted statewide manufacturing all-employees series, January 2015–July 2026, for Michigan, Ohio, Indiana, Wisconsin, New York, and Washington. Snapshot bls-sm-snapshot-2026-08-24.
BEA annual real GDP (millions of chained 2017 dollars) for motor vehicles, bodies and trailers, and parts manufacturing, 2010–2024. The 2025 cells were not populated in this extract and are omitted. BEA release bea-regional-state-annual-2026-04-09; normalized snapshot 2026-08-31.
Null observations were not treated as zero. No duplicate periods were found in the used series. Dollar GDP was converted to trillions or billions by dividing by 1e12 or 1,000 as labeled. Percent changes use (new − old) / old. Indexes use January 2025 = 100. State auto-GDP shares use 2024 Michigan divided by 2024 U.S. industry total.
Material limitations: no bilateral U.S.–Canada trade series are in the indexed catalogue; payrolls are not tariff incidence; current-account balances are global, not bilateral; later WEO and CES revisions may differ from these snapshots. Descriptive comparisons are not causal estimates of the August 2026 tariffs, which took effect after the July payroll month.
Research completed 2026-09-11, for the August 23, 2026 news edition. This is retrospective analysis, not a reconstruction of information available that day.