Research
The Wires Are Winning: Electricity's Quiet Takeover of the American Energy Bill
The mandate, and the meter
President Trump's latest answer to the data-center backlash is, in essence, a tip jar. After months of local fights over water, watts and property values, he argued that developers should pay communities a "dividend" and generate their own electricity rather than leaning on the grid. The political context is not subtle: a Consumer Reports survey of more than 2,000 adults found about one in five Americans had cut back on groceries to afford their electricity bills, roughly a quarter kept their homes uncomfortably hot or cold to save money, and about 80% said their bills had risen over three years in the same home.
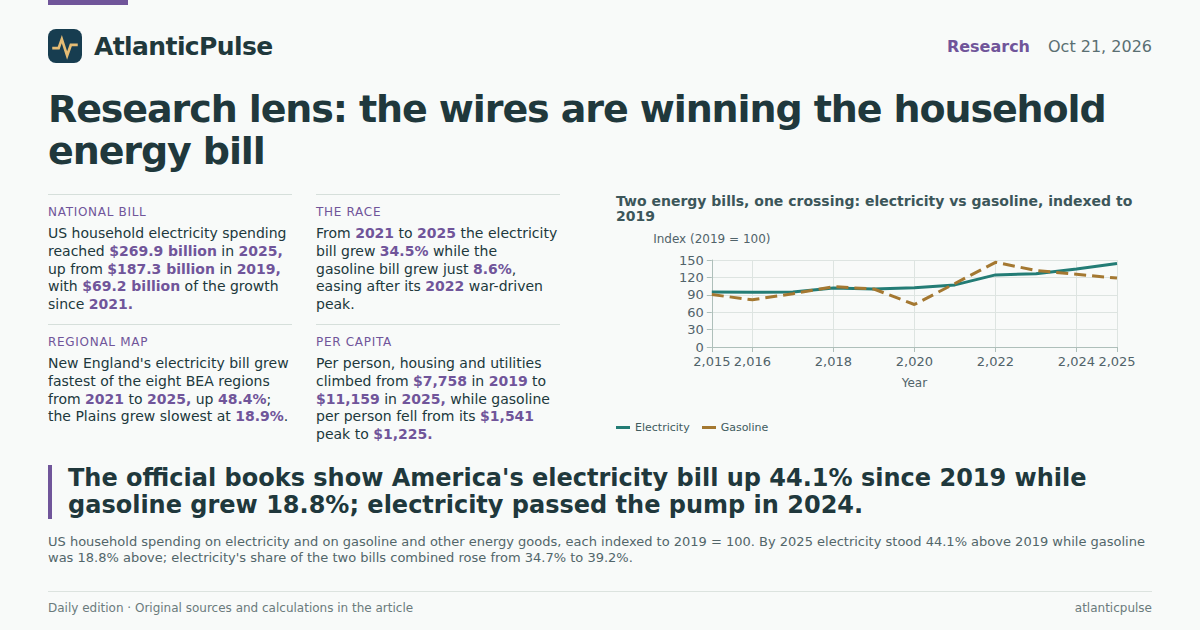
Those are self-reported feelings. But the government keeps books on this too, and they tell the same story in dollars. The Bureau of Economic Analysis' personal consumption expenditure accounts, the same ledgers that track everything Americans buy, published by state and region, show a household electricity bill that has quietly become one of the fastest-growing lines in the family budget. In 2019, US households spent $187.3 billion on electricity. In 2025 they spent $269.9 billion. That is a 44.1% increase in six years, and $69.2 billion of it arrived in just the last four.
The gasoline bill, by contrast, is the one politicians usually apologize for. It is much bigger in absolute terms, at $418.8 billion in 2025, but it grew only 18.8% over the same 2019-to-2025 span, and just 8.6% from 2021 to 2025, as pump prices eased from their war-driven 2022 spike. The wires are winning.
The crossover
Index both bills to 2019 and the shape of the decade comes into focus. Gasoline spending lurched to 146% of its 2019 level in 2022, when the Iran war and its supply fears drove fuel prices to records, then slid back to 118.8 by 2025. Electricity never spiked and never retreated: it climbed from 100 to 107.1 to 124.3 to 126.4 to 134.7, and then to 144.1 in 2025, passing the gasoline line in 2024 and leaving it behind. Between 2021 and 2025, the electricity bill grew 34.5% while the gasoline bill grew 8.6%.
The two lines are not the same kind of beast, and the accounts are careful about that. Gasoline spending moves with the pump price and with how much Americans drive. Electricity spending moves with utility rates, weather, housing stock and, increasingly, with whatever is plugged in. The electricity line includes only what households pay; the data centers drawing gigawatts in Virginia and Texas buy their own power, so the bill's acceleration reflects costs landing on residences, not the AI industry's own invoices. What the lines share is a political destination: both end up in the same household budget, where the Consumer Reports respondents said dinner had become the shock absorber.
Measured per person, housing and household utilities, the category that contains electricity along with rent and water, rose from $7,758 in 2019 to $11,159 in 2025. Gasoline per person went the other way after 2022: from a peak of $1,541 down to $1,225. The pump, briefly the villain of the inflation era, is now the smaller and better-behaved of the two energy bills.
Two energy bills, one crossing: electricity vs gasoline, indexed to 2019

View exact chart values
| year | electricity_index_2019_100 | gasoline_index_2019_100 | electricity_bill_bn | gasoline_bill_bn |
|---|---|---|---|---|
| 2015 | 94.8 | 90.4 | 177.6 | 318.8 |
| 2016 | 94.5 | 81.4 | 177 | 287 |
| 2017 | 94.8 | 91.9 | 177.7 | 324 |
| 2018 | 101.8 | 104 | 190.7 | 366.7 |
| 2019 | 100 | 100 | 187.3 | 352.5 |
| 2020 | 102.3 | 73.3 | 191.6 | 258.5 |
| 2021 | 107.1 | 109.4 | 200.7 | 385.7 |
| 2022 | 124.3 | 146 | 232.9 | 514.6 |
| 2023 | 126.4 | 131.9 | 236.7 | 464.9 |
| 2024 | 134.7 | 125.3 | 252.3 | 441.6 |
| 2025 | 144.1 | 118.8 | 269.9 | 418.8 |
Per person, the utility bill keeps climbing while the gas bill retreats

View exact chart values
| year | housing_utilities_per_capita | gasoline_per_capita |
|---|---|---|
| 2015 | 6824 | 991 |
| 2016 | 6996 | 885 |
| 2017 | 7196 | 992 |
| 2018 | 7486 | 1116 |
| 2019 | 7758 | 1067 |
| 2020 | 8106 | 779 |
| 2021 | 8560 | 1162 |
| 2022 | 9325 | 1541 |
| 2023 | 10017 | 1381 |
| 2024 | 10585 | 1299 |
| 2025 | 11159 | 1225 |
Where it hurts most
Grow the map out to BEA's eight regions and the pattern is not uniform. New England's household electricity bill grew 48.4% from 2021 to 2025, the fastest in the country, reaching $13.9 billion, no small matter in the region whose heating-oil prices forced Washington to tap the Northeast reserve for only the second time in 26 years this month, with Maine's average at $5.97 a gallon. The Far West, home to California's expensive grid, was next at 42.7%, followed by the Southwest (39.3%), the Mideast (35.0%), the Southeast (32.7%) and the Rocky Mountain region (31.6%). The Great Lakes grew 27.0%. The Plains, with cheap and wind-heavy power, grew slowest at 18.9%.
In absolute terms the Southeast is the giant: its 2025 electricity bill reached $76.2 billion, up from $55.4 billion in 2019, as the region's population and its data-center pipeline both grew. The Southwest, anchored by Texas, went from $25.2 billion to $37.3 billion. Every region's bill grew; the question dividing them is only by how much. That spread matters for the dividend debate, because the states fighting hardest over data-center siting, Virginia in the Southeast's ledger and Texas in the Southwest's, are also among those whose household bills have been compounding since the buildout began.
None of this is an argument that data centers caused any particular family's bill, and the accounts cannot make it: BEA's tables are aggregate, nominal and silent on why. What they do establish is scale and direction. The $82.6 billion a year that US households now spend on electricity, on top of 2019's level, is the pool of money that a dividend, or a rate case, or a state regulator would be arguing over.
Where the electricity bill grew fastest, 2021-2025

View exact chart values
| region | y2019 | y2021 | y2025 | growth_2019_2025_pct | growth_2021_2025_pct |
|---|---|---|---|---|---|
| New England | 8475.5 | 9367.4 | 13904.6 | 64.1 | 48.4 |
| Far West | 26447.5 | 31186.9 | 44491 | 68.2 | 42.7 |
| Southwest | 25182.6 | 26782.1 | 37298.1 | 48.1 | 39.3 |
| Mideast | 27848.2 | 29754.6 | 40160.9 | 44.2 | 35 |
| Southeast | 55418.1 | 57377.2 | 76152.1 | 37.4 | 32.7 |
| Rocky Mountain | 5425.6 | 6046.7 | 7959.7 | 46.7 | 31.6 |
| Great Lakes | 25728.2 | 27176.9 | 34520.6 | 34.2 | 27 |
| Plains | 12783.6 | 12999.6 | 15450.9 | 20.9 | 18.9 |
The electricity bill by region, 2019 vs 2025

View exact chart values
| region | y2019 | y2021 | y2025 | growth_2019_2025_pct | growth_2021_2025_pct |
|---|---|---|---|---|---|
| New England | 8475.5 | 9367.4 | 13904.6 | 64.1 | 48.4 |
| Far West | 26447.5 | 31186.9 | 44491 | 68.2 | 42.7 |
| Southwest | 25182.6 | 26782.1 | 37298.1 | 48.1 | 39.3 |
| Mideast | 27848.2 | 29754.6 | 40160.9 | 44.2 | 35 |
| Southeast | 55418.1 | 57377.2 | 76152.1 | 37.4 | 32.7 |
| Rocky Mountain | 5425.6 | 6046.7 | 7959.7 | 46.7 | 31.6 |
| Great Lakes | 25728.2 | 27176.9 | 34520.6 | 34.2 | 27 |
| Plains | 12783.6 | 12999.6 | 15450.9 | 20.9 | 18.9 |
The dividend debate, priced
The administration's proposal is deliberately vague, a nudge that developers share benefits with neighbors, and it arrives alongside parallel ideas from the industry itself: Anthropic has floated putting 5% of its equity into a public-benefit fund, and Elon Musk has proposed a SpaceX share for every American child. Against a household electricity bill that crossed a quarter of a trillion dollars in 2025, those are gestures of different magnitudes. The BEA record at least prices the grievance: the bill is 44.1% larger than in 2019, and electricity's share of the two household energy bills combined, electricity plus gasoline, has climbed from 34.7% to 39.2%.
Two caveats belong next to those numbers. First, they are nominal: part of the growth is inflation, part is more homes and people, and only part is the rate shock that surveys capture, which is why the per-person series, which nets out population growth, still shows housing and utilities up more than 40% since 2019. Second, the ledgers run through 2025. The demand-side forecasts cited in the Consumer Reports reporting, with US electricity demand projected to grow 16% by 2029, mostly on data centers, have not yet been tested by another year of bills.
What the record does settle is the direction of the argument. Americans are not imagining the bill: the official accounts show it growing faster than the gasoline bill they historically blamed, fastest in New England, and largest in the Southeast and the West. Whether the remedy is a dividend, a rate case or simply more power plants, the fight is over a cost that was $82.6 billion a year bigger in 2025 than it was in 2019, before the next round of data centers plugs in.
The household electricity bill, 2015-2025

View exact chart values
| year | electricity_bill_bn |
|---|---|
| 2015 | 177.6 |
| 2016 | 177 |
| 2017 | 177.7 |
| 2018 | 190.7 |
| 2019 | 187.3 |
| 2020 | 191.6 |
| 2021 | 200.7 |
| 2022 | 232.9 |
| 2023 | 236.7 |
| 2024 | 252.3 |
| 2025 | 269.9 |
Sources and methods
Data are annual, nominal personal consumption expenditures from BEA's PCE by state product (SAPCE3/SAPCE2 tables, release vintage 2026-09-30), extracted through calendar 2025. Electricity is the type-of-product line 'Housing and utilities - Electricity and gas - Electricity'; gasoline is 'Nondurable goods - Gasoline and other energy goods'.
No inflation adjustment is applied; growth reflects prices, usage, housing stock and population together. The per-capita series (SAPCE2) is BEA's own published per-person measure of the combined housing-and-utilities category, which also contains rent, water and sanitation; it is not an electricity-only per-person figure.
Regional growth uses BEA's eight official regions. Aggregated regional dollars are not household averages, and no per-household or per-bill claims are made.
The data are aggregate and cannot attribute bill growth to data centers, weather or rates; the Consumer Reports survey findings and administration proposals cited are context, not measured effects in these accounts.
Extracts were pulled from the pinned 2026-10-09 catalogue snapshot; observations are annual periods with no forecasts included.
Research completed 2026-10-22, for the October 21, 2026 news edition. The available source data may cover earlier periods; see the observation periods and source vintages above.
- BEA Personal Consumption Expenditures by State (SAPCE), release 2026-09-30: Source 1, Source 2
- BEA SAPCE3 line 58, Electricity, United States (annual, current dollars): Source 1
- BEA SAPCE3 line 36, Gasoline and other energy goods, United States (annual, current dollars): Source 1
- BEA SAPCE2 line 15, Housing and utilities per capita, United States: Source 1
- BEA SAPCE2 line 11, Gasoline and other energy goods per capita, United States: Source 1
- BEA SAPCE3 line 58, Electricity, New England region (annual, current dollars): Source 1
- BEA SAPCE3 line 58, Electricity, Mideast region (annual, current dollars): Source 1
- BEA SAPCE3 line 58, Electricity, Great Lakes region (annual, current dollars): Source 1
- BEA SAPCE3 line 58, Electricity, Plains region (annual, current dollars): Source 1
- BEA SAPCE3 line 58, Electricity, Southeast region (annual, current dollars): Source 1
- BEA SAPCE3 line 58, Electricity, Southwest region (annual, current dollars): Source 1
- BEA SAPCE3 line 58, Electricity, Rocky Mountain region (annual, current dollars): Source 1
- BEA SAPCE3 line 58, Electricity, Far West region (annual, current dollars): Source 1