Research
The water bill grew. It did not outrun the grocery cart.
A 62% water-bill scare, and a quieter official ledger
A new analysis of the 500 largest community water systems landed in today’s news with a number built to travel: household water bills up 62% from 2015 to 2025, faster than groceries, faster than overall inflation, and 19% faster than household incomes. West Virginia households, the report said, paid $1,383 last year; Idaho households paid $286. Those are selected-utility bills, not a census of every American tap. They also run one year past the last complete year on the government’s consumption books.
Those books still answer the question the scare raises. The Bureau of Economic Analysis’s state personal consumption accounts, last fully compiled for 2024, record what Americans spent on water supply and sanitation — the tap, the sewer, the bill that arrives whether or not you noticed it. In 2024 that line was $139.6 billion, or about $411 per person. In 2015 it was $91.5 billion, or $284 per person. The national total rose 53% over those nine years; the per-person figure rose 44%. That is a real increase. It is not 62%, and it is not faster than the grocery cart on the same ledger.
The mismatch is not a gotcha so much as a reminder of what each number is. The advocacy tally is a sample of large community systems’ household bills through 2025. BEA’s figure is current-dollar consumption for the whole country through 2024, including sanitation, and it is an aggregate — not an average household water bill, and not a statement about any one utility’s rate case. If you want to know whether water has become a stealth inflation story next to food and fuel, the official ledger is the place to look. It does not show a breakaway.
U.S. household water-and-sanitation spending, 1997–2024

View exact chart values
| year | water_billions | elec_billions | food_billions | gas_billions | water_per_capita | elec_per_capita | food_per_capita | gas_per_capita | water_share_pct |
|---|---|---|---|---|---|---|---|---|---|
| 1997 | 44.06 | 90.7 | 412.76 | 134.43 | 162 | 333 | 1514 | 493 | 0.8 |
| 1998 | 46.21 | 93.41 | 422.09 | 120.79 | 168 | 339 | 1530 | 438 | 0.79 |
| 1999 | 48.74 | 93.58 | 444.95 | 134.19 | 175 | 335 | 1595 | 481 | 0.78 |
| 2000 | 50.44 | 98.36 | 463.12 | 168.61 | 179 | 349 | 1641 | 598 | 0.75 |
| 2001 | 52.38 | 103.37 | 482.23 | 162.49 | 184 | 363 | 1692 | 570 | 0.74 |
| 2002 | 54.61 | 107.11 | 490.4 | 153.61 | 190 | 372 | 1705 | 534 | 0.74 |
| 2003 | 56.61 | 111.48 | 513.58 | 178.98 | 195 | 384 | 1770 | 617 | 0.73 |
| 2004 | 58.73 | 115.75 | 543 | 213.38 | 201 | 395 | 1854 | 729 | 0.71 |
| 2005 | 61.27 | 128.52 | 575.28 | 261.43 | 207 | 435 | 1947 | 885 | 0.7 |
| 2006 | 65.49 | 140.65 | 601.56 | 295.93 | 219 | 471 | 2016 | 992 | 0.71 |
| 2007 | 68 | 148.29 | 634.71 | 319.92 | 226 | 492 | 2107 | 1062 | 0.7 |
| 2008 | 72.37 | 155.49 | 665.82 | 360.95 | 238 | 511 | 2189 | 1187 | 0.72 |
| 2009 | 75.03 | 157.03 | 669.15 | 263.79 | 245 | 512 | 2181 | 860 | 0.76 |
| 2010 | 78.48 | 166.76 | 678.59 | 312.14 | 254 | 539 | 2193 | 1009 | 0.76 |
| 2011 | 81.4 | 166.69 | 709.05 | 386.79 | 261 | 535 | 2274 | 1240 | 0.76 |
| 2012 | 84.7 | 163.25 | 731.64 | 397.81 | 269 | 519 | 2328 | 1266 | 0.77 |
| 2013 | 87.56 | 169.1 | 752.68 | 395.67 | 276 | 534 | 2376 | 1249 | 0.77 |
| 2014 | 90.56 | 176.14 | 785.33 | 383.1 | 284 | 552 | 2460 | 1200 | 0.76 |
| 2015 | 91.46 | 177.58 | 808.94 | 297.4 | 284 | 552 | 2514 | 924 | 0.74 |
| 2016 | 95.07 | 177.02 | 828.94 | 268.63 | 293 | 546 | 2556 | 828 | 0.75 |
| 2017 | 101.01 | 177.66 | 862.56 | 302.5 | 309 | 544 | 2641 | 926 | 0.76 |
| 2018 | 105.79 | 190.69 | 889.11 | 341.7 | 322 | 580 | 2706 | 1040 | 0.76 |
| 2019 | 109.81 | 187.31 | 920.34 | 328.72 | 333 | 567 | 2787 | 995 | 0.76 |
| 2020 | 113.67 | 191.63 | 1011.85 | 238.41 | 343 | 578 | 3052 | 719 | 0.8 |
| 2021 | 118.17 | 200.72 | 1087.29 | 361.11 | 356 | 604 | 3274 | 1087 | 0.73 |
| 2022 | 123.43 | 232.89 | 1178.8 | 481.7 | 370 | 697 | 3529 | 1442 | 0.7 |
| 2023 | 131.48 | 236.75 | 1215.72 | 436.92 | 390 | 703 | 3610 | 1297 | 0.7 |
| 2024 | 139.62 | 253.43 | 1250.07 | 414.26 | 411 | 745 | 3675 | 1218 | 0.7 |
Water rose with groceries. Overall spending rose faster.
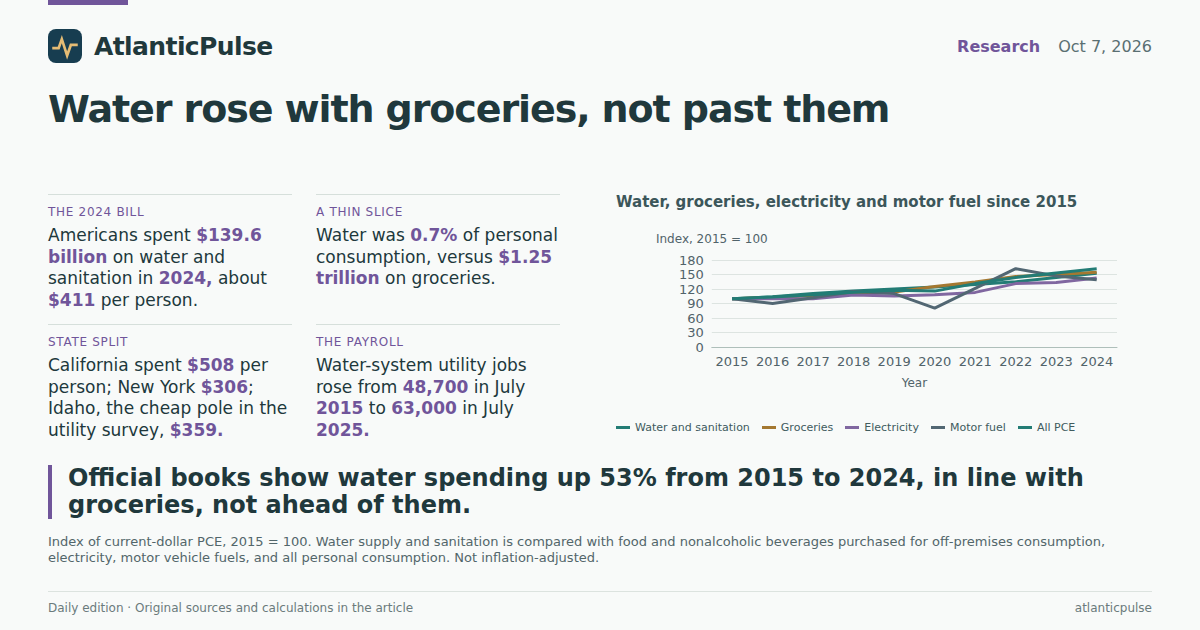
Index every category to 2015 and the picture is almost boring, which is useful. Water-and-sanitation spending in 2024 stood at 153 on that scale. Food and nonalcoholic beverages bought for home use — the grocery cart — stood at 155. Electricity was 143. Motor vehicle fuels, lubricants and fluids were 139. All personal consumption was 162. In other words, the water line grew at about the same pace as groceries and more slowly than the household budget as a whole. Motor fuel, the bill everyone argues about at the pump, actually lagged water over that stretch, mostly because 2015 was a cheap-oil year and 2020 a pandemic trough.
None of this is inflation-adjusted. Current dollars mix price and quantity: more people, more bathrooms, leakier pipes, higher rates, drier summers. BEA does not publish a standalone water price index in this file. What it does show is that water remains a small slice of the pie. In 2024 it was 0.7% of personal consumption, almost the same share as in 2015. Groceries were about $1.25 trillion, motor fuel $414 billion, electricity $253 billion. Water, at $140 billion, is the smallest of those four household utilities-and-staples bills — and the one least likely to show up in a campaign ad.
Per person, the 2024 split was about $3,675 on groceries, $1,218 on motor fuel, $745 on electricity and $411 on water and sanitation. A family of four, if you naively multiply — which you should not, because these are population averages, not household means — would still be looking at a four-figure grocery bill and a mid-hundreds water bill. The political heat is on diesel and mortgages this week. The quieter meter in the basement has been climbing too. It has not been climbing in a class of its own.
Water, groceries, electricity and motor fuel since 2015

View exact chart values
| year | water | electricity | groceries | motor_fuel | all_pce |
|---|---|---|---|---|---|
| 2015 | 100 | 100 | 100 | 100 | 100 |
| 2016 | 103.9 | 99.7 | 102.5 | 90.3 | 103.5 |
| 2017 | 110.4 | 100 | 106.6 | 101.7 | 108.1 |
| 2018 | 115.7 | 107.4 | 109.9 | 114.9 | 113.3 |
| 2019 | 120.1 | 105.5 | 113.8 | 110.5 | 117.4 |
| 2020 | 124.3 | 107.9 | 125.1 | 80.2 | 115.7 |
| 2021 | 129.2 | 113 | 134.4 | 121.4 | 131.1 |
| 2022 | 135 | 131.1 | 145.7 | 162 | 143.9 |
| 2023 | 143.8 | 133.3 | 150.3 | 146.9 | 153.1 |
| 2024 | 152.7 | 142.7 | 154.5 | 139.3 | 161.8 |
Four household bills, 2024

View exact chart values
| category | billions | per_capita |
|---|---|---|
| Groceries | 1250.1 | 3675 |
| Electricity | 253.4 | 745 |
| Motor fuel | 414.3 | 1218 |
| Water and sanitation | 139.6 | 411 |
California, not West Virginia, is the high per-person state in this cut
The advocacy report’s West Virginia–Idaho contrast is real as a tale of large-system household bills. It is not the ranking the consumption accounts produce. Using BEA’s own total and per-capita spending to back out an implied resident population, 2024 water-and-sanitation spending was about $508 per person in California, $452 in Texas, $437 in West Virginia, $411 in the United States, $410 in Florida, $359 in Idaho and $306 in New York. California is the expensive tap in this set. New York, despite its reputation for everything costing more, is the cheap one — which is a reminder that “water bill” and “cost of living” are not the same map.
Growth rates scramble the ranking again. From 2015 to 2024, Idaho’s aggregate water spending rose 71% and Florida’s 67%, faster than Texas (61%) and California (54%). West Virginia’s total rose only 32%, and New York’s 37%. Per person, California still led this group at 52% growth; West Virginia was 38%. Idaho’s per-person increase, 42%, is close to the national 44%. The state that looks cheapest on a household-bill survey can look merely average once you count every resident and every sanitation dollar. Dictionary presence is not a 50-state census here: these are the states named in today’s reporting plus a few large comparators, not a ranked universe of 50.
Two cautions belong next to those bars. First, BEA’s water line is not a household average; a rancher, a renter and a Silicon Valley campus do not split the state total evenly. Second, the advocacy numbers and the official numbers can both be right about different objects. A West Virginia city system can post a four-figure annual household bill while statewide consumption per resident sits near the U.S. average, if many residents are on wells, small systems, or different rate structures. The official books do not refute that someone in Charleston is paying a painful tab. They do refute the idea that the whole country has been uniquely mugged by the water department.
Per-person water-and-sanitation spending, 2024

View exact chart values
| state | water_millions_2024 | per_capita_2024 | per_capita_growth_2015_2024_pct | aggregate_growth_2015_2024_pct |
|---|---|---|---|---|
| California | 20011.7 | 508 | 52 | 53.8 |
| Texas | 14156.8 | 452 | 41.3 | 61.4 |
| West Virginia | 773.1 | 437 | 37.5 | 31.9 |
| United States | 139618.9 | 411 | 44.4 | 52.7 |
| Florida | 9585.9 | 410 | 44.3 | 67.4 |
| Idaho | 718.5 | 359 | 41.8 | 70.6 |
| New York | 6073.5 | 306 | 38.3 | 36.8 |
The workforce grew. The bill grew faster.
If water were merely a rate grab, you might expect a static workforce billing more for the same pipes. The payroll files show something less cinematic. Seasonally adjusted employment in water, sewage and other systems — a utilities industry in the Current Employment Statistics — was 48,700 in July 2015 and 63,000 in July 2025, the last July in this snapshot, a 29% increase. The construction crews that actually bury pipe, counted separately as water and sewer line and related structures construction, went from 171,100 to 224,200 over the same Julys, up 31%. Both recovered from the post-2008 hole; construction still has not recaptured its 2007 peak on this July cut.
Those are small industries. Sixty-three thousand utility jobs is a rounding error on a 160-million payroll. Average hourly earnings in the utility slice were $29.23 in July 2015; this extract does not extend a 2026 July reading, and the series in the snapshot stops with 2025. What the job counts do show is that the country added water-system workers and pipe-laying jobs while the consumption bill rose faster than either headcount. That is consistent with a capital-and-rate story — aging plants, federal drinking-water rules, drought, and the $2.4 trillion infrastructure need the American Water Works Association has waved at Congress — more than with a sudden hiring boom.
It is also consistent with a political mismatch. This week’s digest is full of diesel holidays, 7.49% mortgages and $70,000 student-work fees. Water does not have a federal tax to suspend. It has local boards, old pipes, and a bill that has been compounding in the background. The official record through 2024 says that compounding tracked groceries, not some unique water crisis. The 2025 utility-bill sample says the next year may have been uglier. Both can sit on the same kitchen table. Only one of them is in the national accounts yet.
Water-system jobs versus the crews that lay the pipes

View exact chart values
| year | utility_jobs_thousands | construction_jobs_thousands |
|---|---|---|
| 2000 | 46.1 | 176.6 |
| 2001 | 48.5 | 181.3 |
| 2002 | 48.8 | 182.8 |
| 2003 | 46.1 | 182.9 |
| 2004 | 45.9 | 188.7 |
| 2005 | 45.1 | 201.1 |
| 2006 | 45.8 | 210.8 |
| 2007 | 49.6 | 212.7 |
| 2008 | 47.6 | 191.4 |
| 2009 | 46.7 | 161.4 |
| 2010 | 47.3 | 158.2 |
| 2011 | 45.7 | 150.5 |
| 2012 | 48 | 151.7 |
| 2013 | 47.2 | 153.3 |
| 2014 | 47.7 | 160 |
| 2015 | 48.7 | 171.1 |
| 2016 | 49.7 | 183.5 |
| 2017 | 50.7 | 184.4 |
| 2018 | 52.4 | 187.7 |
| 2019 | 53.3 | 189.6 |
| 2020 | 51.7 | 188.2 |
| 2021 | 53.9 | 188.7 |
| 2022 | 58.1 | 198.8 |
| 2023 | 60.7 | 207.3 |
| 2024 | 62.8 | 215.9 |
| 2025 | 63 | 224.2 |
Sources and methods
BEA state PCE extracts are annual current-dollar consumption for calendar 1997–2024 from the SAPCE 2025-09-26 release, snapshot dated 2026-08-31. They are not 2025 observations and are not household average bills. Water supply and sanitation is function line SAPCE4:25. Groceries are food and nonalcoholic beverages purchased for off-premises consumption. Motor fuel is motor vehicle fuels, lubricants and fluids. Electricity is the electricity line under household utilities.
Per-person water spending is water PCE divided by implied resident population, where population is total PCE in dollars divided by published per-capita PCE. That is a BEA-consistent per-resident figure, not a household average and not a utility bill. Aggregate dollars are not household averages.
State comparisons are limited to states with extracted observations (California, Texas, West Virginia, Florida, Idaho, New York, plus the U.S.). Dictionary presence of other states is not treated as coverage. Rankings are not a 50-state census.
CES employment is national, seasonally adjusted, monthly. July observations are used for year-to-year comparisons. The water, sewage and other systems series and the water and sewer line construction series are different industries; they are not added together. This snapshot’s July readings run through 2025, not 2026. Earnings were extracted but 2026 July is missing; 2015 July hourly earnings are reported only as context.
Growth rates are simple percent changes in current dollars. Missing values are not treated as zero. No causal claim is made that rates, drought, or privatization caused the increase. The Food & Water Watch 62% figure is a different universe (500 large community systems’ household bills through 2025) and is not overwritten by BEA totals.
Provider lag is normal. PCE vintage is 2024; CES snapshot is 2026-08-24. Routine production, not a historical reconstruction.
Research completed 2026-10-08, for the October 7, 2026 news edition. The available source data may cover earlier periods; see the observation periods and source vintages above.