Research
The storm is aiming at states that barely book the oil
The path is not where the oil is booked
Hurricane Isaias, the Atlantic’s first hurricane of a late season, was strengthening toward Category 2 on October 8 as it aimed at the Florida Panhandle, Alabama and Mississippi. Producers had already shut in about 63 percent of Gulf of Mexico oil output — nearly 1.3 million barrels a day — and evacuated 121 of 371 manned platforms, according to the day’s reporting. That is a volume shock in federal waters. It is not the same thing as a shock to the states in the forecast cone.
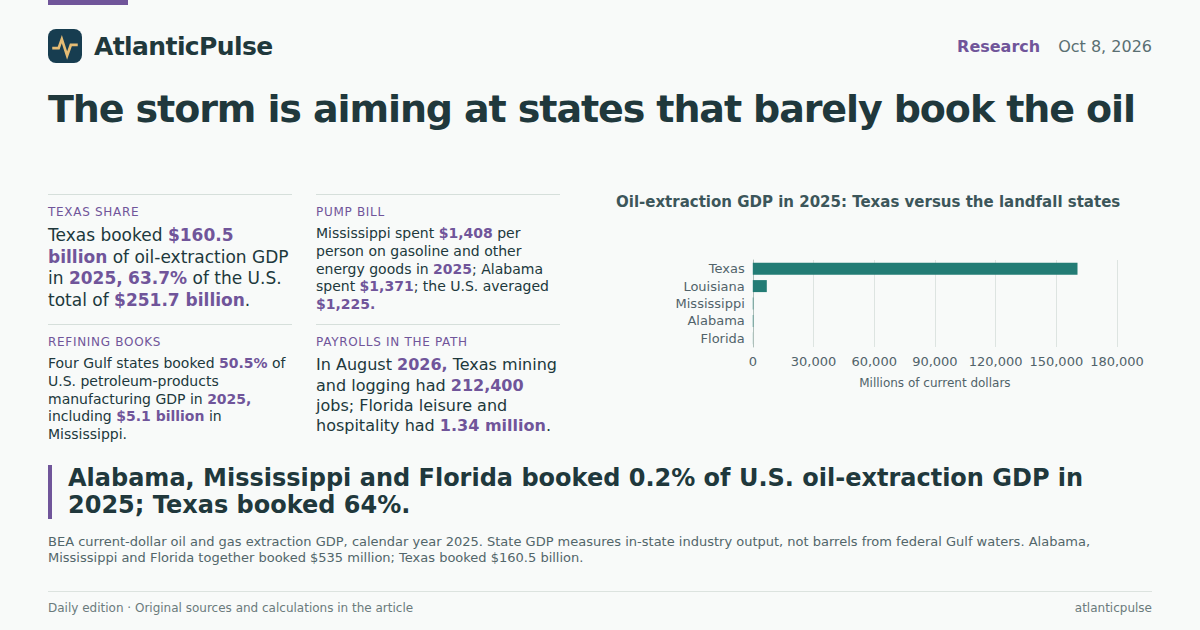
BEA’s 2025 state GDP accounts, published in the September 30, 2026 annual release, put U.S. oil and gas extraction at $251.7 billion in current dollars, or 0.8 percent of a $30.9 trillion U.S. economy. Texas booked $160.5 billion of that, 63.7 percent of the national total. Louisiana booked $6.9 billion, 2.8 percent. Alabama, Mississippi and Florida together booked $535 million — two-tenths of one percent of U.S. oil-extraction GDP. State GDP measures in-state industry output. It is not a barrel count from federal Outer Continental Shelf leases, and it is not a 2026 storm-damage estimate. It is the official picture of which states’ books actually hold the extraction industry a Gulf hurricane is interrupting.
The mismatch is the point. A shut-in in the Gulf can move national pump prices even when the coastline taking the wind barely shows up in the extraction accounts. Texas and Louisiana together still held two-thirds of U.S. oil-extraction GDP in 2025. The landfall states held a rounding error.
Oil-extraction GDP in 2025: Texas versus the landfall states

View exact chart values
| state | oil_gdp_2025_millions | petro_gdp_2025_millions |
|---|---|---|
| Texas | 160466.1 | 53170.9 |
| Louisiana | 6927.3 | 15097.5 |
| Mississippi | 236.3 | 5118 |
| Alabama | 229.2 | 1375.4 |
| Florida | 69.1 | 0 |
The gasoline bill is already larger in Alabama and Mississippi
The same September 30 BEA release covers household spending on gasoline and other energy goods through calendar 2025 — the last full year before the Iran war and before Isaias. Americans spent $418.8 billion on that category, or $1,225 per person, 2.0 percent of $61,062 in total consumption per person. That is a spending total, not a gallon price: it moves with both volumes and prices.
Mississippi spent $1,408 per person, 15 percent above the U.S. average and 3.1 percent of a thinner $45,855 consumption budget. Alabama spent $1,371, 12 percent above the average and 2.8 percent of $48,725. Louisiana was $1,340 and Texas $1,265. Florida, the other state in the cone, spent $1,045 — 15 percent below the U.S. average, and only 1.6 percent of a much larger $66,061 consumption budget. The households most exposed to a storm-driven jump in fuel costs are not the ones living in the giant extraction state. They are the ones whose budgets are already more gasoline-heavy.
All six series peaked in 2022, when U.S. spending hit $1,541 per person and Mississippi hit $1,721, then eased through 2025. That decline is last year’s story. It does not include 2026 war-risk crude or a Category 2 landfall. It does show that even after two years of cooling, Alabama and Mississippi still outspent the country at the pump.
Gasoline spending per person, 2019–2025

View exact chart values
| year | us | texas | louisiana | alabama | mississippi | florida |
|---|---|---|---|---|---|---|
| 2019 | 1067 | 1161 | 1194 | 1095 | 1151 | 852 |
| 2020 | 779 | 851 | 845 | 805 | 881 | 611 |
| 2021 | 1162 | 1248 | 1262 | 1242 | 1307 | 928 |
| 2022 | 1541 | 1681 | 1647 | 1661 | 1721 | 1288 |
| 2023 | 1381 | 1480 | 1505 | 1503 | 1551 | 1151 |
| 2024 | 1299 | 1368 | 1434 | 1452 | 1442 | 1085 |
| 2025 | 1225 | 1265 | 1340 | 1371 | 1408 | 1045 |
2025 gasoline bill per person in the Gulf path

View exact chart values
| state | dollars | vs_us_index |
|---|---|---|
| Mississippi | 1408 | 114.9 |
| Alabama | 1371 | 111.9 |
| Louisiana | 1340 | 109.4 |
| Texas | 1265 | 103.3 |
| United States | 1225 | 100 |
| Florida | 1045 | 85.3 |
Refining is the Gulf industry the cone actually contains
Extraction GDP and refining GDP are not substitutes. Petroleum and coal products manufacturing — the BEA category whose dominant process is petroleum refining — was $148.0 billion nationally in 2025. Texas booked $53.2 billion of that (36 percent). Louisiana booked $15.1 billion (10 percent), more than twice its oil-extraction GDP. Mississippi booked $5.1 billion, about 3.5 percent of the U.S. refining-category total and more than twenty times its $236 million of oil extraction. Alabama booked $1.4 billion of refining-category output against $229 million of extraction. Those four states together held 50.5 percent of U.S. petroleum-and-coal-products manufacturing GDP.
Put a map on those books and the storm’s industrial risk looks different from the 63 percent shut-in headline. Texas still dwarfs everyone on extraction. Louisiana’s mix is a refining-and-services state: support activities for mining added another $4.0 billion there in 2025. Mississippi’s oil-extraction line is tiny; its refining-category line is not. Alabama sits in between. Florida’s extraction GDP was $69 million. This extract did not pull a Florida petroleum-manufacturing series, so the state is left off that comparison rather than treated as zero.
The scatter of extraction GDP against gasoline spending makes the same split without a speech. Texas is far to the right: a $160 billion extraction industry and a slightly above-average pump bill. Mississippi and Alabama huddle near the origin on extraction and high on the vertical axis. They do not produce the crude. They still buy the gallons.
Extraction versus refining on the 2025 books

View exact chart values
| state | oil_extraction | petroleum_products |
|---|---|---|
| Texas | 160466.1 | 53170.9 |
| Louisiana | 6927.3 | 15097.5 |
| Mississippi | 236.3 | 5118 |
| Alabama | 229.2 | 1375.4 |
Where the oil is booked, versus who pays at the pump

View exact chart values
| state | oil_gdp_billions | gas_per_capita |
|---|---|---|
| Texas | 160.47 | 1265 |
| Louisiana | 6.93 | 1340 |
| Mississippi | 0.24 | 1408 |
| Alabama | 0.23 | 1371 |
| Florida | 0.07 | 1045 |
The payrolls in the path are hospitality, not derricks
The last state payroll snapshot in this catalogue is August 2026, from BLS’s August 24, 2026 files, copied before the October 8 edition. Those jobs predate Isaias. They describe the workforces sitting in the path, not the storm’s damage. Texas mining and logging employed 212,400 people that month, seasonally adjusted. Louisiana’s mining-and-logging supersector employed 27,400. Alabama had 9,500 and Mississippi 5,800. Those two smaller counts mix oil and gas with coal, quarrying and logging. They are not an offshore-rig census.
Leisure and hospitality is the large payroll on the same coast. Florida employed 1.34 million people in that supersector in August 2026. Alabama employed 224,000. A Gulf hurricane aimed at beaches and barrier islands is, on the official books, a tourism-and-gasoline event in the landfall states and an extraction event in Texas’s accounts. Treating the 63 percent Gulf shut-in as if it were Alabama’s industry is a category error. Treating Alabama’s gasoline bill as someone else’s problem is the other one.
None of these series measures barrels shut in on October 8, platform evacuations, or what pump prices did after the storm. The 2025 GDP and spending figures are annual and closed before the war’s first full year. The August 2026 payrolls stop a month and a half before landfall. What they can say is narrower, and more useful: the states taking the wind already spend more per person on gasoline than America as a whole, and they book almost none of the oil-extraction GDP that a Gulf shut-in is supposed to represent.
Sources and methods
All figures are from saved extracts of BEA annual state GDP (SAGDP2, release bea-regional-state-annual-2026-09-30) and BEA state PCE (SAPCE, release bea-sapce-2026-09-30), plus BLS State and Area Employment (snapshot bls-sm-snapshot-2026-08-24). Catalogue copies were hash-verified AtlanticPulse snapshots; retrieval timestamps on October 9 do not make these October 9 observations.
Calendar year 2025 is the latest annual GDP and PCE year. It closes before the February 2026 start of the Iran war and before Hurricane Isaias. Do not read 2025 spending as a current pump price or as storm-week demand.
State oil and gas extraction GDP is in-state industry output in current dollars. It is not Gulf of Mexico barrel production, not federal OCS attribution, and not comparable to the 63 percent shut-in share in October 8 reporting.
Petroleum and coal products manufacturing is a NAICS 324 category whose dominant process is petroleum refining; it also includes some further processing of refined petroleum and coal products. Florida petroleum manufacturing was not extracted and is not treated as zero.
Gasoline and other energy goods include motor fuels, lubricants, fluids, and fuel oils. Per-person figures are BEA totals divided by resident population, not household averages. Shares of PCE use each area’s own total consumption.
BLS mining-and-logging employment is a supersector that includes oil and gas, other mining, and logging, seasonally adjusted, in thousands. Latest month in the snapshot is August 2026, before landfall. Leisure and hospitality is statewide, not panhandle-only.
No series in this package measures shut-in barrels, tanker rates, or the storm’s effect. Comparisons are descriptive.
Research completed 2026-10-09, for the October 8, 2026 news edition. The available source data may cover earlier periods; see the observation periods and source vintages above.