Research
The SNAP dollar peak is already behind us. The grocery bill is not.
The program that grew faster than the grocery aisle
On paper, the biggest federally funded grocery-aid program in the United States is shrinking in a hurry. Associated Press reporting this week put SNAP enrollment at 36.6 million in May 2026, down more than 13 percent from a year earlier and already as low as the Congressional Budget Office had expected around 2030. Arizona’s drop exceeded 50 percent. Advocates blamed paperwork; Heritage hoped people were earning too much to qualify. Either way, the political argument is about people leaving the rolls.
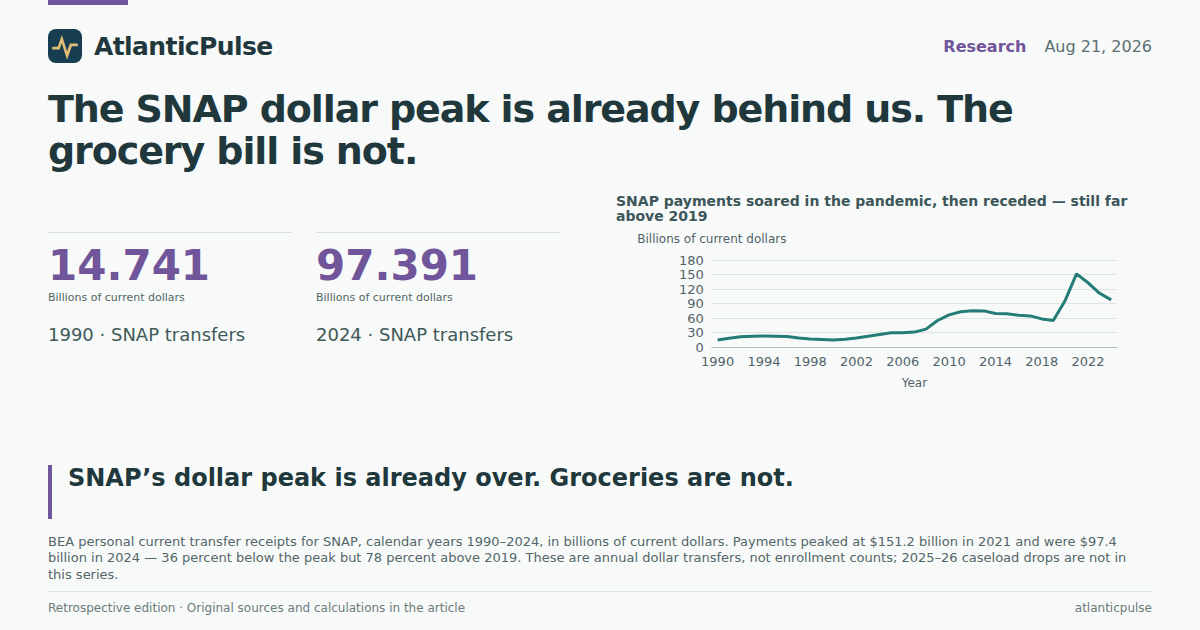
The official dollar accounts tell a related, earlier story. They cannot yet see 2026. They can show what the program looked like before this year’s caseload collapse, and they are unkind to anyone who thinks SNAP only just became large. In the Bureau of Economic Analysis state personal-income tables, SNAP transfer receipts — the value of benefits USDA pays, allocated to states — peaked at $151.2 billion in calendar 2021. By 2024 they had fallen to $97.4 billion. That is 36 percent below the peak. It is still 78 percent above 2019’s $54.7 billion. Per resident, not per recipient, the national figure went from $166 in 2019 to $455 in 2021 and $286 in 2024.
Those dollars are current, not inflation-adjusted, and they are not the same as a headcount. Emergency pandemic allotments, a temporary boost in benefits, and then their withdrawal all sit inside the 2020–24 swing. The 2026 work-requirement and documentation fight is a later chapter. The useful fact for readers watching that fight is simpler: the federal grocery card was already being written down, in the accounts, for three years before this week’s enrollment print.
SNAP payments soared in the pandemic, then receded — still far above 2019

View exact chart values
| year | snap_billions | snap_per_capita_dollars | snap_share_of_grocery_pct | snap_share_of_income_maint_pct |
|---|---|---|---|---|
| 1990 | 14.741 | 59.1 | — | 22.53 |
| 1991 | 18.264 | 72.2 | — | 24.43 |
| 1992 | 21.295 | 83 | — | 24.52 |
| 1993 | 22.211 | 85.5 | — | 24.01 |
| 1994 | 22.842 | 86.8 | — | 23.26 |
| 1995 | 22.447 | 84.3 | — | 21.39 |
| 1996 | 21.953 | 81.5 | — | 20.38 |
| 1997 | 18.732 | 68.7 | 4.54 | 17.65 |
| 1998 | 16.465 | 59.7 | 3.9 | 15.37 |
| 1999 | 15.473 | 55.5 | 3.48 | 14.15 |
| 2000 | 14.565 | 51.6 | 3.14 | 13.17 |
| 2001 | 15.967 | 56 | 3.31 | 14.02 |
| 2002 | 18.612 | 64.7 | 3.8 | 14.89 |
| 2003 | 22.125 | 76.3 | 4.31 | 16.07 |
| 2004 | 25.946 | 88.6 | 4.78 | 17.4 |
| 2005 | 29.492 | 99.8 | 5.13 | 17.78 |
| 2006 | 29.39 | 98.5 | 4.89 | 17.24 |
| 2007 | 30.921 | 102.6 | 4.87 | 17.12 |
| 2008 | 37.034 | 121.8 | 5.56 | 18.89 |
| 2009 | 54.762 | 178.5 | 8.18 | 23.72 |
| 2010 | 66.515 | 215 | 9.8 | 25.98 |
| 2011 | 72.728 | 233.2 | 10.26 | 27.53 |
| 2012 | 74.851 | 238.1 | 10.23 | 27.97 |
| 2013 | 74.657 | 235.7 | 9.92 | 27.53 |
| 2014 | 69.409 | 217.4 | 8.84 | 25.61 |
| 2015 | 68.737 | 213.6 | 8.5 | 25.12 |
| 2016 | 65.502 | 201.9 | 7.9 | 24.2 |
| 2017 | 64.255 | 196.7 | 7.45 | 23.82 |
| 2018 | 58.19 | 177.1 | 6.54 | 22.14 |
| 2019 | 54.712 | 165.7 | 5.94 | 20.12 |
| 2020 | 94.946 | 286.3 | 9.38 | 30.16 |
| 2021 | 151.169 | 455.2 | 13.9 | 31.98 |
| 2022 | 132.923 | 398 | 11.28 | 24.94 |
| 2023 | 111.15 | 330.1 | 9.14 | 31.98 |
| 2024 | 97.391 | 286.4 | 7.79 | 28.39 |
A smaller SNAP, a larger grocery bill
Transfers are one thing. What households actually spend on food is another. BEA’s state consumer-spending accounts put food and nonalcoholic beverages purchased for off-premises consumption — the grocery and similar aisle, not restaurants — at $1.25 trillion in 2024. SNAP that year was equal to 7.8 percent of that spending. In 2021 the same ratio was 13.9 percent. In 2019 it was 5.9 percent.
Index both series to 2019 and the split is even plainer. SNAP transfers nearly tripled by 2021, then eased to 178 in 2024. Grocery spending never came back down. It kept climbing, to 136 in 2024. A thinner SNAP is arriving in a kitchen where the receipt is still getting longer. That is not a claim that work rules caused grocery inflation, or that every lost SNAP dollar shows up as a skipped meal. It is a description of two official series moving in opposite directions after 2021.
SNAP is also not the whole low-income transfer stack. In 2024, BEA’s broader “income maintenance” bundle — SNAP, the Earned Income Tax Credit, Supplemental Security Income, family assistance and other programs — totaled $343 billion. SNAP was the largest named slice at 28 percent. EITC was 20 percent, SSI 19 percent. The leftover third is a mix, including child-tax-credit pieces that ballooned during the pandemic and then shrank; it should not be read as a single policy. The pie is a reminder that cutting SNAP does not cut the only check that lands in a low-income household. It does cut the one that is supposed to be spent on food.
SNAP dollars fell after 2021. Grocery spending did not.

View exact chart values
| year | snap_index_2019 | grocery_index_2019 |
|---|---|---|
| 2019 | 100 | 100 |
| 2020 | 173.5 | 109.9 |
| 2021 | 276.3 | 118.1 |
| 2022 | 243 | 128.1 |
| 2023 | 203.2 | 132.1 |
| 2024 | 178 | 135.8 |
SNAP is the largest named slice of income-maintenance transfers — but not the majority

View exact chart values
| category | billions | share_pct |
|---|---|---|
| SNAP | 97.39 | 28.4 |
| Earned Income Tax Credit | 69.44 | 20.2 |
| Supplemental Security Income | 65.13 | 19 |
| Other income maintenance | 111.05 | 32.4 |
Which states would notice first
National averages hide the map. Divide 2024 SNAP dollars by resident population and, among ten states that include those named in this week’s enrollment reporting plus the largest peers, New Mexico received $516 per resident and Louisiana $451. New York was $429. California, despite the biggest dollar total at $13.1 billion, was $333 per resident. Texas, at $234, sat at the bottom of this group. The U.S. average was $286.
That is not a ranking of need, and it is not a ranking of enrollment. A state can look high because benefits are more generous, because more residents qualify, or because both. Mississippi, often assumed to top every poverty chart, was $270 per resident in this cut — below New York — after a 43 percent drop in SNAP dollars from 2021 to 2024. Texas’s dollars were halved from the 2021 peak. Arizona, the state whose 2026 caseload collapse is the national exhibit, was already down 42 percent in the 2024 dollar accounts from 2021. The 2026 paperwork crunch is stacking on a decline that had started.
Relative to 2019, every one of these states was still higher in 2024. California’s SNAP dollars were more than double 2019. New York was about double. Mississippi’s increase was the smallest, at 34 percent. The pandemic bulge has deflated unevenly. The states that would feel a further 2026 cut most, in dollar terms per resident, are not a mystery: they are the ones where SNAP still accounts for several hundred dollars a year for every person who lives there, recipient or not.
Where SNAP still sits heaviest, per resident

View exact chart values
| state | snap_2024_millions | per_capita_2024 | pct_change_2021_2024 | pct_change_2019_2024 |
|---|---|---|---|---|
| New Mexico | 1096.4 | 516 | -39.6 | 73.4 |
| Louisiana | 2082.6 | 451 | -35.3 | 73.3 |
| New York | 8583.1 | 429 | -12.2 | 99.9 |
| California | 13096.4 | 333 | -28.8 | 120.2 |
| Nevada | 1017.9 | 313 | -37.9 | 75.3 |
| Georgia | 3160.2 | 282 | -37.8 | 54.4 |
| Mississippi | 796.8 | 270 | -42.5 | 33.9 |
| Florida | 6229 | 268 | -34.5 | 57.8 |
| Arizona | 1906.7 | 252 | -42.2 | 67.8 |
| Texas | 7320.7 | 234 | -49.3 | 56.3 |
Regions, not slogans
BEA’s eight regions make the same point without picking on a handful of states. The Southeast received the most SNAP dollars in 2024, $24.8 billion, because it is huge. Per resident it was middle of the pack at $277. The Mideast — New York, Pennsylvania, New Jersey, Delaware, Maryland and the District of Columbia — and the Far West both came in around $330 per resident. New England was $304. The Plains were $190. The Rocky Mountain region was $159.
If the political story is that SNAP is a coastal luxury, the accounts disagree. If the story is that it is only a Deep South program, they disagree too. The dollars follow a mix of poverty, benefit design and population. A national caseload drop will not land as a national average in grocery aisles.
None of this tells you how many of this year’s missing enrollees failed a work test, missed a form, earned more, or left the country. The BEA tables stop in 2024. USDA’s monthly enrollment is a different publication. What the accounts do say, with unusual clarity for a Washington food fight, is that the expensive version of SNAP is already in the rear-view mirror, grocery spending is not, and the remaining dollars are still large enough — $97 billion, $286 a resident, 8 percent of the grocery aisle — that a faster-than-forecast drop in 2026 is not a rounding error. It is a smaller program meeting a larger bill.
The Mideast and Far West, not the Plains, paid the most SNAP per resident

View exact chart values
| region | snap_2024_billions | per_capita_2024 |
|---|---|---|
| Mideast | 16.84 | 333 |
| Far West | 18.95 | 332 |
| New England | 4.68 | 304 |
| Great Lakes | 13.88 | 292 |
| Southeast | 24.76 | 277 |
| Southwest | 12 | 266 |
| Plains | 4.17 | 190 |
| Rocky Mountain | 2.11 | 159 |
Sources and methods
This is retrospective enrichment using pinned catalogue snapshots, not a reconstruction of what was knowable on the 2026-08-21 edition date. Research was run on 2026-09-11.
SNAP and related transfer series are annual BEA SAINC personal current transfer receipts, in thousands of current dollars, from the bea-regional-state-annual snapshot created 2026-08-31 (source release bea-regional-state-annual-2026-04-09; underlying SAINC35 file runs through calendar 2024). Population is BEA SAINC1 resident population, persons, 2024 for state and region ratios and 1990–2025 nationally.
Grocery spending is BEA SAPCE food and nonalcoholic beverages purchased for off-premises consumption, millions of current dollars, snapshot created 2026-08-31, source release bea-sapce-2025-09-26, calendar 1997–2024.
Per-capita figures divide SNAP dollars by resident population. That is dollars per resident, not per SNAP recipient, and is not a household average. Missing values were not treated as zero. Nominal dollars were not inflation-adjusted. State results are a selected set of ten states, not a 50-state census. Region totals were taken from BEA region geographies, not summed from the ten states.
The 2024 accounts do not include 2025–26 monthly SNAP enrollment. They cannot identify why caseloads fell, and they should not be read as a causal test of work requirements, paperwork rules, or immigration enforcement. Pandemic emergency allotments and other temporary boosts are inside the 2020–24 dollar swing.
Research completed 2026-09-11, for the August 21, 2026 news edition. This is retrospective analysis, not a reconstruction of information available that day.