Research
The science exodus is real. The private-college payroll is not.
The packing boxes are real. The statewide job count is a different story.
Halley Froehlich was sure she would spend her career in the United States. Her family has been here since the 1700s. Then delayed federal grants, cancelled projects and a research landscape that no longer felt stable sent her to Helsinki with five years of guaranteed funding. A NOAA scientist who had been asked to strip climate language from websites left for Birmingham. Immigrant biologists at UC Davis took posts in Australia. Omar Yaghi, a 2025 chemistry Nobel laureate, left Berkeley for Tsinghua. The Associated Press account of that exodus is specific, named and grim. Trackers put frozen or cut federal grants at up to $174 billion this term. Major research institutions accepted 15 percent fewer fall 2026 doctoral applicants than a year earlier.
The question that follows is not whether those people left. They did. It is whether the official employment books already show a statewide contraction in the places that produce American science — or whether the talent drain is still too small, too recent, or too concentrated in the federal government to move the payroll. The Bureau of Labor Statistics State and Area Employment series, in a snapshot that runs through August 2026, can answer only the payroll version of that question. It cannot count who declined an offer, who stopped applying, or which lab lost a principal investigator. What it can do is tell readers whether the industries that actually employ scientists on U.S. soil have already turned down.
Private college payrolls did not collapse after 2025

View exact chart values
| month | california | massachusetts | new_york | unit |
|---|---|---|---|---|
| 2019-01 | 375.1 | 170.7 | 514.2 | thousands of employees, SA |
| 2019-02 | 380.5 | 171.4 | 514.3 | thousands of employees, SA |
| 2019-03 | 381.5 | 172.3 | 515.6 | thousands of employees, SA |
| 2019-04 | 382.8 | 182 | 503.6 | thousands of employees, SA |
| 2019-05 | 382.5 | 179.9 | 503.9 | thousands of employees, SA |
| 2019-06 | 384.2 | 177.9 | 503.8 | thousands of employees, SA |
| 2019-07 | 384 | 178.2 | 503 | thousands of employees, SA |
| 2019-08 | 381.4 | 178.5 | 502.6 | thousands of employees, SA |
| 2019-09 | 385.4 | 180.1 | 505.1 | thousands of employees, SA |
| 2019-10 | 386.8 | 180.9 | 504.5 | thousands of employees, SA |
| 2019-11 | 387.7 | 181.5 | 505.8 | thousands of employees, SA |
| 2019-12 | 388.5 | 181.3 | 504.9 | thousands of employees, SA |
| 2020-01 | 388.1 | 181.3 | 506.9 | thousands of employees, SA |
| 2020-02 | 392.3 | 186.4 | 507.9 | thousands of employees, SA |
| 2020-03 | 387.9 | 182 | 502.6 | thousands of employees, SA |
| 2020-04 | 326.1 | 161.5 | 444.7 | thousands of employees, SA |
| 2020-05 | 328.6 | 161.9 | 443.9 | thousands of employees, SA |
| 2020-06 | 340.2 | 165.3 | 454.3 | thousands of employees, SA |
| 2020-07 | 335.6 | 162.6 | 447.3 | thousands of employees, SA |
| 2020-08 | 337.2 | 166.4 | 459.2 | thousands of employees, SA |
| 2020-09 | 335.9 | 167.7 | 462.8 | thousands of employees, SA |
| 2020-10 | 334.5 | 167.1 | 464.9 | thousands of employees, SA |
| 2020-11 | 333.6 | 167.6 | 465.1 | thousands of employees, SA |
| 2020-12 | 334.4 | 167.1 | 465.8 | thousands of employees, SA |
| 2021-01 | 336.5 | 171.8 | 467.3 | thousands of employees, SA |
| 2021-02 | 335.5 | 170.2 | 467 | thousands of employees, SA |
| 2021-03 | 338.5 | 172.4 | 471.2 | thousands of employees, SA |
| 2021-04 | 345.8 | 172.5 | 472.7 | thousands of employees, SA |
| 2021-05 | 354.1 | 173 | 474.2 | thousands of employees, SA |
| 2021-06 | 356.4 | 174.7 | 474.9 | thousands of employees, SA |
| 2021-07 | 360.9 | 176.8 | 483.3 | thousands of employees, SA |
| 2021-08 | 363.4 | 176.3 | 480.4 | thousands of employees, SA |
| 2021-09 | 361.7 | 174.4 | 480.8 | thousands of employees, SA |
| 2021-10 | 366.1 | 176.9 | 492.6 | thousands of employees, SA |
| 2021-11 | 368.4 | 178.2 | 495.1 | thousands of employees, SA |
| 2021-12 | 369 | 177.9 | 497.7 | thousands of employees, SA |
| 2022-01 | 371.6 | 182.2 | 492.5 | thousands of employees, SA |
| 2022-02 | 371.8 | 181.3 | 500.5 | thousands of employees, SA |
| 2022-03 | 373.6 | 180.8 | 500.5 | thousands of employees, SA |
| 2022-04 | 374.9 | 180 | 485.3 | thousands of employees, SA |
| 2022-05 | 375.2 | 179 | 484.2 | thousands of employees, SA |
| 2022-06 | 377 | 181.6 | 488.7 | thousands of employees, SA |
| 2022-07 | 378.3 | 182.3 | 496.1 | thousands of employees, SA |
| 2022-08 | 380.2 | 183 | 491.8 | thousands of employees, SA |
| 2022-09 | 383.2 | 183.9 | 487.9 | thousands of employees, SA |
| 2022-10 | 385.1 | 182.8 | 490.2 | thousands of employees, SA |
| 2022-11 | 388 | 183.6 | 491 | thousands of employees, SA |
| 2022-12 | 389.9 | 183.6 | 492.2 | thousands of employees, SA |
| 2023-01 | 389.7 | 185.6 | 493.8 | thousands of employees, SA |
| 2023-02 | 391.1 | 185.4 | 494.6 | thousands of employees, SA |
| 2023-03 | 393.2 | 185.7 | 493.9 | thousands of employees, SA |
| 2023-04 | 391.4 | 185.5 | 493.6 | thousands of employees, SA |
| 2023-05 | 397.8 | 187.6 | 492 | thousands of employees, SA |
| 2023-06 | 400.7 | 187.4 | 492.1 | thousands of employees, SA |
| 2023-07 | 401.9 | 188.1 | 503.9 | thousands of employees, SA |
| 2023-08 | 403.3 | 188 | 497.4 | thousands of employees, SA |
| 2023-09 | 406.4 | 191.6 | 495.1 | thousands of employees, SA |
| 2023-10 | 402.7 | 190.7 | 496.3 | thousands of employees, SA |
| 2023-11 | 405.5 | 190.2 | 497.2 | thousands of employees, SA |
| 2023-12 | 409.4 | 191.2 | 497.7 | thousands of employees, SA |
| 2024-01 | 412.8 | 191.9 | 498.9 | thousands of employees, SA |
| 2024-02 | 413.1 | 192.7 | 500.2 | thousands of employees, SA |
| 2024-03 | 413.9 | 193.1 | 501.5 | thousands of employees, SA |
| 2024-04 | 415.1 | 193.6 | 511.1 | thousands of employees, SA |
| 2024-05 | 414.7 | 193.6 | 514.2 | thousands of employees, SA |
| 2024-06 | 414.8 | 194.3 | 528.6 | thousands of employees, SA |
| 2024-07 | 415.5 | 194.5 | 506.5 | thousands of employees, SA |
| 2024-08 | 417.7 | 194.7 | 502.8 | thousands of employees, SA |
| 2024-09 | 417.4 | 194.2 | 521.6 | thousands of employees, SA |
| 2024-10 | 419.2 | 194.4 | 506.9 | thousands of employees, SA |
| 2024-11 | 420.5 | 195 | 507.3 | thousands of employees, SA |
| 2024-12 | 419.4 | 195.3 | 508.4 | thousands of employees, SA |
| 2025-01 | 422.4 | 194.7 | 507.8 | thousands of employees, SA |
| 2025-02 | 422.9 | 194.3 | 507.5 | thousands of employees, SA |
| 2025-03 | 422.9 | 194.3 | 507.9 | thousands of employees, SA |
| 2025-04 | 424.6 | 195.2 | 511 | thousands of employees, SA |
| 2025-05 | 424.2 | 193.9 | 513.8 | thousands of employees, SA |
| 2025-06 | 421.8 | 193.9 | 521.2 | thousands of employees, SA |
| 2025-07 | 417.5 | 194.2 | 511.7 | thousands of employees, SA |
| 2025-08 | 424.5 | 194.2 | 509.9 | thousands of employees, SA |
| 2025-09 | 428.8 | 194.2 | 518.1 | thousands of employees, SA |
| 2025-10 | 435.4 | 196.4 | 520.9 | thousands of employees, SA |
| 2025-11 | 434.6 | 195.9 | 520.4 | thousands of employees, SA |
| 2025-12 | 431.6 | 196.7 | 522.4 | thousands of employees, SA |
| 2026-01 | 439.5 | 198.3 | 520.5 | thousands of employees, SA |
| 2026-02 | 433.1 | 195.6 | 522.5 | thousands of employees, SA |
| 2026-03 | 433.2 | 196.5 | 519.3 | thousands of employees, SA |
| 2026-04 | 436 | 196.4 | 519.6 | thousands of employees, SA |
| 2026-05 | 436 | 194.8 | 517.5 | thousands of employees, SA |
| 2026-06 | 438.5 | 199.1 | 514.6 | thousands of employees, SA |
| 2026-07 | 437.5 | 200 | 503.7 | thousands of employees, SA |
| 2026-08 | 444.2 | 199 | 505.4 | thousands of employees, SA |
Private campuses in California hired through the grant fight
Start with private educational services — private colleges, universities and other private schools, seasonally adjusted. Public universities, including the University of California campuses in the AP reporting, sit in state government, not here. That distinction matters, and it is not a loophole: it is how the books are kept.
From January 2025, when the current term’s science-funding fight was already underway, through August 2026, California’s private educational-services payroll rose from 422,400 to 444,200, a gain of 21,800 jobs, or 5.2 percent. Massachusetts rose from 194,700 to 199,000, or 2.2 percent. Pennsylvania was up 4.0 percent. Washington was up 0.8 percent. The states that slipped were smaller moves: New York down 0.5 percent, Maryland down 0.8 percent, Illinois down 0.3 percent. California’s private-campus count in August 2026 was still 18.4 percent above January 2019. The 2020 collapse is visible on the chart. A 2025–26 collapse is not.
That is not a clean bill of health for American science. Private educational services include many people who never touch a federal grant. It also excludes the public flagships that dominate basic research. But if the story were already a broad private-university contraction, the California and Massachusetts lines would be falling. They are not.
Since January 2025, private-school jobs rose in California and Massachusetts

View exact chart values
| state | pct_change | jobs_chg_thousands |
|---|---|---|
| Maryland | -0.8 | -0.7 |
| New York | -0.5 | -2.4 |
| Illinois | -0.3 | -0.4 |
| Washington | 0.8 | 0.6 |
| Massachusetts | 2.2 | 4.3 |
| Pennsylvania | 4 | 9.7 |
| California | 5.2 | 21.8 |
The broader scientific-services payroll is softer — especially around NIH country
Professional, scientific and technical services is the next-widest net. It includes scientific research and development, but also lawyers, management consultants and computer-systems design. Treat it as a ceiling, not a lab census. Even so, the direction since January 2025 is less cheerful than the private-college lines.
Massachusetts fell from 359,300 jobs in January 2025 to 351,500 in August 2026, down 2.2 percent. Maryland, home to NIH and a dense contractor belt, fell from 280,400 to 271,900, down 3.0 percent. California was essentially flat, up 0.4 percent, and still below its January 2024 level of 1.433 million. None of those moves prove that grant cancellations caused the softening. They do show that the industry most often used as a proxy for ‘knowledge work’ was not booming in the two smaller research states while federal science policy was being rewritten.
The broader professional-scientific payroll cooled in Maryland and Massachusetts

View exact chart values
| month | california | massachusetts | maryland | unit |
|---|---|---|---|---|
| 2024-01 | 1433.3 | 362.8 | 285.5 | thousands of employees, SA |
| 2024-02 | 1424.3 | 362.3 | 285.6 | thousands of employees, SA |
| 2024-03 | 1419.3 | 362.2 | 284 | thousands of employees, SA |
| 2024-04 | 1405.3 | 361 | 283.5 | thousands of employees, SA |
| 2024-05 | 1403.4 | 362.3 | 283.3 | thousands of employees, SA |
| 2024-06 | 1400.3 | 361.5 | 283.1 | thousands of employees, SA |
| 2024-07 | 1406.1 | 360.8 | 284 | thousands of employees, SA |
| 2024-08 | 1396.6 | 360.5 | 283.3 | thousands of employees, SA |
| 2024-09 | 1395.2 | 360.3 | 284 | thousands of employees, SA |
| 2024-10 | 1403.1 | 360.2 | 284 | thousands of employees, SA |
| 2024-11 | 1395.3 | 359.9 | 283.4 | thousands of employees, SA |
| 2024-12 | 1381 | 359.7 | 283.9 | thousands of employees, SA |
| 2025-01 | 1389.2 | 359.3 | 280.4 | thousands of employees, SA |
| 2025-02 | 1388.2 | 358.3 | 278.8 | thousands of employees, SA |
| 2025-03 | 1385.5 | 358.7 | 278 | thousands of employees, SA |
| 2025-04 | 1390.1 | 358.2 | 276.6 | thousands of employees, SA |
| 2025-05 | 1389.1 | 357.6 | 275.6 | thousands of employees, SA |
| 2025-06 | 1387.7 | 356.2 | 274.7 | thousands of employees, SA |
| 2025-07 | 1390.4 | 356.1 | 274.1 | thousands of employees, SA |
| 2025-08 | 1392.2 | 354.7 | 273.4 | thousands of employees, SA |
| 2025-09 | 1390.4 | 355.2 | 272.5 | thousands of employees, SA |
| 2025-10 | 1393.4 | 354.5 | 270.5 | thousands of employees, SA |
| 2025-11 | 1394.6 | 354.3 | 270.4 | thousands of employees, SA |
| 2025-12 | 1393.6 | 353.2 | 269.5 | thousands of employees, SA |
| 2026-01 | 1402.5 | 352.6 | 270.8 | thousands of employees, SA |
| 2026-02 | 1404.1 | 352.6 | 270.3 | thousands of employees, SA |
| 2026-03 | 1403.6 | 352.1 | 268.8 | thousands of employees, SA |
| 2026-04 | 1401.9 | 352.4 | 268.7 | thousands of employees, SA |
| 2026-05 | 1401 | 352.7 | 267.3 | thousands of employees, SA |
| 2026-06 | 1402.9 | 352.5 | 269.1 | thousands of employees, SA |
| 2026-07 | 1396.5 | 352.3 | 272.1 | thousands of employees, SA |
| 2026-08 | 1395.1 | 351.5 | 271.9 | thousands of employees, SA |
The drop that is already on the page is federal
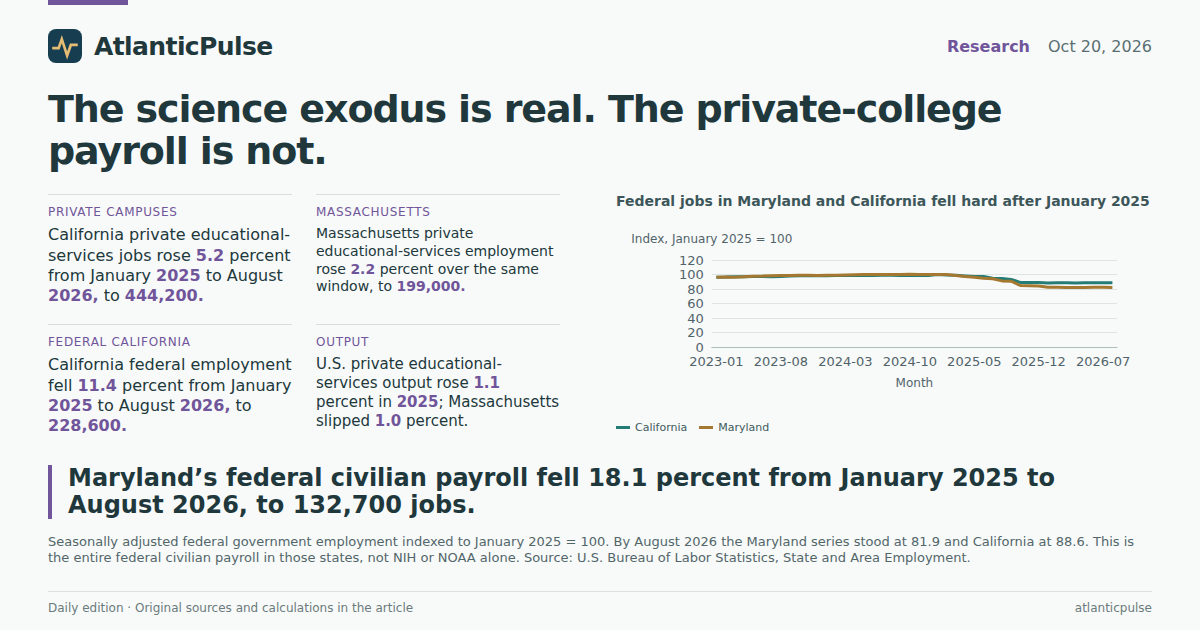
The NOAA scientist in the AP story was a federal employee. The federal civilian payroll, seasonally adjusted, is the series that actually broke. In Maryland it fell from 162,000 in January 2025 to 132,700 in August 2026, a drop of 29,300 jobs, or 18.1 percent. In California it fell from 258,000 to 228,600, down 29,400 jobs, or 11.4 percent. Indexed to January 2025, Maryland stood at 81.9 by August 2026 and California at 88.6. The steepest one-month step in both states was October 2025.
This is the entire federal civilian workforce in those states — postal workers, park rangers, defence civilians, NIH, NOAA and everyone else — not a science-only count. It is still the first official series that matches the reporting’s mechanism: a government that stopped funding, hiring and, in some labs, even naming climate change. California’s total nonfarm payroll, by comparison, was up 0.8 percent over the same January 2025–August 2026 window. The federal line is not the state line.
Public universities are the missing middle. California’s state-government educational-services jobs are published only on a not-seasonally-adjusted basis, so the honest comparison is August to August. August 2026 stood at 233,500, a little above August 2025 (229,400) and still below August 2024 (238,900). That is not a crash. It is also not the 2024 peak. UC Santa Barbara can lose named faculty without the statewide August print falling off a cliff, especially if other campuses are still hiring lecturers.
Federal jobs in Maryland and California fell hard after January 2025

View exact chart values
| month | california | maryland |
|---|---|---|
| 2023-01 | 96.1 | 96.3 |
| 2023-02 | 96.4 | 96.6 |
| 2023-03 | 96.8 | 96.2 |
| 2023-04 | 96.8 | 97 |
| 2023-05 | 97.3 | 97.6 |
| 2023-06 | 97.3 | 98 |
| 2023-07 | 97 | 98.3 |
| 2023-08 | 97.4 | 98.6 |
| 2023-09 | 97.9 | 98.8 |
| 2023-10 | 98.2 | 99 |
| 2023-11 | 98.4 | 99 |
| 2023-12 | 98.3 | 98.8 |
| 2024-01 | 98.4 | 98.9 |
| 2024-02 | 98.6 | 99 |
| 2024-03 | 98.6 | 99.3 |
| 2024-04 | 98.7 | 99.6 |
| 2024-05 | 98.7 | 99.8 |
| 2024-06 | 98.6 | 99.9 |
| 2024-07 | 98.9 | 100.2 |
| 2024-08 | 98.9 | 100.2 |
| 2024-09 | 98.7 | 100.1 |
| 2024-10 | 98.8 | 100.3 |
| 2024-11 | 98.5 | 100.2 |
| 2024-12 | 98.7 | 100.2 |
| 2025-01 | 100 | 100 |
| 2025-02 | 99.4 | 99.9 |
| 2025-03 | 99.1 | 98.5 |
| 2025-04 | 98.1 | 97.3 |
| 2025-05 | 97.1 | 96.1 |
| 2025-06 | 97.1 | 94.7 |
| 2025-07 | 94.9 | 94.1 |
| 2025-08 | 94.5 | 91.2 |
| 2025-09 | 93.3 | 90.7 |
| 2025-10 | 89.1 | 84.8 |
| 2025-11 | 89 | 84.6 |
| 2025-12 | 88.8 | 84.1 |
| 2026-01 | 88.3 | 82.4 |
| 2026-02 | 88.5 | 82.3 |
| 2026-03 | 88.5 | 82 |
| 2026-04 | 88.4 | 82.2 |
| 2026-05 | 88.5 | 82.2 |
| 2026-06 | 88.6 | 82.3 |
| 2026-07 | 88.5 | 82.3 |
| 2026-08 | 88.6 | 81.9 |
Output tells the same split: national growth, a Massachusetts stall
The Bureau of Economic Analysis annual GDP accounts, through 2025, put private educational-services output in the same awkward box: public campuses are in government. Real U.S. private educational-services GDP rose from $280.6 billion in 2024 to $283.7 billion in 2025, up 1.1 percent, and stood 10.3 percent above 2019. California was 12.0 percent above 2019 and edged up 0.6 percent in 2025. Massachusetts, denser with private research universities, slipped 1.0 percent in 2025 after several years of recovery. Indexed to 2019, Massachusetts finished 2025 at 106.4; the United States at 110.3; California at 112.0.
A one-percent down-year in Massachusetts is not a mass resignation. Combined with the softer professional-scientific payroll in Massachusetts and Maryland, it is a reminder that the research economy is not one number. Private campuses in California kept adding jobs. Federal offices did not. Anyone reading the packing-box stories as a statewide private-university collapse is reading a series the government does not publish.
Private educational output is above 2019, except Massachusetts stalled in 2025

View exact chart values
| year | united_states | california | massachusetts | unit |
|---|---|---|---|---|
| 2015 | 94.9 | 91.1 | 94.3 | index, 2019 = 100 |
| 2016 | 97.1 | 93.2 | 96.1 | index, 2019 = 100 |
| 2017 | 95.5 | 93 | 95.5 | index, 2019 = 100 |
| 2018 | 97.6 | 96.3 | 97.1 | index, 2019 = 100 |
| 2019 | 100 | 100 | 100 | index, 2019 = 100 |
| 2020 | 91.9 | 91.7 | 94.4 | index, 2019 = 100 |
| 2021 | 94.5 | 92.7 | 94.6 | index, 2019 = 100 |
| 2022 | 102 | 102.5 | 101.4 | index, 2019 = 100 |
| 2023 | 104.9 | 105.8 | 103.9 | index, 2019 = 100 |
| 2024 | 109.1 | 111.3 | 107.4 | index, 2019 = 100 |
| 2025 | 110.3 | 112 | 106.4 | index, 2019 = 100 |
Sources and methods
Payroll figures are U.S. Bureau of Labor Statistics State and Area Employment estimates from the pinned snapshot dated 2026-08-24, with observations through August 2026. They are not current-day counts. Seasonally adjusted series are used for private educational services (NAICS 61, private), professional, scientific and technical services (NAICS 54), federal government, and California total nonfarm. California state-government educational services is not seasonally adjusted; August-to-August comparisons are used so academic-year seasonality is not mistaken for a trend. Private educational services excludes public universities. Professional, scientific and technical services is much broader than academic research. Federal government is the entire federal civilian payroll in the state, not NIH or NOAA alone. Real GDP in private educational services is from BEA annual state GDP, millions of chained 2017 dollars, 2025 vintage in the 2026-09-30 regional release; public education is classified in government, not this industry. Missing observations are not treated as zero. Percent changes use the stored levels; no causal effect is inferred from grant-policy timing.
Research completed 2026-10-21, for the October 20, 2026 news edition. The available source data may cover earlier periods; see the observation periods and source vintages above.