Research
The refinery payroll already left. The $4 gallon did not.
A meeting about plants that no longer hire like plants
President Trump is gathering oil refiners at the White House to talk about gasoline that will not come down. The Associated Press put the national average at $4.08 a gallon — up 28 percent over the past year — and noted that the administration wants more refinery capacity, in part to process heavy crude from the new Venezuela venture. Brent had already settled at $90.49 after the first U.S. strikes on Iran in a month, the AP reported. The political theory is simple: more stills, cheaper regular. The industrial record is less cooperative.
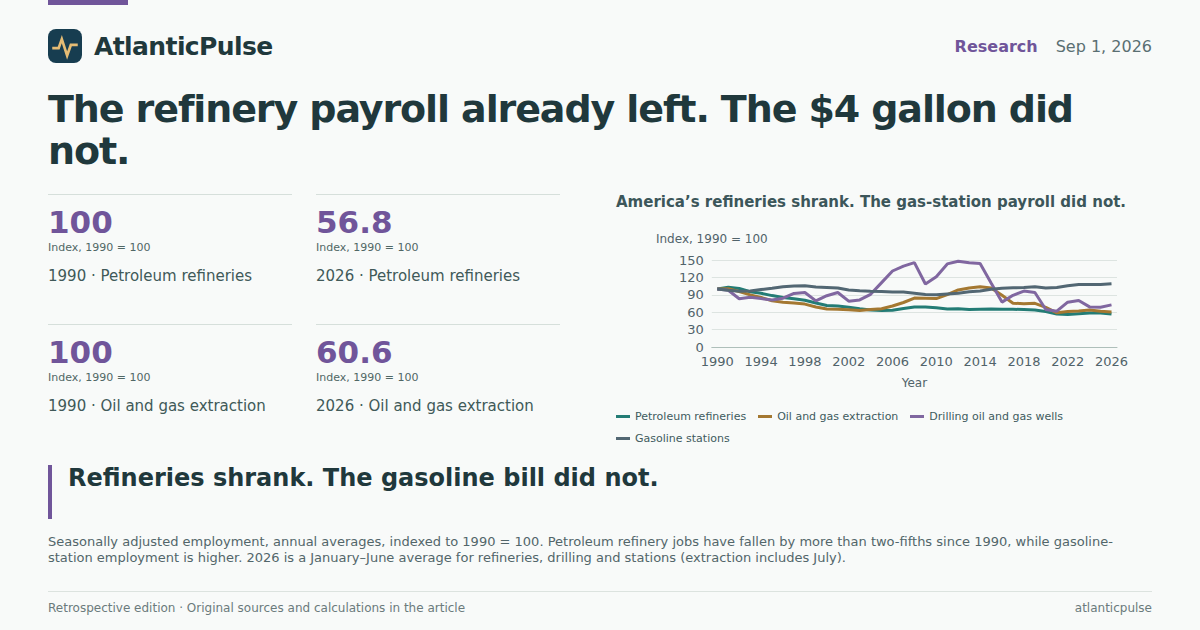
The United States still turns crude into gasoline, diesel, jet fuel and asphalt. It just does it with a workforce that has been quietly disappearing for a generation. Seasonally adjusted payrolls at petroleum refineries averaged about 108,100 in 1990 and peaked around 111,500 in 1991. By 2019 they were down to 68,900. In 2025 they averaged 63,200. In the first six months of 2026 they averaged 61,400, with June at 61,300. That is a 43 percent decline from 1990, measured on annual averages from the Bureau of Labor Statistics Current Employment Statistics. A country can want more refineries. It has been running the existing ones with fewer people.
America’s refineries shrank. The gas-station payroll did not.

View exact chart values
| year | refineries_index | extraction_index | drilling_index | stations_index |
|---|---|---|---|---|
| 1990 | 100 | 100 | 100 | 100 |
| 1991 | 103.1 | 100.4 | 97.9 | 97.7 |
| 1992 | 101.1 | 95.7 | 83.2 | 96.2 |
| 1993 | 95.2 | 89.8 | 85.8 | 96.8 |
| 1994 | 92.5 | 85.3 | 83.5 | 99.1 |
| 1995 | 88.7 | 79.8 | 81.2 | 101.3 |
| 1996 | 85.1 | 77.2 | 84.1 | 104 |
| 1997 | 83.2 | 75.7 | 92.4 | 105.1 |
| 1998 | 80.6 | 73.9 | 94 | 105.6 |
| 1999 | 75.8 | 68.9 | 79.4 | 103.6 |
| 2000 | 71.6 | 65.6 | 88.5 | 102.8 |
| 2001 | 70.8 | 65.1 | 94 | 101.7 |
| 2002 | 68.5 | 64.1 | 79 | 98.4 |
| 2003 | 65.9 | 63.1 | 81.2 | 96.9 |
| 2004 | 63.7 | 64.8 | 90.8 | 96.2 |
| 2005 | 62.9 | 66.1 | 111 | 95.7 |
| 2006 | 63.5 | 70.7 | 131.1 | 94.9 |
| 2007 | 66.5 | 76.8 | 139.5 | 94.6 |
| 2008 | 69.1 | 84.3 | 145.5 | 92.6 |
| 2009 | 69 | 84 | 108.6 | 90.6 |
| 2010 | 67.7 | 83.4 | 121.2 | 90 |
| 2011 | 65.5 | 90.4 | 143.2 | 91.3 |
| 2012 | 65.9 | 98.4 | 147.9 | 92.7 |
| 2013 | 64.9 | 101.6 | 145.1 | 95.2 |
| 2014 | 65.2 | 103.8 | 144 | 96.8 |
| 2015 | 65.5 | 101.7 | 110.4 | 99.4 |
| 2016 | 65 | 89.2 | 77.5 | 101.4 |
| 2017 | 65.2 | 75.6 | 89.2 | 102.1 |
| 2018 | 64.4 | 74.7 | 96.4 | 102.4 |
| 2019 | 63.7 | 75.4 | 94 | 104 |
| 2020 | 61.1 | 68.3 | 64.6 | 101.8 |
| 2021 | 56.9 | 58.9 | 61.8 | 102.7 |
| 2022 | 56 | 61.1 | 77.3 | 105.7 |
| 2023 | 57.4 | 62.1 | 80.1 | 107.7 |
| 2024 | 58.6 | 63.8 | 69.1 | 107.6 |
| 2025 | 58.5 | 61.7 | 68.6 | 107.8 |
| 2026 | 56.8 | 60.6 | 72.5 | 108.9 |
The pump has the jobs. The hydrocracker does not.
Put those plant jobs next to the rest of the oil patch and the retail pump, and the bottleneck stops looking like a hiring boom waiting to happen. As of mid-2026, gasoline stations employed about 994,200 people. Oil and gas extraction employed 114,600. Drilling oil and gas wells employed 45,800. Petroleum refineries employed 61,300. The people Americans meet when they fill the tank outnumber the people who make the fuel by roughly sixteen to one.
The comparison is not a morality play about cashiers versus operators. It is a map of where the payroll actually sits. Extraction jobs peaked in 2014, around 197,500, in the shale boom, then fell. Drilling is cyclical by design. Refining is the odd one out: a capital-intensive, heavily regulated, coastal and Gulf Coast industry whose headcount has been drifting down through fat years and lean ones. Gasoline stations, which sell snacks as much as they sell gallons, kept adding workers. Indexed to 1990, station employment is up about 9 percent; refinery employment is down about 43 percent.
The pump has the payroll. The plants do not.

View exact chart values
| industry | jobs_thousands | period |
|---|---|---|
| Gasoline stations | 994.2 | 2026-06 |
| Oil and gas extraction | 114.6 | 2026-07 |
| Petroleum refineries | 61.3 | 2026-06 |
| Drilling oil and gas wells | 45.8 | 2026-06 |
The output did not vanish with the badges
A smaller payroll is not the same thing as a smaller industry. Real GDP in petroleum and coal products manufacturing — the BEA category whose dominant process is petroleum refining — was about $140 billion in 2024, in chained 2017 dollars. That is higher than in 1997 ($98 billion) and a rebound from the 2020 collapse ($88 billion). It is still only about 0.6 percent of U.S. real GDP. In current dollars the same industry booked about $196 billion in 2024, according to the Bureau of Economic Analysis.
Read those two charts together and the White House talking point starts to split. The United States did not forget how to refine. It automated, consolidated, and ran remaining units harder. Real output can rise, or at least hold, while the badge count falls. That is good news if the question is productivity. It is awkward news if the question is whether a presidential meeting can staff a wave of new stills in time to move the 2026 midterms. Plants that take years to permit and billions to build are not a same-cycle answer to a $4 gallon. The official books cannot tell you whether any particular CEO will expand capacity. They can tell you the existing industry has been getting more gallons per worker, not more workers per gallon.
Refining still produces a lot of output with far fewer workers

View exact chart values
| year | real_gdp_petro_millions_chained2017 | nominal_gdp_petro_millions | real_gdp_total_millions_chained2017 | share_of_real_gdp_pct |
|---|---|---|---|---|
| 1997 | 97757 | 47512 | 12370299 | 0.79 |
| 1998 | 106582 | 50116 | 12924876 | 0.825 |
| 1999 | 102274 | 45237 | 13543774 | 0.755 |
| 2000 | 102757 | 52680 | 14096033 | 0.729 |
| 2001 | 123941 | 68314 | 14230726 | 0.871 |
| 2002 | 107732 | 50714 | 14472712 | 0.744 |
| 2003 | 143838 | 81247 | 14877312 | 0.967 |
| 2004 | 164350 | 104195 | 15449757 | 1.064 |
| 2005 | 164073 | 141036 | 15987957 | 1.026 |
| 2006 | 143221 | 139972 | 16433148 | 0.872 |
| 2007 | 146783 | 154715 | 16762445 | 0.876 |
| 2008 | 157890 | 154836 | 16781485 | 0.941 |
| 2009 | 148799 | 110631 | 16349110 | 0.91 |
| 2010 | 127184 | 123812 | 16789750 | 0.758 |
| 2011 | 106730 | 159060 | 17052410 | 0.626 |
| 2012 | 97978 | 159138 | 17442759 | 0.562 |
| 2013 | 106545 | 146614 | 17812167 | 0.598 |
| 2014 | 114776 | 147799 | 18261714 | 0.629 |
| 2015 | 112457 | 131408 | 18799622 | 0.598 |
| 2016 | 96508 | 76030 | 19141672 | 0.504 |
| 2017 | 110656 | 110656 | 19612102 | 0.564 |
| 2018 | 116050 | 154243 | 20193896 | 0.575 |
| 2019 | 132892 | 143355 | 20715671 | 0.642 |
| 2020 | 88363 | 61485 | 20284500 | 0.436 |
| 2021 | 115910 | 147795 | 21532407 | 0.538 |
| 2022 | 105317 | 231030 | 22075931 | 0.477 |
| 2023 | 116861 | 218022 | 22723719 | 0.514 |
| 2024 | 140006 | 195712 | 23358435 | 0.599 |
If you want more refining, you are mostly talking to Texas
The geography is as concentrated as the payroll is small. In 2024, Texas alone accounted for about $73 billion of that $196 billion in nominal petroleum-and-coal-products GDP — roughly 37 percent of the national total. California was next among the states compiled here, at $20 billion, then Louisiana at $17 billion. Pennsylvania, New Jersey and Oklahoma were in the low single billions. Gulf Coast and California plants are not a metaphor. They are the industry.
That matters for the Venezuela pitch as much as for the Iran shock. Heavy sour barrels from the Orinoco do not become $3 gasoline in a Midwestern topping unit that no longer exists. They need complex refineries that already cluster in Texas and Louisiana. The White House can meet “large and small” refiners. The value-added is not evenly distributed. A 100-year concession in Caracas does not, by itself, conjure a hydrocracker in a state that does not already have one. And because this is nominal GDP, the state ranking moves with oil prices: Texas’s 2022 figure was even larger. The 2024 snapshot is the latest annual book, not a claim that the 2026 war has already rewritten state accounts.
Texas is the refining economy the White House is talking to

View exact chart values
| state | year | nominal_gdp_millions |
|---|---|---|
| Texas | 2024 | 73075.6 |
| California | 2024 | 20108 |
| Louisiana | 2024 | 16616.7 |
| Pennsylvania | 2024 | 4164.5 |
| New Jersey | 2024 | 3473.3 |
| Oklahoma | 2024 | 2567 |
Households were already paying for this industry before Hormuz closed
The reason the meeting is happening is not a line in an industry table. It is the share of the household budget that disappears into a tank. In 2024, Americans spent $1,295 per person on gasoline and other energy goods, or 2.2 percent of personal consumption expenditures — about $441 billion in total, the BEA’s state PCE accounts show. That is not the all-time peak. The 2022 spike took per-person spending to $1,541, or 2.9 percent of PCE. In 2008 the category’s share hit 3.9 percent. The 2024 figures are the last full official year before the 2026 war pushed pump prices through a record-expensive August.
None of this proves that building refineries would, or would not, reverse those prices. Crude still sets the global floor; Hormuz still sets the fear premium; retail gasoline still includes taxes, blends and the last mile. What the books show is more modest and more useful. The industry Washington wants to enlarge has been shrinking as an employer for 35 years, producing plenty of real output with fewer people, clustering in a handful of states, and feeding a household bill that was already more than $1,200 a person before this war. If cheaper regular is the test, the constraint is not that America forgot how to hire at the pump. It is that the plants that actually make the gallons have been running a very different labor market from the one in the speech.
The household gasoline bill was already high before this war

View exact chart values
| year | per_capita_gasoline_energy_dollars | per_capita_pce_dollars | share_of_pce_pct | aggregate_gasoline_energy_millions |
|---|---|---|---|---|
| 1997 | 542 | 20308 | 2.67 | 147661.2 |
| 1998 | 480 | 21306 | 2.25 | 132354.7 |
| 1999 | 525 | 22519 | 2.33 | 146544.9 |
| 2000 | 654 | 23983 | 2.73 | 184515.6 |
| 2001 | 625 | 24823 | 2.52 | 177985.9 |
| 2002 | 584 | 25550 | 2.29 | 167899.8 |
| 2003 | 677 | 26682 | 2.54 | 196411.7 |
| 2004 | 795 | 28114 | 2.83 | 232732.5 |
| 2005 | 960 | 29674 | 3.24 | 283769.9 |
| 2006 | 1071 | 31092 | 3.44 | 319649.8 |
| 2007 | 1147 | 32356 | 3.54 | 345546.6 |
| 2008 | 1286 | 33049 | 3.89 | 391088.8 |
| 2009 | 936 | 32243 | 2.9 | 287027.5 |
| 2010 | 1088 | 33164 | 3.28 | 336717.6 |
| 2011 | 1327 | 34309 | 3.87 | 413800.9 |
| 2012 | 1342 | 35145 | 3.82 | 421934.6 |
| 2013 | 1331 | 35956 | 3.7 | 421623.3 |
| 2014 | 1287 | 37194 | 3.46 | 410907.2 |
| 2015 | 991 | 38213 | 2.59 | 318796.3 |
| 2016 | 885 | 39238 | 2.26 | 287014.9 |
| 2017 | 992 | 40693 | 2.44 | 323982.8 |
| 2018 | 1116 | 42415 | 2.63 | 366675.3 |
| 2019 | 1067 | 43720 | 2.44 | 352511.8 |
| 2020 | 779 | 42920 | 1.82 | 258458.4 |
| 2021 | 1162 | 48539 | 2.39 | 385742.6 |
| 2022 | 1541 | 52961 | 2.91 | 514601.9 |
| 2023 | 1380 | 55917 | 2.47 | 464897.1 |
| 2024 | 1295 | 58499 | 2.21 | 440526.1 |
Sources and methods
This is retrospective enrichment using pinned catalogue snapshots, not a reconstruction of what was knowable on the edition date of 1 September 2026. Later revisions may be present in the extracts.
Research compiled 11 September 2026 against BLS Current Employment Statistics snapshot bls-ce-snapshot-2026-08-24 (normalized run 2026-08-24T10-07-20Z), BEA annual state GDP release bea-regional-state-annual-2026-04-09 (normalized 2026-08-31T17-15-40Z), and BEA SAPCE release bea-sapce-2025-09-26 (normalized 2026-08-31T17-18-16Z).
Employment series are national, seasonally adjusted, monthly CES payrolls converted to annual averages of available months. Refinery, drilling and gasoline-station 2026 averages use January–June; oil and gas extraction 2026 includes July. Latest month shown in the jobs comparison is June 2026 for refineries (61,300), stations (994,200) and drilling (45,800), and July 2026 for extraction (114,600).
Petroleum refineries (CES industry 324110) are a subset of petroleum and coal products manufacturing (324). Real and nominal GDP figures use BEA NAICS 324, whose dominant process is petroleum refining but which also includes asphalt and other coal- and petroleum-product manufacturing. Do not treat GDP and CES refinery headcount as identical coverage.
State GDP bars are 2024 nominal millions for a selected set of refining states, not a complete 50-state ranking. Shares of the U.S. 324 total use the 2024 U.S. nominal figure of $195.712 billion.
Gasoline and other energy goods in PCE include motor-vehicle fuels, lubricants and fluids plus fuel oils and other fuels. Per-capita figures are not household averages. 2024 is the latest annual PCE year in the snapshot and predates the 2026 Iran-war price spike reported in the day’s news.
Duplicate CES rows were collapsed by keeping the last observation per period_start; the seasonally adjusted extracts used here had one row per month. Missing values were not treated as zero. No causal claim is made that refinery headcount, GDP or PCE shares determine retail gasoline prices.
Research completed 2026-09-11, for the September 1, 2026 news edition. This is retrospective analysis, not a reconstruction of information available that day.