Research
The plants are closing. The food-factory books are not.
A 700-person shock in a still-large industry
Tyson Foods is shutting its five-year-old case-ready beef plant in Eagle Mountain, Utah, after sending layoff notices to more than 700 workers, and closing a larger plant in Joslin, Illinois, while selling another in Washington. The company has tied the retreat to U.S. cattle supplies at a 75-year low after years of drought and rising costs, according to reporting in the Deseret News. Austin Campbell, a 27-year-old maintenance worker at the Utah plant, was offered a shot at other Tyson sites and declined. Starting pay there ran around $30 an hour. Other industrial shops, he said, offer $20 to $25.
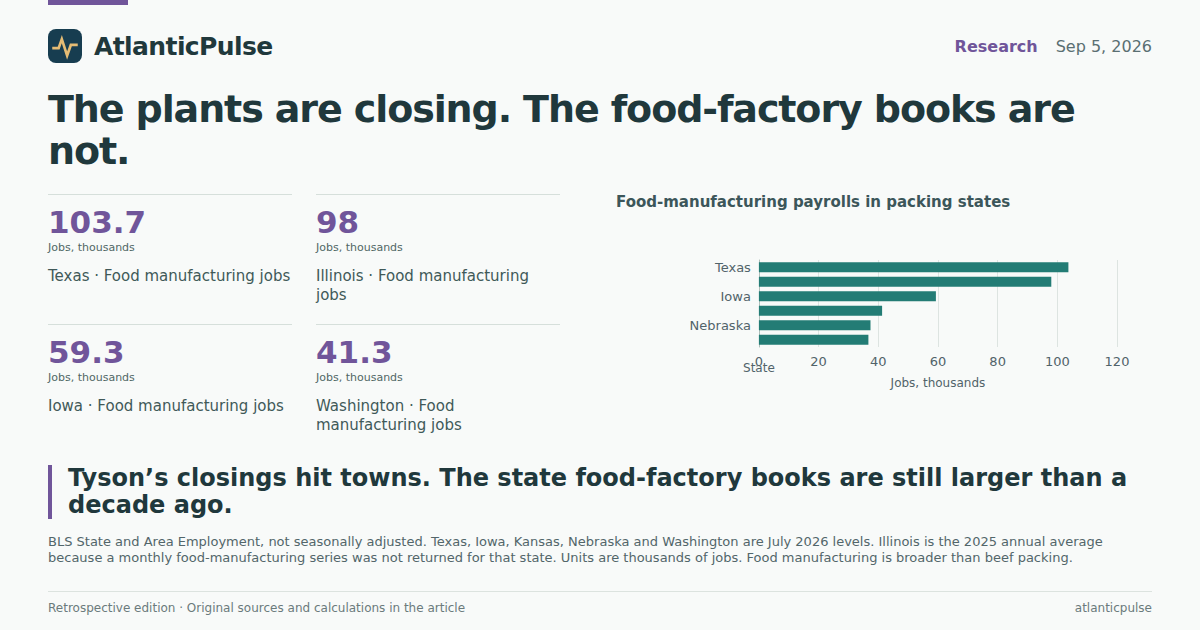
That is a brutal local story. It is not, on the official books, the story of a collapsing food-factory economy. Bureau of Labor Statistics state payrolls put Texas food manufacturing at 103,700 jobs in July 2026, Illinois at 98,000 on a 2025 annual average, Iowa at 59,300, Washington at 41,300, Nebraska at 37,400 and Kansas at 36,700. Those figures are not seasonally adjusted, and Illinois is an annual average because a monthly food-manufacturing series was not returned for that state. They also cover bakeries, dairies and snack plants as well as slaughterhouses. They are still the right scale check. A 700-person closing is a disaster on one shift. It is not the disappearance of food manufacturing in the Interior West.
Utah is the awkward case. The catalogue has no State and Area Employment series for Utah food manufacturing, so there is no honest way to put those 700 notices next to a Utah food-factory headcount. Substituting statewide manufacturing would be a dodge. What Utah does have is output and compensation, and those series do not show a withered industry waiting for Tyson to leave.
Food-manufacturing payrolls in packing states

View exact chart values
| state | jobs_thousands | period |
|---|---|---|
| Texas | 103.7 | 2026-07 |
| Illinois | 98 | 2025 annual avg |
| Iowa | 59.3 | 2026-07 |
| Washington | 41.3 | 2026-07 |
| Nebraska | 37.4 | 2026-07 |
| Kansas | 36.7 | 2026-07 |
The jobs grew. 2026 just stopped looking like a boom.
Look back a decade and the packing states added food-factory jobs, they did not bleed them. From July 2015 to July 2026, Texas food manufacturing rose 22.4 percent, Kansas 19.9 percent, Iowa 14.9 percent, Nebraska 9.4 percent and Washington 6.7 percent, all on the same not-seasonally-adjusted July snapshot. Illinois’s annual average rose 23.4 percent from 2015 to 2025. That is the opposite of a 75-year cattle low showing up as a missing workforce.
The last year is less flattering. Texas peaked at 107,600 food-manufacturing jobs in July 2025 and was down to 103,700 in July 2026. Nebraska fell from 41,500 to 37,400 over the same July-to-July span. Iowa, Kansas and Washington also sat below their mid-decade peaks. Illinois’s annual average slipped from 99,200 in 2024 to 98,000 in 2025. None of that proves the Tyson announcements caused the dip — the Utah notices went out only weeks ago, and food manufacturing is much bigger than beef — but it is the first official hint that the 2020s hiring run has stalled.
Nationally, the Current Employment Statistics seasonally adjusted food-manufacturing payroll was 1.764 million in July 2026, up 16.7 percent from 1.512 million in July 2015. Animal slaughtering and processing, the slice that includes Tyson’s plants, stood at 563,300 in June 2026, up from 486,700 in July 2015. Slaughtering is still about a third of food manufacturing, not a rounding error and not the whole industry. A prior national look at slaughter versus poultry is a different question. The state books say the factory floor around those plants got bigger for most of a decade, then wobbled.
July food-manufacturing jobs, 2015–2026

View exact chart values
| year | Texas | Iowa | Kansas | Nebraska | Washington | Illinois_annual |
|---|---|---|---|---|---|---|
| 2015 | 84.7 | 51.6 | 30.6 | 34.2 | 38.7 | 79.4 |
| 2016 | 86.7 | 52.2 | 31.5 | 35.1 | 39.1 | 81.4 |
| 2017 | 90.9 | 55 | 33 | 36.4 | 39.5 | 83.7 |
| 2018 | 92.6 | 56.8 | 33.1 | 37.4 | 41.2 | 84.9 |
| 2019 | 95.2 | 58.7 | 33.8 | 37.3 | 41.3 | 85.3 |
| 2020 | 94.1 | 58.6 | 35.3 | 38 | 38.6 | 83.4 |
| 2021 | 98.5 | 59.5 | 35.9 | 38.3 | 40.5 | 86.1 |
| 2022 | 104.2 | 60.7 | 37.1 | 40 | 41.7 | 89.1 |
| 2023 | 106 | 62.8 | 37.3 | 40.4 | 41.8 | 94.2 |
| 2024 | 107.1 | 61 | 38 | 41.3 | 42.2 | 99.2 |
| 2025 | 107.6 | 59.7 | 37.4 | 41.5 | 41.7 | 98 |
| 2026 | 103.7 | 59.3 | 36.7 | 37.4 | 41.3 | — |
Utah’s food output rose. Illinois’s barely did.
Jobs are not the same as output. BEA real GDP for food and beverage and tobacco product manufacturing, in chained 2017 dollars, shows Utah’s industry at $3.04 billion in 2024, up 66.9 percent from 2015 and 29.6 percent from 2020. Kansas was up 72.5 percent over the decade, Nebraska 57.8 percent, Texas 27.4 percent and Iowa 22.5 percent. Illinois, the other Tyson closing, grew only 8.0 percent in real terms, to $14.55 billion. Washington rose 13.8 percent. The Eagle Mountain plant is five years old. Utah’s food-factory output was already climbing before it opened and kept climbing after.
Share of the state economy tells a different ranking than raw dollars. In 2024, food and beverage and tobacco manufacturing was 4.25 percent of Iowa’s nominal GDP, 4.00 percent of Nebraska’s and 3.95 percent of Kansas’s. Illinois was 1.54 percent, Utah 1.23 percent and Texas 0.82 percent. Texas has the biggest food-manufacturing payroll in this group and the smallest food footprint in its economy, because everything else in Texas is enormous. Iowa can feel a packing-plant cycle in the state accounts. Texas will not. Utah sits in the middle: the industry is real, and it is not the state’s livelihood.
Two caveats belong next to those shares. The BEA industry includes beverages and tobacco, so it is wider than the BLS food-manufacturing payroll. And 2024 is the latest annual GDP year in this snapshot, so it cannot yet register a 2026 plant closing. The point is not that Tyson’s exit will be invisible in Eagle Mountain. It is that Utah’s food-manufacturing GDP was $3.0 billion and growing before the notices went out, while Illinois’s much larger industry has been the slow-growth name on the list.
Food, beverage and tobacco real GDP, 2015 = 100

View exact chart values
| year | Illinois | Utah | Texas | Iowa | Kansas | Nebraska | Washington |
|---|---|---|---|---|---|---|---|
| 2015 | 100 | 100 | 100 | 100 | 100 | 100 | 100 |
| 2016 | 98.5 | 95.7 | 93.2 | 97.3 | 94.4 | 100.1 | 97.3 |
| 2017 | 95.2 | 106.4 | 98.6 | 90.4 | 106.3 | 102.6 | 98.5 |
| 2018 | 94.9 | 108.7 | 105.6 | 98.6 | 131.4 | 126.5 | 100.3 |
| 2019 | 92 | 116.5 | 107.9 | 92 | 122.3 | 125.1 | 100.7 |
| 2020 | 91 | 128.8 | 108.7 | 105 | 116.7 | 135.1 | 105.1 |
| 2021 | 101.8 | 138.9 | 120.9 | 111.6 | 148.8 | 171.1 | 109.7 |
| 2022 | 100.9 | 154.7 | 119.5 | 122.4 | 180.8 | 160.8 | 115.7 |
| 2023 | 105.2 | 161.2 | 122.4 | 121.8 | 174.1 | 154.8 | 116.4 |
| 2024 | 108 | 166.9 | 127.4 | 122.5 | 172.5 | 157.8 | 113.8 |
Food industries as a share of state GDP, 2024

View exact chart values
| state | year | food_gdp_millions | total_gdp_millions | share_pct |
|---|---|---|---|---|
| Iowa | 2024 | 11292.5 | 265794.5 | 4.25 |
| Nebraska | 2024 | 7568 | 189242.7 | 4 |
| Kansas | 2024 | 9097.7 | 230522.1 | 3.95 |
| Illinois | 2024 | 17671.5 | 1148106.1 | 1.54 |
| Utah | 2024 | 3697.4 | 299471.3 | 1.23 |
| Texas | 2024 | 22738.5 | 2769766.2 | 0.82 |
The paychecks got larger, including in Utah
Compensation of employees in food manufacturing — a narrower NAICS 311 measure than the GDP grouping — rose in both closing states. Illinois went from $5.62 billion in 2015 to $8.99 billion in 2024, a 60 percent increase. Utah went from $834 million to $1.62 billion, a 94 percent increase. Those are dollars, not headcounts, so they mix more workers, higher pay and inflation. They still answer the question the jobs series cannot answer for Utah: the state’s food-factory payroll bill nearly doubled in a decade. A plant that pays $30 an hour to a few hundred people is a hole in a town. It is not the end of a $1.6 billion compensation stream.
That is the uncomfortable arithmetic of this week’s news. The cattle herd can be the smallest in 75 years, a company can close three plants, and a software-trained maintenance worker can still be right that he cannot take a $10-an-hour pay cut. Official state data do not contradict him. They locate him. Food manufacturing in Illinois is about 98,000 jobs. In Texas it is more than 100,000. In Iowa it is still almost 4 percent of the whole economy. In Utah the output number rose faster than in Illinois. The 2026 monthly figures have started to roll over from their peaks. A WARN notice in Eagle Mountain is how a national cattle shortage becomes a family budget. It is not, yet, how it becomes a missing industry.
Food-manufacturing compensation in Illinois and Utah

View exact chart values
| year | Illinois_billions | Utah_billions |
|---|---|---|
| 2015 | 5.618 | 0.834 |
| 2016 | 5.903 | 0.879 |
| 2017 | 6.196 | 0.925 |
| 2018 | 6.284 | 0.968 |
| 2019 | 6.365 | 1.018 |
| 2020 | 6.717 | 1.14 |
| 2021 | 7.22 | 1.259 |
| 2022 | 7.891 | 1.415 |
| 2023 | 8.423 | 1.507 |
| 2024 | 8.991 | 1.615 |
Sources and methods
This is retrospective enrichment using pinned catalogue snapshots, not an as-known-on-2026-09-05 reconstruction. Later releases may revise the figures.
Research date: 2026-09-11. Historical edition date: 2026-09-05.
BLS State and Area Employment snapshot 2026-08-24 (release id bls-sm-snapshot-2026-08-24). Monthly not-seasonally-adjusted food-manufacturing all-employees series through July 2026 for Texas, Iowa, Kansas, Nebraska and Washington. Illinois food manufacturing was available only as an annual NSA average through 2025; monthly extracts for that Illinois series returned no rows. Utah has no food-manufacturing SAE employment series in the catalogue; statewide manufacturing was not substituted.
BLS Current Employment Statistics snapshot 2026-08-24 (bls-ce-snapshot-2026-08-24). Seasonally adjusted national food-manufacturing employment through July 2026; seasonally adjusted animal slaughtering and processing through June 2026 (July 2026 slaughter was missing in this extract).
BEA annual state GDP and income snapshot 2026-08-31, source release bea-regional-state-annual-2026-04-09. Real GDP (chained 2017 dollars) and current-dollar GDP for food and beverage and tobacco product manufacturing, current-dollar all-industry GDP, and compensation of employees in food manufacturing (NAICS 311). Latest GDP and compensation year used is 2024.
Jobs are in thousands of employees. GDP is in millions of dollars. Compensation is in thousands of dollars in the source and was divided by 1,000,000 for billions. Percent changes use the same series at two dates; missing is not zero. July-to-July NSA comparisons avoid mixing seasons; they are not seasonally adjusted trends. Food manufacturing (BLS) is not identical to food and beverage and tobacco manufacturing (BEA GDP) or to animal slaughtering and processing. No causal effect is inferred from Tyson’s announcements to 2026 payroll changes.
Research completed 2026-09-11, for the September 5, 2026 news edition. This is retrospective analysis, not a reconstruction of information available that day.