Research
The paycheck is still most of the money. It is a smaller slice than it used to be.
The fog is real. A collapse in pay is not.
A record 37 percent of families told the Federal Reserve they did not have a good idea of next year's income, a new high in the Survey of Consumer Finances. That finding, built on interviews in 2025, is about confidence, not about whether last year's paycheck arrived. The official personal-income accounts, which add up wages, transfers, proprietors' income and returns on assets, tell a cooler story. They do not measure what any one family can plan on. They do show what the country as a whole has been living on.
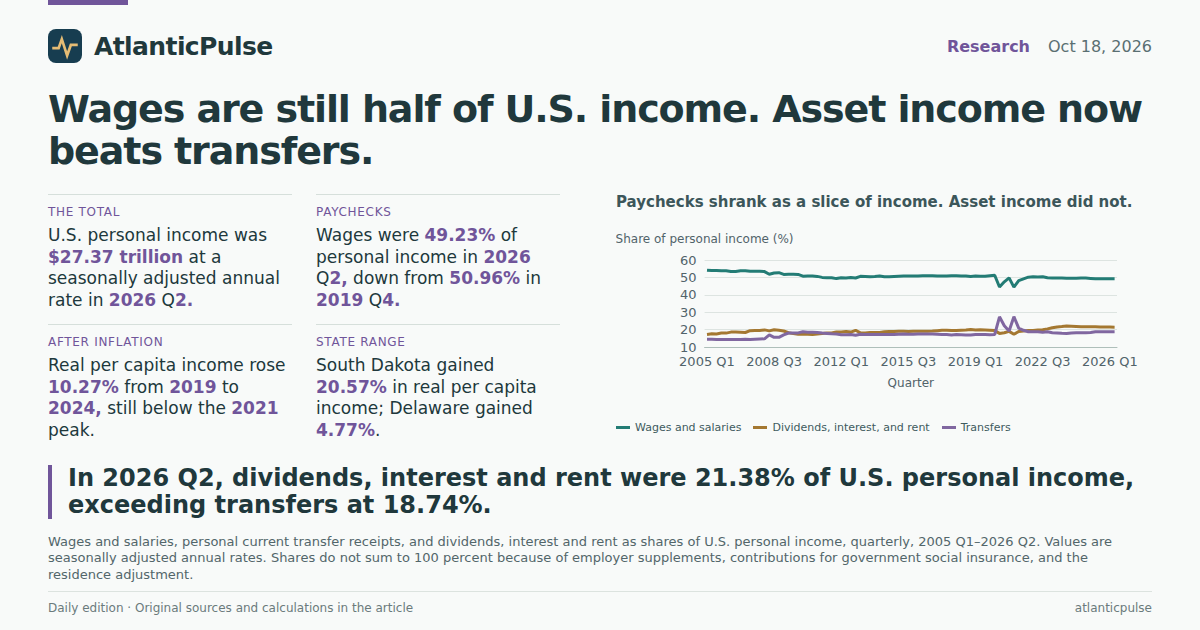
By 2026 Q2, U.S. personal income was running at a $27.37 trillion seasonally adjusted annual rate, according to the Bureau of Economic Analysis state personal-income accounts. Wages and salaries were $13.47 trillion of that, or 49.2 percent. Transfers — Social Security, medical benefits, unemployment insurance and the rest — were $5.13 trillion, or 18.7 percent. Dividends, interest and rent were $5.85 trillion, or 21.4 percent. In other words, asset income now exceeds government transfers as a slice of the national total. That is not a household average, and it is not a forecast. It is the mix on the books as of the second quarter.
The same accounts run back far enough to show that this mix did not appear overnight. In 2019 Q4, just before the pandemic scrambled every line, wages were 51.0 percent of personal income, transfers 17.1 percent, and dividends, interest and rent 19.7 percent. The wage share is down 1.7 percentage points. Transfers are up 1.7 points. Asset income is up 1.7 points. The pandemic spikes of 2020 and 2021, when transfer shares briefly topped 27 percent, have faded. What remains is a quieter shift: a slightly smaller paycheck slice, a slightly larger asset slice, and a transfer slice that is still above its pre-pandemic mark without looking like emergency aid.
Paychecks shrank as a slice of income. Asset income did not.

View exact chart values
| period | year_q | personal_income_saar_mil | wage_share_pct | transfer_share_pct | dir_share_pct | prop_share_pct | personal_income_saar_tril | wages_saar_mil | transfers_saar_mil | dir_saar_mil | pcpi_dollars |
|---|---|---|---|---|---|---|---|---|---|---|---|
| 2005:Q1 | 2005 Q1 | 10287795.8 | 54.16 | 14.46 | 17.26 | 9.32 | 10.288 | 5571972 | 1488076 | 1775864 | — |
| 2005:Q2 | 2005 Q2 | 10453936.4 | 53.91 | 14.47 | 17.59 | 9.25 | 10.454 | 5635196 | 1512612 | 1838916 | — |
| 2005:Q3 | 2005 Q3 | 10616693.1 | 54.02 | 14.39 | 17.51 | 9.33 | 10.617 | 5735220 | 1528264 | 1859156 | — |
| 2005:Q4 | 2005 Q4 | 10804774.8 | 53.78 | 14.23 | 17.98 | 9.33 | 10.805 | 5811204 | 1537892 | 1942776 | — |
| 2006:Q1 | 2006 Q1 | 11095940.1 | 53.77 | 14.31 | 18 | 9.47 | 11.096 | 5966500 | 1588292 | 1996748 | — |
| 2006:Q2 | 2006 Q2 | 11247770.7 | 53.41 | 14.25 | 18.58 | 9.35 | 11.248 | 6007040 | 1602804 | 2089552 | — |
| 2006:Q3 | 2006 Q3 | 11339191.8 | 53.4 | 14.36 | 18.57 | 9.24 | 11.339 | 6055632 | 1628296 | 2105768 | — |
| 2006:Q4 | 2006 Q4 | 11482881.3 | 53.79 | 14.25 | 18.42 | 9.15 | 11.483 | 6176256 | 1635864 | 2115088 | — |
| 2007:Q1 | 2007 Q1 | 11768805.4 | 53.87 | 14.5 | 18.33 | 9.01 | 11.769 | 6339388 | 1706664 | 2156680 | — |
| 2007:Q2 | 2007 Q2 | 11899235.1 | 53.51 | 14.37 | 19.34 | 8.43 | 11.899 | 6366952 | 1710320 | 2301740 | — |
| 2007:Q3 | 2007 Q3 | 11954124.3 | 53.49 | 14.49 | 19.52 | 8.1 | 11.954 | 6393692 | 1732640 | 2333560 | — |
| 2007:Q4 | 2007 Q4 | 12078011.2 | 53.58 | 14.59 | 19.54 | 7.89 | 12.078 | 6471296 | 1762636 | 2360552 | — |
| 2008:Q1 | 2008 Q1 | 12258132.9 | 53.34 | 14.71 | 19.8 | 7.83 | 12.258 | 6538008 | 1802888 | 2427128 | — |
| 2008:Q2 | 2008 Q2 | 12612538.5 | 51.77 | 17.03 | 19.24 | 7.72 | 12.613 | 6529368 | 2148360 | 2426500 | — |
| 2008:Q3 | 2008 Q3 | 12463199.5 | 52.5 | 15.58 | 19.88 | 7.76 | 12.463 | 6542972 | 1941364 | 2477116 | — |
| 2008:Q4 | 2008 Q4 | 12359769.2 | 52.7 | 15.6 | 19.61 | 7.78 | 12.36 | 6514048 | 1927716 | 2423168 | — |
| 2009:Q1 | 2009 Q1 | 12027746.6 | 51.71 | 16.96 | 19.17 | 7.65 | 12.028 | 6219112 | 2039652 | 2305240 | — |
| 2009:Q2 | 2009 Q2 | 12068943.6 | 51.76 | 18.05 | 18.21 | 7.51 | 12.069 | 6247048 | 2178568 | 2197396 | — |
| 2009:Q3 | 2009 Q3 | 12014678.8 | 51.85 | 18.11 | 17.69 | 7.82 | 12.015 | 6229264 | 2176280 | 2125864 | — |
| 2009:Q4 | 2009 Q4 | 12121643 | 51.73 | 18.09 | 17.34 | 8.32 | 12.122 | 6270540 | 2192272 | 2101316 | — |
| 2010:Q1 | 2010 Q1 | 12277936 | 50.69 | 18.76 | 17.35 | 8.64 | 12.278 | 6223900 | 2303192 | 2130592 | 39803 |
| 2010:Q2 | 2010 Q2 | 12503808.7 | 50.8 | 18.48 | 17.33 | 8.88 | 12.504 | 6351592 | 2311056 | 2167504 | 40457 |
| 2010:Q3 | 2010 Q3 | 12630705.2 | 50.78 | 18.5 | 17.22 | 8.99 | 12.631 | 6413752 | 2336104 | 2174428 | 40779 |
| 2010:Q4 | 2010 Q4 | 12777554.1 | 50.59 | 18.39 | 17.51 | 9 | 12.778 | 6464228 | 2350116 | 2237256 | 41164 |
| 2011:Q1 | 2011 Q1 | 13132030.1 | 50.01 | 17.98 | 17.76 | 9.08 | 13.132 | 6567044 | 2361764 | 2332588 | 42230 |
| 2011:Q2 | 2011 Q2 | 13240161.2 | 49.83 | 17.84 | 17.97 | 9.21 | 13.24 | 6597636 | 2361576 | 2379384 | 42501 |
| 2011:Q3 | 2011 Q3 | 13382060.9 | 49.85 | 17.58 | 18.08 | 9.41 | 13.382 | 6671180 | 2352048 | 2419588 | 42865 |
| 2011:Q4 | 2011 Q4 | 13445019.9 | 49.29 | 17.55 | 18.62 | 9.46 | 13.445 | 6627152 | 2359228 | 2502992 | 42974 |
| 2012:Q1 | 2012 Q1 | 13715672.7 | 49.77 | 17.06 | 18.68 | 9.55 | 13.716 | 6826000 | 2340336 | 2561696 | 43757 |
| 2012:Q2 | 2012 Q2 | 13841459.9 | 49.61 | 17.07 | 18.91 | 9.5 | 13.841 | 6866324 | 2362784 | 2616756 | 44077 |
| 2012:Q3 | 2012 Q3 | 13795612.3 | 49.99 | 17.14 | 18.54 | 9.33 | 13.796 | 6896360 | 2364696 | 2557496 | 43837 |
| 2012:Q4 | 2012 Q4 | 14270251.1 | 49.64 | 16.71 | 19.61 | 9.16 | 14.27 | 7083980 | 2384136 | 2797928 | 45249 |
| 2013:Q1 | 2013 Q1 | 13896389.9 | 50.62 | 17.3 | 18.1 | 9.69 | 13.896 | 7034488 | 2403456 | 2515200 | 43992 |
| 2013:Q2 | 2013 Q2 | 14033746.6 | 50.55 | 17.22 | 18.07 | 9.8 | 14.034 | 7093756 | 2416188 | 2535552 | 44352 |
| 2013:Q3 | 2013 Q3 | 14118170.5 | 50.32 | 17.24 | 18.29 | 9.72 | 14.118 | 7103728 | 2434492 | 2581900 | 44525 |
| 2013:Q4 | 2013 Q4 | 14204825 | 50.6 | 17.2 | 18.28 | 9.51 | 14.205 | 7187172 | 2443132 | 2596168 | 44700 |
| 2014:Q1 | 2014 Q1 | 14453307.8 | 50.85 | 17.12 | 18.39 | 9.4 | 14.453 | 7349484 | 2474060 | 2657336 | 45399 |
| 2014:Q2 | 2014 Q2 | 14687303.6 | 50.39 | 17.2 | 18.76 | 9.45 | 14.687 | 7400660 | 2526732 | 2755012 | 46050 |
| 2014:Q3 | 2014 Q3 | 14882440.2 | 50.36 | 17.26 | 18.88 | 9.34 | 14.882 | 7494604 | 2568172 | 2809356 | 46560 |
| 2014:Q4 | 2014 Q4 | 15089588.4 | 50.54 | 17.21 | 18.97 | 9.15 | 15.09 | 7626072 | 2597100 | 2862416 | 47103 |
| 2015:Q1 | 2015 Q1 | 15276302.2 | 50.66 | 17.31 | 19.02 | 8.91 | 15.276 | 7738372 | 2644040 | 2906276 | 47602 |
| 2015:Q2 | 2015 Q2 | 15423817.5 | 50.72 | 17.39 | 19.06 | 8.73 | 15.424 | 7823032 | 2682308 | 2939576 | 47976 |
| 2015:Q3 | 2015 Q3 | 15541187 | 50.8 | 17.37 | 18.98 | 8.75 | 15.541 | 7895424 | 2699100 | 2949764 | 48238 |
| 2015:Q4 | 2015 Q4 | 15627145.2 | 50.88 | 17.38 | 19.01 | 8.65 | 15.627 | 7950380 | 2716032 | 2970096 | 48402 |
| 2016:Q1 | 2016 Q1 | 15703395.6 | 50.86 | 17.48 | 19.08 | 8.55 | 15.703 | 7987044 | 2745368 | 2996024 | 48552 |
| 2016:Q2 | 2016 Q2 | 15784190.6 | 50.9 | 17.53 | 19.05 | 8.5 | 15.784 | 8034452 | 2767680 | 3006584 | 48713 |
| 2016:Q3 | 2016 Q3 | 15938963.8 | 50.91 | 17.49 | 19.06 | 8.55 | 15.939 | 8115280 | 2787024 | 3038136 | 49090 |
| 2016:Q4 | 2016 Q4 | 16112413.9 | 50.96 | 17.43 | 19.12 | 8.53 | 16.112 | 8210220 | 2807860 | 3081024 | 49528 |
| 2017:Q1 | 2017 Q1 | 16356975.5 | 50.79 | 17.31 | 19.36 | 8.66 | 16.357 | 8306992 | 2831392 | 3166072 | 50203 |
| 2017:Q2 | 2017 Q2 | 16549325.2 | 50.75 | 17.15 | 19.6 | 8.62 | 16.549 | 8398192 | 2838136 | 3243564 | 50716 |
| 2017:Q3 | 2017 Q3 | 16740977.5 | 50.85 | 17.14 | 19.57 | 8.53 | 16.741 | 8513432 | 2869724 | 3276476 | 51211 |
| 2017:Q4 | 2017 Q4 | 16988569.7 | 50.97 | 16.97 | 19.49 | 8.64 | 16.989 | 8659456 | 2883328 | 3311584 | 51883 |
| 2018:Q1 | 2018 Q1 | 17192994.4 | 50.91 | 17.1 | 19.48 | 8.59 | 17.193 | 8752836 | 2939376 | 3349076 | 52443 |
| 2018:Q2 | 2018 Q2 | 17393989.1 | 50.78 | 17.05 | 19.66 | 8.54 | 17.394 | 8831852 | 2966044 | 3418932 | 52986 |
| 2018:Q3 | 2018 Q3 | 17633681.1 | 50.79 | 16.95 | 19.75 | 8.54 | 17.634 | 8956604 | 2988980 | 3482196 | 53632 |
| 2018:Q4 | 2018 Q4 | 17836943.5 | 50.52 | 16.88 | 20.03 | 8.61 | 17.837 | 9011308 | 3010556 | 3572060 | 54170 |
| 2019:Q1 | 2019 Q1 | 18140923.5 | 50.77 | 17.12 | 19.79 | 8.5 | 18.141 | 9210148 | 3106020 | 3589452 | 55035 |
| 2019:Q2 | 2019 Q2 | 18279908.9 | 50.67 | 17.19 | 19.91 | 8.44 | 18.28 | 9261752 | 3142756 | 3638784 | 55393 |
| 2019:Q3 | 2019 Q3 | 18402804.5 | 50.63 | 17.2 | 19.82 | 8.57 | 18.403 | 9317552 | 3166068 | 3647464 | 55683 |
| 2019:Q4 | 2019 Q4 | 18574699.1 | 50.96 | 17.08 | 19.68 | 8.55 | 18.575 | 9465120 | 3173392 | 3656304 | 56118 |
| 2020:Q1 | 2020 Q1 | 18752696.7 | 51.26 | 17.18 | 19.44 | 8.49 | 18.753 | 9612828 | 3221536 | 3646112 | 56597 |
| 2020:Q2 | 2020 Q2 | 20176400.7 | 44.51 | 27.34 | 17.81 | 7.1 | 20.176 | 8980632 | 5516856 | 3592508 | 60860 |
| 2020:Q3 | 2020 Q3 | 19829431.3 | 47.49 | 22.24 | 18.17 | 8.64 | 19.829 | 9417532 | 4409828 | 3603364 | 59783 |
| 2020:Q4 | 2020 Q4 | 19693707.3 | 49.69 | 19.26 | 18.95 | 8.55 | 19.694 | 9785536 | 3792356 | 3731548 | 59342 |
| 2021:Q1 | 2021 Q1 | 22204244.1 | 44.44 | 27.4 | 17.3 | 7.67 | 22.204 | 9867776 | 6082876 | 3842036 | 66918 |
| 2021:Q2 | 2021 Q2 | 21086473.8 | 48.18 | 20.82 | 18.91 | 8.78 | 21.086 | 10159876 | 4389196 | 3988468 | 63519 |
| 2021:Q3 | 2021 Q3 | 21240443.8 | 49.17 | 19.57 | 19.22 | 8.84 | 21.24 | 10443920 | 4157636 | 4082236 | 63904 |
| 2021:Q4 | 2021 Q4 | 21440170.3 | 50.09 | 18.71 | 19.43 | 8.72 | 21.44 | 10740064 | 4012008 | 4164764 | 64413 |
| 2022:Q1 | 2022 Q1 | 21640895.5 | 50.34 | 18.76 | 19.4 | 8.63 | 21.641 | 10893792 | 4060876 | 4198796 | 64946 |
| 2022:Q2 | 2022 Q2 | 21906452.9 | 50.17 | 18.79 | 19.71 | 8.55 | 21.906 | 10989408 | 4116920 | 4317636 | 65645 |
| 2022:Q3 | 2022 Q3 | 22339333.5 | 50.43 | 18.5 | 19.89 | 8.48 | 22.339 | 11265896 | 4133796 | 4442336 | 66808 |
| 2022:Q4 | 2022 Q4 | 22710366.1 | 49.83 | 18.74 | 20.41 | 8.25 | 22.71 | 11316144 | 4255872 | 4635736 | 67771 |
| 2023:Q1 | 2023 Q1 | 23098092.6 | 49.67 | 18.23 | 21.1 | 8.13 | 23.098 | 11472080 | 4210204 | 4873448 | 68799 |
| 2023:Q2 | 2023 Q2 | 23477115 | 49.57 | 18.1 | 21.56 | 7.85 | 23.477 | 11636732 | 4248800 | 5060576 | 69791 |
| 2023:Q3 | 2023 Q3 | 23810358.2 | 49.7 | 17.88 | 21.73 | 7.72 | 23.81 | 11834352 | 4257104 | 5172972 | 70612 |
| 2023:Q4 | 2023 Q4 | 24163022.3 | 49.56 | 17.75 | 22.04 | 7.65 | 24.163 | 11976108 | 4288860 | 5325120 | 71479 |
| 2024:Q1 | 2024 Q1 | 24573950.3 | 49.49 | 18.06 | 21.87 | 7.64 | 24.574 | 12161452 | 4438124 | 5374484 | 72534 |
| 2024:Q2 | 2024 Q2 | 24920072.3 | 49.5 | 18.15 | 21.76 | 7.68 | 24.92 | 12335784 | 4523716 | 5423100 | 73384 |
| 2024:Q3 | 2024 Q3 | 25164081.1 | 49.59 | 18.2 | 21.63 | 7.7 | 25.164 | 12478928 | 4579476 | 5444228 | 73953 |
| 2024:Q4 | 2024 Q4 | 25484900.3 | 49.61 | 18.22 | 21.63 | 7.71 | 25.485 | 12643532 | 4644168 | 5511652 | 74788 |
| 2025:Q1 | 2025 Q1 | 25870888.2 | 49.41 | 18.36 | 21.69 | 7.8 | 25.871 | 12783580 | 4750516 | 5610760 | 75837 |
| 2025:Q2 | 2025 Q2 | 26221908 | 49.2 | 18.72 | 21.61 | 7.72 | 26.222 | 12900428 | 4907556 | 5667080 | 76774 |
| 2025:Q3 | 2025 Q3 | 26493312.5 | 49.2 | 18.78 | 21.5 | 7.72 | 26.493 | 13034428 | 4974816 | 5695680 | 77480 |
| 2025:Q4 | 2025 Q4 | 26721863.4 | 49.25 | 18.8 | 21.43 | 7.65 | 26.722 | 13159908 | 5023028 | 5726440 | 78090 |
| 2026:Q1 | 2026 Q1 | 27053325.5 | 49.26 | 18.73 | 21.41 | 7.79 | 27.053 | 13327037 | 5065939 | 5791000 | 79024 |
| 2026:Q2 | 2026 Q2 | 27367664.9 | 49.23 | 18.74 | 21.38 | 7.81 | 27.368 | 13473917 | 5129273 | 5850924 | 79904 |
Four slices, none of them a paycheck you can put in an envelope
Comparing 2019 Q4 with 2026 Q2 side by side makes the arithmetic blunt. Wages are still the largest piece. They are no longer as large as they were on the eve of the pandemic. Dividends, interest and rent have pulled ahead of transfers. Proprietors' income, the line that covers farms, partnerships and many small businesses, slipped from 8.6 percent to 7.8 percent. Those four categories still do not add to 100 percent. Employer supplements, contributions for government social insurance, and the residence adjustment sit in the remainder. Treating wages as "take-home pay" would be a mistake: the wage line is measured before deductions.
Nominal per capita personal income rose from $56,118 in 2019 Q4 to $79,904 in 2026 Q2. That is a current-dollar figure, not an inflation-adjusted one, and it is an annual rate divided by population, not a typical household. It does mean that the national income pie got bigger even as its composition tilted. Year-over-year growth in personal income has cooled from the mid-6-percent pace of 2023 into the mid-4-percent range in the first half of 2026. The books are still expanding. They are expanding more slowly.
For anyone trying to square that with a record share of families who cannot forecast next year, the useful distinction is between a total that is rising and a mix that is harder to read from a kitchen table. Wages are the line most workers can see. Transfers are the line retirees and benefit recipients can see. Dividends, interest and rent are the line that moves with rates, rents and markets — and that is concentrated among people who own assets. A national average in which asset income outruns transfers can coexist with a large minority of families who have no idea what next year pays. The accounts do not contradict the survey. They describe a different object.
The mix of American income, 2019 versus 2026

View exact chart values
| category | share_2019q4 | share_2026q2 |
|---|---|---|
| Wages and salaries | 50.96 | 49.23 |
| Dividends, interest, and rent | 19.68 | 21.38 |
| Transfers | 17.08 | 18.74 |
| Proprietors' income | 8.55 | 7.81 |
Real income is up since 2019. It has not recaptured 2021.
Current dollars flatter the story. BEA's real per capita personal income, expressed in constant 2017 dollars and adjusted with regional price parities, is the cleaner comparison across years. That series runs only through 2024 in this snapshot, so it cannot speak to 2025 or 2026 prices. Through 2024 it is unambiguous. U.S. real per capita personal income was $53,683 in 2019 and $59,195 in 2024, a 10.3 percent gain over five years. It peaked at $59,365 in 2021, when pandemic transfers were still swelling the total, then fell to $57,104 in 2022 as those payments dropped out and prices jumped. 2023 and 2024 recovered most of that loss. They did not set a new high.
That path matters for the Survey of Consumer Finances, whose 2025 interviews asked families about income in 2024 and about their forecast for the next year. Families' recent income had, in the Fed's telling, settled back toward "normal" even as forward-looking uncertainty hit a record. The real-income accounts fit that pairing. 2024 was not a collapse year. It was a year in which inflation-adjusted income was higher than in 2019 and still a shade below the 2021 spike. Uncertainty about next year is a separate question, and the annual real series stops before 2026's fuel-price shock can show up in these dollars.
None of this is a household budget. Per capita personal income divides a statewide or national total by population. It mixes wages with Social Security, Medicaid, dividends and rent. A retiree living on benefits and a dual-earner family with a mortgage are in the same average. The 10.3 percent real gain since 2019 is still the right benchmark for the claim that "incomes have not kept up." In these accounts, through 2024, they had more than kept up with 2019. They had not kept up with 2021.
Inflation-adjusted income is higher than in 2019. It is still below 2021.

View exact chart values
| year | real_pcpi_2017_dollars |
|---|---|
| 2008 | 45816 |
| 2009 | 44204 |
| 2010 | 44808 |
| 2011 | 45957 |
| 2012 | 46796 |
| 2013 | 46358 |
| 2014 | 47661 |
| 2015 | 49396 |
| 2016 | 49828 |
| 2017 | 51006 |
| 2018 | 52242 |
| 2019 | 53683 |
| 2020 | 56514 |
| 2021 | 59365 |
| 2022 | 57104 |
| 2023 | 58088 |
| 2024 | 59195 |
South Dakota gained 21 percent. Delaware gained 5.
The national 10.3 percent real gain hides a wide state range. From 2019 to 2024, real per capita personal income rose 20.6 percent in South Dakota and 18.7 percent in Wyoming. It rose 4.8 percent in Delaware and 5.7 percent in Pennsylvania. Twenty-two of the 50 states lagged the U.S. average. Mississippi remained the lowest-level state in 2024, at $48,465 in 2017 dollars, even after a 10.7 percent gain. Wyoming, at $75,501, was the highest. The ranking is not a poverty ranking and it is not a midterm forecast. It is the change in a price-adjusted income total.
Plains and energy states cluster toward the top of the change list: Nebraska 16.7 percent, Montana 16.1 percent, Iowa 14.8 percent, Arkansas 14.5 percent. Several large Eastern states sit near the bottom: New Jersey 7.4 percent, Illinois 7.4 percent, Georgia 6.4 percent, Pennsylvania 5.7 percent. California, at 12.7 percent, outpaced the U.S. average. Texas did too, at 11.2 percent. Florida, at 9.6 percent, did not. A scatter of 2024 levels against 2019–2024 changes shows that starting rich was no guarantee of growing fast. Connecticut's 2024 level was among the highest; its five-year gain was 7.5 percent.
The states named in this week's midterm reporting are not a single story. Among that group, Nebraska, Montana, Iowa and Arkansas posted some of the largest real-income gains in the country. Pennsylvania, Georgia, New Jersey, South Carolina, Wisconsin and Michigan all came in below the U.S. average. Kentucky, where the president was rallying, rose 11.4 percent — a hair above the national pace. If voters there are furious about groceries and diesel, it is not because these 2019–2024 accounts show a lost decade. The accounts stop in 2024. The pump does not.
Where real incomes rose fastest — and slowest — since 2019

View exact chart values
| state | real_pcpi_2019 | real_pcpi_2024 | chg_pct | chg_dollars |
|---|---|---|---|---|
| South Dakota | 57354 | 69153 | 20.57 | 11799 |
| Wyoming | 63616 | 75501 | 18.68 | 11885 |
| Nebraska | 55976 | 65297 | 16.65 | 9321 |
| Montana | 50997 | 59203 | 16.09 | 8206 |
| Utah | 47937 | 55116 | 14.98 | 7179 |
| Iowa | 52372 | 60144 | 14.84 | 7772 |
| Arkansas | 48246 | 55219 | 14.45 | 6973 |
| Missouri | 50660 | 57850 | 14.19 | 7190 |
| Oregon | 48660 | 55451 | 13.96 | 6791 |
| Louisiana | 49920 | 56789 | 13.76 | 6869 |
| New Mexico | 45000 | 51121 | 13.6 | 6121 |
| Maine | 50601 | 57480 | 13.59 | 6879 |
| Washington | 56862 | 64421 | 13.29 | 7559 |
| Tennessee | 51865 | 58582 | 12.95 | 6717 |
| Colorado | 57869 | 65223 | 12.71 | 7354 |
| California | 55931 | 63028 | 12.69 | 7097 |
| Oklahoma | 52199 | 58692 | 12.44 | 6493 |
| Arizona | 47236 | 52890 | 11.97 | 5654 |
| Hawaii | 46712 | 52272 | 11.9 | 5560 |
| Vermont | 52744 | 58893 | 11.66 | 6149 |
| Kentucky | 46956 | 52290 | 11.36 | 5334 |
| Texas | 52343 | 58219 | 11.23 | 5876 |
| Nevada | 50866 | 56503 | 11.08 | 5637 |
| North Dakota | 58846 | 65271 | 10.92 | 6425 |
| Alabama | 47130 | 52216 | 10.79 | 5086 |
| Mississippi | 43785 | 48465 | 10.69 | 4680 |
| North Carolina | 50966 | 56310 | 10.49 | 5344 |
| Indiana | 50329 | 55562 | 10.4 | 5233 |
| Idaho | 48040 | 52816 | 9.94 | 4776 |
| Ohio | 51249 | 56232 | 9.72 | 4983 |
| Virginia | 56459 | 61914 | 9.66 | 5455 |
| Florida | 52128 | 57131 | 9.6 | 5003 |
| Massachusetts | 65383 | 71629 | 9.55 | 6246 |
| Minnesota | 56749 | 62039 | 9.32 | 5290 |
| New York | 58786 | 64153 | 9.13 | 5367 |
| Kansas | 54437 | 59172 | 8.7 | 4735 |
| Michigan | 49306 | 53569 | 8.65 | 4263 |
| Wisconsin | 53652 | 58273 | 8.61 | 4621 |
| New Hampshire | 59512 | 64632 | 8.6 | 5120 |
| Maryland | 56850 | 61111 | 7.5 | 4261 |
| Connecticut | 69091 | 74254 | 7.47 | 5163 |
| South Carolina | 48823 | 52463 | 7.46 | 3640 |
| New Jersey | 58774 | 63142 | 7.43 | 4368 |
| West Virginia | 46597 | 50051 | 7.41 | 3454 |
| Illinois | 56192 | 60333 | 7.37 | 4141 |
| Rhode Island | 52109 | 55878 | 7.23 | 3769 |
| Georgia | 49762 | 52952 | 6.41 | 3190 |
| Alaska | 56834 | 60272 | 6.05 | 3438 |
| Pennsylvania | 55458 | 58620 | 5.7 | 3162 |
| Delaware | 52671 | 55185 | 4.77 | 2514 |
High-income states were not always the fastest growers

View exact chart values
| state | real_pcpi_2019 | real_pcpi_2024 | chg_pct | chg_dollars |
|---|---|---|---|---|
| South Dakota | 57354 | 69153 | 20.57 | 11799 |
| Wyoming | 63616 | 75501 | 18.68 | 11885 |
| Nebraska | 55976 | 65297 | 16.65 | 9321 |
| Montana | 50997 | 59203 | 16.09 | 8206 |
| Utah | 47937 | 55116 | 14.98 | 7179 |
| Iowa | 52372 | 60144 | 14.84 | 7772 |
| Arkansas | 48246 | 55219 | 14.45 | 6973 |
| Missouri | 50660 | 57850 | 14.19 | 7190 |
| Oregon | 48660 | 55451 | 13.96 | 6791 |
| Louisiana | 49920 | 56789 | 13.76 | 6869 |
| New Mexico | 45000 | 51121 | 13.6 | 6121 |
| Maine | 50601 | 57480 | 13.59 | 6879 |
| Washington | 56862 | 64421 | 13.29 | 7559 |
| Tennessee | 51865 | 58582 | 12.95 | 6717 |
| Colorado | 57869 | 65223 | 12.71 | 7354 |
| California | 55931 | 63028 | 12.69 | 7097 |
| Oklahoma | 52199 | 58692 | 12.44 | 6493 |
| Arizona | 47236 | 52890 | 11.97 | 5654 |
| Hawaii | 46712 | 52272 | 11.9 | 5560 |
| Vermont | 52744 | 58893 | 11.66 | 6149 |
| Kentucky | 46956 | 52290 | 11.36 | 5334 |
| Texas | 52343 | 58219 | 11.23 | 5876 |
| Nevada | 50866 | 56503 | 11.08 | 5637 |
| North Dakota | 58846 | 65271 | 10.92 | 6425 |
| Alabama | 47130 | 52216 | 10.79 | 5086 |
| Mississippi | 43785 | 48465 | 10.69 | 4680 |
| North Carolina | 50966 | 56310 | 10.49 | 5344 |
| Indiana | 50329 | 55562 | 10.4 | 5233 |
| Idaho | 48040 | 52816 | 9.94 | 4776 |
| Ohio | 51249 | 56232 | 9.72 | 4983 |
| Virginia | 56459 | 61914 | 9.66 | 5455 |
| Florida | 52128 | 57131 | 9.6 | 5003 |
| Massachusetts | 65383 | 71629 | 9.55 | 6246 |
| Minnesota | 56749 | 62039 | 9.32 | 5290 |
| New York | 58786 | 64153 | 9.13 | 5367 |
| Kansas | 54437 | 59172 | 8.7 | 4735 |
| Michigan | 49306 | 53569 | 8.65 | 4263 |
| Wisconsin | 53652 | 58273 | 8.61 | 4621 |
| New Hampshire | 59512 | 64632 | 8.6 | 5120 |
| Maryland | 56850 | 61111 | 7.5 | 4261 |
| Connecticut | 69091 | 74254 | 7.47 | 5163 |
| South Carolina | 48823 | 52463 | 7.46 | 3640 |
| New Jersey | 58774 | 63142 | 7.43 | 4368 |
| West Virginia | 46597 | 50051 | 7.41 | 3454 |
| Illinois | 56192 | 60333 | 7.37 | 4141 |
| Rhode Island | 52109 | 55878 | 7.23 | 3769 |
| Georgia | 49762 | 52952 | 6.41 | 3190 |
| Alaska | 56834 | 60272 | 6.05 | 3438 |
| Pennsylvania | 55458 | 58620 | 5.7 | 3162 |
| Delaware | 52671 | 55185 | 4.77 | 2514 |
What the books refuse to answer
These figures cannot tell you whether a particular family can forecast next year, and they should not be used that way. The Survey of Consumer Finances asks families a forward-looking question. BEA adds up income that has already been paid. The wage share is not take-home pay. Transfers include medical benefits that never hit a checking account as cash. Dividends, interest and rent are concentrated. Real per capita income is not a median. The quarterly numbers are seasonally adjusted annual rates from a September 30, 2026 BEA release; the real series is annual through 2024. Provider lag is normal. None of this is a current-week observation.
What the books do answer is narrower, and still useful with sixteen days to an election that is being fought on affordability. American personal income in mid-2026 was not a transfer-state leftover from the pandemic. It was a $27 trillion annual-rate flow in which wages were still about half, asset income had become the second-largest of the big slices, and transfers had settled above their 2019 share without returning to 2020. Inflation-adjusted income through 2024 was higher than before the pandemic and lower than the 2021 peak. Some states, especially in the Plains, gained far more than others. Several of the states that will decide Congress gained less.
If families say they cannot see next year, the accounts suggest a reason that is not "the paycheck vanished." The paycheck is still the largest line. It is a smaller slice of a pie that now leans more on assets whose returns most workers do not set, and on transfers whose rules Congress can change. That is a planning problem. It is also, as of these books, a distribution problem. It is not, through 2024, an income collapse.
Sources and methods
Quarterly U.S. personal income and its major components are seasonally adjusted annual rates from BEA table SQINC4 (wages and salaries; personal current transfer receipts; dividends, interest, and rent; proprietors' income) and per capita personal income from SQINC1, United States geography, 2005 Q1 through 2026 Q2. The underlying snapshot is BEA's September 30, 2026 regional release. Component shares are calculated as each series divided by personal income and do not sum to 100 percent because of supplements to wages and salaries, contributions for government social insurance, and the residence adjustment. Wages are measured before deductions.
Real per capita personal income is BEA's annual SARPI series in constant 2017 dollars, using regional price parities, United States and the 50 states, 2019 and 2024 (U.S. history shown 2008-2024). The District of Columbia is omitted from state rankings. Percent changes are 2024 divided by 2019, minus one. Missing values are not treated as zero. These are per capita aggregates, not medians or household incomes, and they are not the Survey of Consumer Finances. Observation dates are not release dates. The real series cannot speak to 2025-2026 prices. No causal claims are drawn from state rankings or from the coincidence of survey uncertainty and income shares.
Research completed 2026-10-19, for the October 18, 2026 news edition. The available source data may cover earlier periods; see the observation periods and source vintages above.