Research
The MNSure hike lands on a hospital bill that already outran the pump
The rate letter is not the whole bill
Minnesota families shopping MNSure were told this week that individual-market rates could rise 9% to 21% in January, touching more than 200,000 people, with small-group plans in a similar 10% to 21% band. Economist Jen Schultz noted the uninsured share has already climbed from 3.5% to 5.8%. That is a real pocketbook shock for people who buy coverage on their own. It is not, however, a description of what Minnesota households already spend on medical care.
The official household books run through calendar 2025, a year before those new rates take effect, and they draw a sharper line than a premium notice. Bureau of Economic Analysis personal consumption figures put Minnesota's per-person spending on health-care services — outpatient care plus hospitals and nursing homes, not premiums and not drugs — at $11,400 in 2025, up from $6,384 in 2010. That is 18.7% of all personal consumption in the state. Groceries bought for home were $3,883 per person. Gasoline and other energy goods were $1,383. The clinic, in other words, still outspends the cart and the pump.
A 9% to 21% jump on one slice of the market will hurt the households who get that letter. It does not rewrite the larger ledger. Care is the fat line. Insurance, as BEA records it, is not.
Hospitals first, then doctors, then drugs
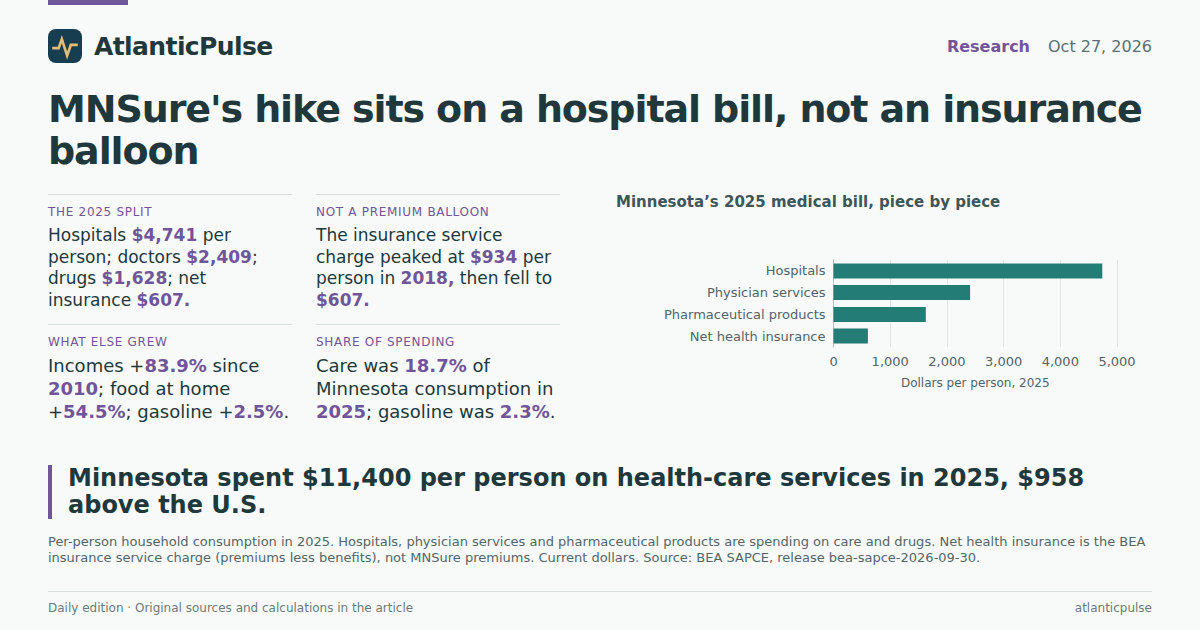
Unpack 2025 and the ranking is blunt. Minnesota households consumed $4,741 per person on hospitals, $2,409 on physician services and $1,628 on pharmaceutical products. Net health insurance — a BEA line that is premiums less benefits, the insurer's service charge, not the MNSure sticker — was $607 per person. Hospitals alone were nearly eight times that insurance slice.
Those are not household averages. They are statewide consumption divided by the midyear resident population, about 5.83 million people in 2025. A family of four does not automatically spend four times $11,400, and a MNSure shopper's premium is not $607. The comparison is still useful: the medical economy Minnesota already pays for is mostly buildings, clinicians and pills. The insurance intermediation line is the thin one.
That composition is why a January rate letter can feel enormous without being the largest medical bill on the state's books. Premiums are how many people meet the hospital. The hospital is where the dollars sit.
Minnesota’s 2025 medical bill, piece by piece

View exact chart values
| category | millions | per_capita |
|---|---|---|
| Hospitals | 27644.4 | 4741.4 |
| Physician services | 14042.7 | 2408.5 |
| Pharmaceutical products | 9489.8 | 1627.6 |
| Net health insurance | 3537.5 | 606.7 |
Minnesota’s hospital-and-doctor bill per person, 2010–2025

View exact chart values
| year | mn_ins_pc | us_ins_pc | mn_hc_pc | us_hc_pc | mn_income_pc | mn_food_pc | mn_gas_pc | mn_pce_pc | mn_ins_index | us_ins_index | mn_hc_index | mn_food_index | mn_gas_index | mn_income_index | mn_pce_index | mn_ins_millions | mn_hosp_millions | mn_pharma_millions | mn_phys_millions | mn_pop |
|---|---|---|---|---|---|---|---|---|---|---|---|---|---|---|---|---|---|---|---|---|
| 2010 | 520.8 | 462.3 | 6384 | 5493 | 42530 | 2513 | 1349 | 36024 | 100 | 100 | 100 | 100 | 100 | 100 | 100 | 2766.5 | 13922.2 | 5115.4 | 8192.2 | 5312197 |
| 2011 | 573.6 | 491.6 | 6534 | 5635 | 45118 | 2619 | 1670 | 37337 | 110.2 | 106.3 | 102.3 | 104.2 | 123.8 | 106.1 | 103.6 | 3070.7 | 14791.4 | 5324.7 | 8209.8 | 5352946 |
| 2012 | 545.7 | 463.9 | 6657 | 5794 | 47385 | 2715 | 1664 | 38165 | 104.8 | 100.4 | 104.3 | 108 | 123.4 | 111.4 | 105.9 | 2940.9 | 15126.7 | 5318 | 8449.5 | 5388902 |
| 2013 | 588.2 | 486.5 | 6856 | 5884 | 47399 | 2719 | 1616 | 39023 | 112.9 | 105.2 | 107.4 | 108.2 | 119.8 | 111.4 | 108.3 | 3194.5 | 16121.8 | 5316.4 | 8387.1 | 5431187 |
| 2014 | 700.6 | 554.5 | 7104 | 6094 | 49330 | 2707 | 1551 | 40100 | 134.5 | 120 | 111.3 | 107.7 | 115 | 116 | 111.3 | 3835 | 17016.5 | 5556.9 | 8529.5 | 5474193 |
| 2015 | 739.4 | 581.5 | 7361 | 6400 | 51336 | 2732 | 1183 | 41010 | 142 | 125.8 | 115.3 | 108.7 | 87.7 | 120.7 | 113.8 | 4074.7 | 17744.6 | 5754.1 | 8942.1 | 5510593 |
| 2016 | 777.8 | 617.1 | 7728 | 6674 | 51966 | 2803 | 1051 | 42020 | 149.4 | 133.5 | 121.1 | 111.5 | 77.9 | 122.2 | 116.6 | 4322.3 | 18834.1 | 5717.7 | 9439.5 | 5557028 |
| 2017 | 821.5 | 658.9 | 7862 | 6875 | 53812 | 2887 | 1161 | 43519 | 157.7 | 142.5 | 123.2 | 114.9 | 86.1 | 126.5 | 120.8 | 4605.3 | 19153.9 | 5716.9 | 9833.1 | 5606013 |
| 2018 | 933.5 | 757.7 | 8257 | 7137 | 56186 | 2978 | 1290 | 45228 | 179.3 | 163.9 | 129.3 | 118.5 | 95.6 | 132.1 | 125.5 | 5275 | 20449.2 | 6019.2 | 10405.4 | 5650556 |
| 2019 | 800.4 | 702.5 | 8407 | 7487 | 57889 | 3028 | 1230 | 45930 | 153.7 | 152 | 131.7 | 120.5 | 91.2 | 136.1 | 127.5 | 4551.8 | 20592.5 | 6316.5 | 10679.4 | 5686910 |
| 2020 | 760.3 | 720 | 7758 | 7100 | 61358 | 3281 | 923 | 43700 | 146 | 155.7 | 121.5 | 130.6 | 68.4 | 144.3 | 121.3 | 4341.6 | 18888.3 | 6649 | 9904.4 | 5710562 |
| 2021 | 717.4 | 737 | 8691 | 7956 | 67743 | 3473 | 1335 | 48961 | 137.8 | 159.4 | 136.1 | 138.2 | 99 | 159.3 | 135.9 | 4099.5 | 21698.1 | 6754.8 | 10949 | 5714055 |
| 2022 | 671.1 | 748 | 9092 | 8438 | 69471 | 3664 | 1737 | 53362 | 128.9 | 161.8 | 142.4 | 145.8 | 128.8 | 163.3 | 148.1 | 3843.9 | 22439.2 | 7397.3 | 11500.9 | 5727565 |
| 2023 | 637.8 | 762.4 | 9837 | 9098 | 72565 | 3701 | 1562 | 55748 | 122.5 | 164.9 | 154.1 | 147.3 | 115.8 | 170.6 | 154.8 | 3669.1 | 24140.6 | 8336.5 | 12357.8 | 5752998 |
| 2024 | 618.4 | 795 | 10574 | 9786 | 75040 | 3759 | 1483 | 58243 | 118.7 | 172 | 165.6 | 149.6 | 109.9 | 176.4 | 161.7 | 3585.1 | 25490.4 | 8804.1 | 13205.8 | 5797405 |
| 2025 | 606.7 | 830.4 | 11400 | 10442 | 78197 | 3883 | 1383 | 61104 | 116.5 | 179.6 | 178.6 | 154.5 | 102.5 | 183.9 | 169.6 | 3537.5 | 27644.4 | 9489.8 | 14042.7 | 5830405 |
Minnesota spends more on care than America. It spends less on the insurance slice.
Minnesota is not a cheap-care state that suddenly got expensive insurance. In 2025 it spent $958 more per person on health-care services than the United States as a whole — $11,400 against $10,442. That gap is old. In 2010 the figures were $6,384 and $5,493. Both rose; Minnesota stayed above the national line every year in the series.
The insurance service charge went the other way. Minnesota's per-person net health insurance was $521 in 2010 and $607 in 2025, a 16.5% rise. The U.S. average went from $462 to $830, up 79.6%. Minnesota ran above the national insurance line through 2020, peaked at $934 per person in 2018, then fell beneath the U.S. average after 2021. By 2025 it was $224 per person below the country.
Among neighboring states, that 2025 insurance line was $1,159 per person in North Dakota, $777 in Wisconsin, $711 in South Dakota, $607 in Minnesota, $369 in Illinois and $358 in Iowa. Those numbers are not proof that Iowa has cheap MNSure cousins or that North Dakota has a premium crisis. They are the BEA service charge. What they do show is that Minnesota is not an outlier because its insurance intermediation ballooned. It is an outlier because its hospital-and-doctor consumption did.
Minnesota’s insurance service charge peaked, then fell below the U.S.

View exact chart values
| year | mn_ins_pc | us_ins_pc | mn_hc_pc | us_hc_pc | mn_income_pc | mn_food_pc | mn_gas_pc | mn_pce_pc | mn_ins_index | us_ins_index | mn_hc_index | mn_food_index | mn_gas_index | mn_income_index | mn_pce_index | mn_ins_millions | mn_hosp_millions | mn_pharma_millions | mn_phys_millions | mn_pop |
|---|---|---|---|---|---|---|---|---|---|---|---|---|---|---|---|---|---|---|---|---|
| 2010 | 520.8 | 462.3 | 6384 | 5493 | 42530 | 2513 | 1349 | 36024 | 100 | 100 | 100 | 100 | 100 | 100 | 100 | 2766.5 | 13922.2 | 5115.4 | 8192.2 | 5312197 |
| 2011 | 573.6 | 491.6 | 6534 | 5635 | 45118 | 2619 | 1670 | 37337 | 110.2 | 106.3 | 102.3 | 104.2 | 123.8 | 106.1 | 103.6 | 3070.7 | 14791.4 | 5324.7 | 8209.8 | 5352946 |
| 2012 | 545.7 | 463.9 | 6657 | 5794 | 47385 | 2715 | 1664 | 38165 | 104.8 | 100.4 | 104.3 | 108 | 123.4 | 111.4 | 105.9 | 2940.9 | 15126.7 | 5318 | 8449.5 | 5388902 |
| 2013 | 588.2 | 486.5 | 6856 | 5884 | 47399 | 2719 | 1616 | 39023 | 112.9 | 105.2 | 107.4 | 108.2 | 119.8 | 111.4 | 108.3 | 3194.5 | 16121.8 | 5316.4 | 8387.1 | 5431187 |
| 2014 | 700.6 | 554.5 | 7104 | 6094 | 49330 | 2707 | 1551 | 40100 | 134.5 | 120 | 111.3 | 107.7 | 115 | 116 | 111.3 | 3835 | 17016.5 | 5556.9 | 8529.5 | 5474193 |
| 2015 | 739.4 | 581.5 | 7361 | 6400 | 51336 | 2732 | 1183 | 41010 | 142 | 125.8 | 115.3 | 108.7 | 87.7 | 120.7 | 113.8 | 4074.7 | 17744.6 | 5754.1 | 8942.1 | 5510593 |
| 2016 | 777.8 | 617.1 | 7728 | 6674 | 51966 | 2803 | 1051 | 42020 | 149.4 | 133.5 | 121.1 | 111.5 | 77.9 | 122.2 | 116.6 | 4322.3 | 18834.1 | 5717.7 | 9439.5 | 5557028 |
| 2017 | 821.5 | 658.9 | 7862 | 6875 | 53812 | 2887 | 1161 | 43519 | 157.7 | 142.5 | 123.2 | 114.9 | 86.1 | 126.5 | 120.8 | 4605.3 | 19153.9 | 5716.9 | 9833.1 | 5606013 |
| 2018 | 933.5 | 757.7 | 8257 | 7137 | 56186 | 2978 | 1290 | 45228 | 179.3 | 163.9 | 129.3 | 118.5 | 95.6 | 132.1 | 125.5 | 5275 | 20449.2 | 6019.2 | 10405.4 | 5650556 |
| 2019 | 800.4 | 702.5 | 8407 | 7487 | 57889 | 3028 | 1230 | 45930 | 153.7 | 152 | 131.7 | 120.5 | 91.2 | 136.1 | 127.5 | 4551.8 | 20592.5 | 6316.5 | 10679.4 | 5686910 |
| 2020 | 760.3 | 720 | 7758 | 7100 | 61358 | 3281 | 923 | 43700 | 146 | 155.7 | 121.5 | 130.6 | 68.4 | 144.3 | 121.3 | 4341.6 | 18888.3 | 6649 | 9904.4 | 5710562 |
| 2021 | 717.4 | 737 | 8691 | 7956 | 67743 | 3473 | 1335 | 48961 | 137.8 | 159.4 | 136.1 | 138.2 | 99 | 159.3 | 135.9 | 4099.5 | 21698.1 | 6754.8 | 10949 | 5714055 |
| 2022 | 671.1 | 748 | 9092 | 8438 | 69471 | 3664 | 1737 | 53362 | 128.9 | 161.8 | 142.4 | 145.8 | 128.8 | 163.3 | 148.1 | 3843.9 | 22439.2 | 7397.3 | 11500.9 | 5727565 |
| 2023 | 637.8 | 762.4 | 9837 | 9098 | 72565 | 3701 | 1562 | 55748 | 122.5 | 164.9 | 154.1 | 147.3 | 115.8 | 170.6 | 154.8 | 3669.1 | 24140.6 | 8336.5 | 12357.8 | 5752998 |
| 2024 | 618.4 | 795 | 10574 | 9786 | 75040 | 3759 | 1483 | 58243 | 118.7 | 172 | 165.6 | 149.6 | 109.9 | 176.4 | 161.7 | 3585.1 | 25490.4 | 8804.1 | 13205.8 | 5797405 |
| 2025 | 606.7 | 830.4 | 11400 | 10442 | 78197 | 3883 | 1383 | 61104 | 116.5 | 179.6 | 178.6 | 154.5 | 102.5 | 183.9 | 169.6 | 3537.5 | 27644.4 | 9489.8 | 14042.7 | 5830405 |
The insurance line is smaller in Minnesota than in several neighbors

View exact chart values
| state | ins_pc | ins_millions | population |
|---|---|---|---|
| North Dakota | 1159.3 | 926.7 | 799358 |
| United States | 830.4 | 283828.2 | 341784857 |
| Wisconsin | 777.1 | 4641.2 | 5972787 |
| South Dakota | 711.3 | 665.1 | 935094 |
| Minnesota | 606.7 | 3537.5 | 5830405 |
| Illinois | 369.2 | 4695.6 | 12719141 |
| Iowa | 358.1 | 1159.8 | 3238387 |
Incomes rose. Care rose with them. Gasoline did not.
Since 2010, Minnesota per capita personal income has risen 83.9%, to $78,197. Health-care services rose 78.6%. Total personal consumption rose 69.6%. Food and beverages bought for home rose 54.5%. Gasoline and other energy goods rose 2.5%. Net health insurance rose 16.5% and is now below its 2018 peak.
Indexed to 2010, care and income travel together. Food is slower. The pump is a flat line with a 2022 bump. The insurance service charge is the one that climbed, then gave the gains back. None of that is inflation-adjusted, so some of the rise is prices rather than more visits. The ranking still holds in current dollars, which is how rent, premiums and grocery receipts arrive.
Put the 2025 shares next to each other and the political weather makes more sense. Health-care services were 18.7% of Minnesota consumption. Food at home was 6.4%. Gasoline was 2.3%. Net health insurance was 1.0% of consumption and 0.8% of personal income. A campaign that talks only about $4 gasoline is arguing over the small print of a medical invoice.
What grew faster in Minnesota: care, food, gasoline or income?

View exact chart values
| year | mn_ins_pc | us_ins_pc | mn_hc_pc | us_hc_pc | mn_income_pc | mn_food_pc | mn_gas_pc | mn_pce_pc | mn_ins_index | us_ins_index | mn_hc_index | mn_food_index | mn_gas_index | mn_income_index | mn_pce_index | mn_ins_millions | mn_hosp_millions | mn_pharma_millions | mn_phys_millions | mn_pop |
|---|---|---|---|---|---|---|---|---|---|---|---|---|---|---|---|---|---|---|---|---|
| 2010 | 520.8 | 462.3 | 6384 | 5493 | 42530 | 2513 | 1349 | 36024 | 100 | 100 | 100 | 100 | 100 | 100 | 100 | 2766.5 | 13922.2 | 5115.4 | 8192.2 | 5312197 |
| 2011 | 573.6 | 491.6 | 6534 | 5635 | 45118 | 2619 | 1670 | 37337 | 110.2 | 106.3 | 102.3 | 104.2 | 123.8 | 106.1 | 103.6 | 3070.7 | 14791.4 | 5324.7 | 8209.8 | 5352946 |
| 2012 | 545.7 | 463.9 | 6657 | 5794 | 47385 | 2715 | 1664 | 38165 | 104.8 | 100.4 | 104.3 | 108 | 123.4 | 111.4 | 105.9 | 2940.9 | 15126.7 | 5318 | 8449.5 | 5388902 |
| 2013 | 588.2 | 486.5 | 6856 | 5884 | 47399 | 2719 | 1616 | 39023 | 112.9 | 105.2 | 107.4 | 108.2 | 119.8 | 111.4 | 108.3 | 3194.5 | 16121.8 | 5316.4 | 8387.1 | 5431187 |
| 2014 | 700.6 | 554.5 | 7104 | 6094 | 49330 | 2707 | 1551 | 40100 | 134.5 | 120 | 111.3 | 107.7 | 115 | 116 | 111.3 | 3835 | 17016.5 | 5556.9 | 8529.5 | 5474193 |
| 2015 | 739.4 | 581.5 | 7361 | 6400 | 51336 | 2732 | 1183 | 41010 | 142 | 125.8 | 115.3 | 108.7 | 87.7 | 120.7 | 113.8 | 4074.7 | 17744.6 | 5754.1 | 8942.1 | 5510593 |
| 2016 | 777.8 | 617.1 | 7728 | 6674 | 51966 | 2803 | 1051 | 42020 | 149.4 | 133.5 | 121.1 | 111.5 | 77.9 | 122.2 | 116.6 | 4322.3 | 18834.1 | 5717.7 | 9439.5 | 5557028 |
| 2017 | 821.5 | 658.9 | 7862 | 6875 | 53812 | 2887 | 1161 | 43519 | 157.7 | 142.5 | 123.2 | 114.9 | 86.1 | 126.5 | 120.8 | 4605.3 | 19153.9 | 5716.9 | 9833.1 | 5606013 |
| 2018 | 933.5 | 757.7 | 8257 | 7137 | 56186 | 2978 | 1290 | 45228 | 179.3 | 163.9 | 129.3 | 118.5 | 95.6 | 132.1 | 125.5 | 5275 | 20449.2 | 6019.2 | 10405.4 | 5650556 |
| 2019 | 800.4 | 702.5 | 8407 | 7487 | 57889 | 3028 | 1230 | 45930 | 153.7 | 152 | 131.7 | 120.5 | 91.2 | 136.1 | 127.5 | 4551.8 | 20592.5 | 6316.5 | 10679.4 | 5686910 |
| 2020 | 760.3 | 720 | 7758 | 7100 | 61358 | 3281 | 923 | 43700 | 146 | 155.7 | 121.5 | 130.6 | 68.4 | 144.3 | 121.3 | 4341.6 | 18888.3 | 6649 | 9904.4 | 5710562 |
| 2021 | 717.4 | 737 | 8691 | 7956 | 67743 | 3473 | 1335 | 48961 | 137.8 | 159.4 | 136.1 | 138.2 | 99 | 159.3 | 135.9 | 4099.5 | 21698.1 | 6754.8 | 10949 | 5714055 |
| 2022 | 671.1 | 748 | 9092 | 8438 | 69471 | 3664 | 1737 | 53362 | 128.9 | 161.8 | 142.4 | 145.8 | 128.8 | 163.3 | 148.1 | 3843.9 | 22439.2 | 7397.3 | 11500.9 | 5727565 |
| 2023 | 637.8 | 762.4 | 9837 | 9098 | 72565 | 3701 | 1562 | 55748 | 122.5 | 164.9 | 154.1 | 147.3 | 115.8 | 170.6 | 154.8 | 3669.1 | 24140.6 | 8336.5 | 12357.8 | 5752998 |
| 2024 | 618.4 | 795 | 10574 | 9786 | 75040 | 3759 | 1483 | 58243 | 118.7 | 172 | 165.6 | 149.6 | 109.9 | 176.4 | 161.7 | 3585.1 | 25490.4 | 8804.1 | 13205.8 | 5797405 |
| 2025 | 606.7 | 830.4 | 11400 | 10442 | 78197 | 3883 | 1383 | 61104 | 116.5 | 179.6 | 178.6 | 154.5 | 102.5 | 183.9 | 169.6 | 3537.5 | 27644.4 | 9489.8 | 14042.7 | 5830405 |
What January can change, and what it cannot
The 200,000-plus people on Minnesota's individual market are a real group, and a 9% to 21% rate increase is a real hit for anyone who does not get a bigger tax credit. Small-group rates in the same band will land on employers and workers who buy there. Uninsured rates that have already nearly doubled will not fall if coverage gets more expensive. Those facts come from the state's own notice, not from BEA.
What the 2025 books cannot do is score that January letter. Calendar-year consumption ends a full year earlier. Net health insurance is not a premium. Per-person figures are not household premiums, and they mix Medicare, Medicaid, job-based coverage and the individual market. A decline in the insurance service charge after 2018 can mean more benefits paid relative to premiums, a shift in who is insured, or both. It is not evidence that MNSure got cheaper.
The reader payoff is narrower, and more useful. Minnesota already runs an expensive care system by national standards. Hospitals, physicians and drugs dwarf the insurance line. Incomes have more than kept up with that care bill in current dollars; groceries have not grown as fast; gasoline has barely grown at all. If January's rate shock feels like the medical system getting worse, the official ledger says the expensive part was already the hospital — and it had been getting more expensive for 15 years.
Sources and methods
This brief uses annual BEA state personal consumption expenditures (SAPCE) through calendar 2025 from the bea-sapce-2026-09-30 release, pinned in an AtlanticPulse snapshot dated 2026-10-07, and BEA SAINC midyear resident population and per capita personal income from the bea-regional-state-annual-2026-09-30 release. Observation years are not release dates and are not current-day readings.
Health-care services are BEA per capita PCE for outpatient, hospital and nursing-home services. They exclude health insurance and pharmaceutical products. Net health insurance is BEA household consumption of net health insurance (premiums less benefits), a service charge, not the premium a MNSure or employer-plan enrollee pays and not a household average. Pharmaceutical products, hospitals and physician services are separate current-dollar PCE lines.
Per-person insurance figures divide millions of current dollars by BEA midyear resident population. Missing values were not treated as zero. Neighbor comparisons are descriptive, not causal, and are limited to Minnesota, Wisconsin, Iowa, North Dakota, South Dakota, Illinois and the United States. Individual-market rate ranges and uninsured shares are from the October 27, 2026, reporting and are not in the BEA extracts. A January 2027 premium change cannot be read in 2025 consumption.
Research completed 2026-10-28, for the October 27, 2026 news edition. The available source data may cover earlier periods; see the observation periods and source vintages above.