Research
The Midwest discount, priced and tested
The spreadsheet movers actually run
A story in today's basket argues that for the first time this decade, more Americans moved into the Midwest than moved out of it — a Census-based swing from a net loss of roughly 491,000 domestic migrants between 2021 and 2024 to a net gain of about 16,000 as of June 2025. The usual explanation is the one any renter or buyer can recite: the Midwest is cheap. That claim deserves the same treatment as any other number in a campaign season. Is the region actually cheap on the government's own books, or just cheap relative to the coasts people talk about? Does the cheapness come with higher real incomes, or lower ones? Are people demonstrably moving? And if a family follows the math, are there jobs waiting?
We pulled four official ledgers: the Bureau of Economic Analysis's regional price parities (a state-by-state price-level index where 100 is the U.S. average), BEA's real per capita personal income in constant 2017 dollars, BEA's midyear population estimates, and seasonally adjusted state payrolls from the Bureau of Labor Statistics. Together they let us price the discount, test it against incomes, watch the moving vans, and check the help-wanted column. The short version: the discount is real, it is mostly housing, it does not come with richer incomes, and the people are already voting with their trucks — even as the region's job growth badly trails the places they are leaving.
The discount is official — and it lives in housing
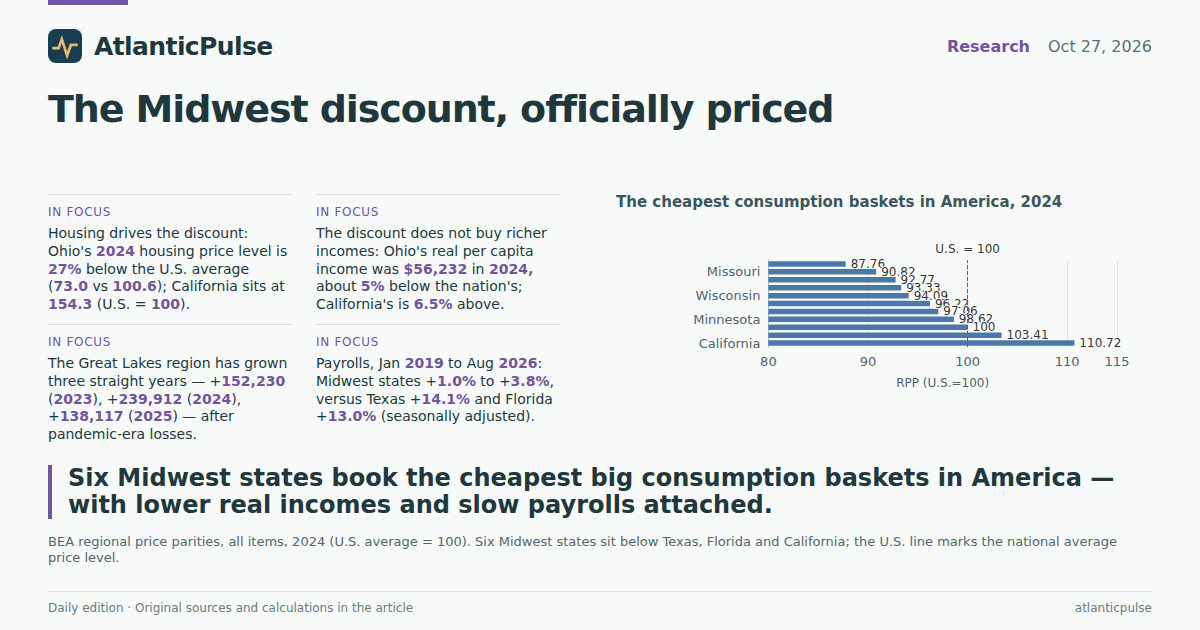
BEA's 2024 regional price parities put every large Midwest state well below the national average price level. Iowa is the cheapest basket in this comparison at 87.8, followed by Missouri (90.8), Ohio (92.8), Indiana (93.3), Wisconsin (94.1) and Michigan (96.2). For scale: Texas sits at 97.1, Minnesota at 98.6, the United States at 100, Florida at 103.4 and California at 110.7. A dollar of the standard consumption basket costs about 7 percent less in Ohio than in the average American state, and 20 percent less than in California (BEA).
Almost all of that gap is roof-shaped. The housing-services price index runs from Iowa's 65.3 and Missouri's 69.9 through Ohio's 73.0 and Indiana's 73.9 — roughly a quarter below the U.S. level of 100.6 — down to Florida at 122.1 and California at 154.3. An Ohioan faces housing-services prices about 53 percent below California's. These are price levels, not forecasts or anecdotes: they are the official adjustments BEA uses to say what the same consumption actually costs in different states. The Midwest's reputation for cheapness is not a vibe. It is a published index, and housing is where it concentrates.
The cheapest consumption baskets in America, 2024

View exact chart values
| state | rpp_all_2024 |
|---|---|
| Iowa | 87.76 |
| Missouri | 90.82 |
| Ohio | 92.77 |
| Indiana | 93.33 |
| Wisconsin | 94.09 |
| Michigan | 96.22 |
| Texas | 97.06 |
| Minnesota | 98.62 |
| United States | 100 |
| Florida | 103.41 |
| California | 110.72 |
Housing is where the discount lives

View exact chart values
| state | housing_rpp_2024 |
|---|---|
| Iowa | 65.32 |
| Missouri | 69.88 |
| Ohio | 73.01 |
| Indiana | 73.93 |
| Wisconsin | 79.31 |
| Michigan | 82.33 |
| Minnesota | 91.28 |
| Illinois | 93.94 |
| Texas | 96.5 |
| United States | 100.63 |
| Florida | 122.11 |
| California | 154.35 |
Cheap is not the same as rich
Here is the asterisk the Midwest cheerleaders skip. BEA's real per capita personal income — nominal income deflated by each state's own price level, in constant 2017 dollars — was $56,232 in Ohio in 2024, about 5 percent below the national figure; Michigan's was $53,569, 9.5 percent below. California's real income is 6.5 percent above the U.S. level, even after its famous prices are counted. In other words, the discount does not make Midwesterners richer than the average American; it makes a below-average income livable.
And the growth paths are close, not favorable. From 2008 to 2024, real per capita income rose 29.2 percent nationally. Ohio managed 26.5 percent, Michigan 27.7, Indiana 29.0, Illinois 24.7 and Wisconsin 24.5 — solidly, unremarkably on the national trend. California, starting higher, added 43.9 percent. If your spreadsheet hopes the Midwest is a place where cheapness plus booming incomes equals California, the official answer is no: the trade is a smaller real income exchanged at a much lower price level. For a household priced out of a coastal housing market, that can still be a good trade. But it should be made with the actual terms on the table.
The Midwest's real incomes grew with America — from a lower base

View exact chart values
| year | Ohio | Michigan | Indiana | Wisconsin | Illinois | United States | California |
|---|---|---|---|---|---|---|---|
| 2008 | 100 | 100 | 100 | 100 | 100 | 100 | 100 |
| 2009 | 96.4 | 95.7 | 96.6 | 97.5 | 94.1 | 96.5 | 96.8 |
| 2010 | 97.8 | 97.7 | 98.3 | 97.4 | 94.6 | 97.8 | 99.3 |
| 2011 | 102.5 | 101.8 | 102.2 | 101 | 96.4 | 100.3 | 102.4 |
| 2012 | 103.2 | 103.8 | 103.8 | 102.3 | 99.6 | 102.1 | 105.4 |
| 2013 | 102.7 | 102.9 | 103.1 | 101.5 | 100.8 | 101.2 | 104.7 |
| 2014 | 105.4 | 105.1 | 105.3 | 103.7 | 103.7 | 104 | 108.4 |
| 2015 | 110 | 112.6 | 110.2 | 108.3 | 109.1 | 107.8 | 114.3 |
| 2016 | 110.7 | 114.4 | 111.8 | 108.9 | 108.8 | 108.8 | 118.3 |
| 2017 | 113.1 | 116.6 | 114.2 | 110.6 | 109.6 | 111.3 | 120.1 |
| 2018 | 113.6 | 116.6 | 114.4 | 112.7 | 113.4 | 114 | 122.2 |
| 2019 | 115.3 | 117.5 | 116.9 | 114.6 | 116.2 | 117.2 | 127.7 |
| 2020 | 123.9 | 127.7 | 125.5 | 122.6 | 121.6 | 123.3 | 137 |
| 2021 | 129 | 132.7 | 132.4 | 127.8 | 125.4 | 129.6 | 144.7 |
| 2022 | 123.4 | 127.4 | 127.9 | 123.3 | 119.9 | 124.6 | 135 |
| 2023 | 125.5 | 128.5 | 128.6 | 123.4 | 124.7 | 126.8 | 137.3 |
| 2024 | 126.5 | 127.7 | 129 | 124.5 | 124.7 | 129.2 | 143.9 |
The jobs asterisk
A family that moves needs a payroll to land on. The Midwest has one — it is just growing slowly. Between January 2019 and August 2026, seasonally adjusted total nonfarm employment rose 1.9 percent in Ohio, 1.3 percent in Michigan and 1.0 percent in Illinois — roughly one to two percent over seven and a half years. The region's stronger performers, Missouri (+3.8), Minnesota (+3.2) and Indiana (+3.2), still trail California (+5.0) and are nowhere near Florida (+13.0) or Texas (+14.1) over the same stretch (BLS).
Read that as a description, not a forecast: jobs exist in the Midwest, and the region is not shedding them. But the hiring engine that pulled the Sun Belt through the same period ran much harder there. The Midwest's pitch to a mover is therefore not 'follow the jobs.' It is 'take a somewhat smaller income, pay far less for housing, and accept that the local labor market will grow more slowly than the one you left.' The 2025 migration data suggest a growing number of households find that trade acceptable. The payrolls explain why employers, on net, have not led the way.
The jobs asterisk on the Midwest discount

View exact chart values
| state | emp_jan2019_k | emp_aug2026_k | pct_change |
|---|---|---|---|
| Ohio | 5585.3 | 5688.7 | 1.9 |
| Indiana | 3164.8 | 3266.5 | 3.2 |
| Michigan | 4438.1 | 4496.1 | 1.3 |
| Wisconsin | 2989.3 | 3057.3 | 2.3 |
| Minnesota | 2974 | 3068.6 | 3.2 |
| Missouri | 2906.2 | 3015.7 | 3.8 |
| Illinois | 6112.8 | 6175.6 | 1 |
| California | 17319.7 | 18177.2 | 5 |
| Texas | 12681 | 14469.3 | 14.1 |
| Florida | 8896.2 | 10051.6 | 13 |
The U-Hauls already voted
The moving is not hypothetical anymore; it is in the population counts. BEA's midyear estimates show the Great Lakes region losing 150,327 people in 2021 and another 40,114 in 2022, then flipping to gains of 152,230 in 2023, 239,912 in 2024 and 138,117 in 2025 — three straight years of growth, at +0.29 percent in 2025. Ohio added 39,889 residents in 2025 (+0.34 percent). Even Illinois, which shed 353,533 people between 2015 and 2022, has now grown three consecutive years, adding 16,108 in 2025.
Context keeps the celebration honest. The nation added 1,781,060 people in 2025 (+0.52 percent), so the Midwest is growing more slowly than the country as a whole, and vastly more slowly than Texas (+391,243, +1.25 percent) or Florida (+196,680). California, for the first time in this window, slipped slightly (−9,465). The Midwest's 2025 story is not a boom; it is a turnaround — from bleeding to holding, in the same year national growth decelerated. The today's-basket analysis focusing on net domestic migrants captures the same turn from a different angle. Two independent federal series, one conclusion: the outflow has stopped.
The Midwest is growing again

View exact chart values
| year | gl_k | oh_k | il_k |
|---|---|---|---|
| 2016 | 87.4 | 27.7 | -18.1 |
| 2017 | 97.7 | 35.6 | -22.1 |
| 2018 | 72.2 | 25.1 | -35.5 |
| 2019 | 52.4 | 25.6 | -38 |
| 2020 | -4.5 | 9.9 | -54.1 |
| 2021 | -150.3 | -37.1 | -92 |
| 2022 | -40.1 | 3.5 | -93.8 |
| 2023 | 152.2 | 43.4 | 23.8 |
| 2024 | 239.9 | 52.2 | 69.6 |
| 2025 | 138.1 | 39.9 | 16.1 |
What the gap buys, on the official books
One more way to see the discount is to look at what people actually spend on shelter and the bills under it. BEA's state consumer-spending accounts put per capita housing-and-utilities expenditure at $13,333 in California and $14,278 in Florida in 2025, against $8,937 in Ohio and $8,839 in Indiana; the U.S. average was $11,159 (BEA). The booked gap between a Californian and an Ohioan is about $4,400 per person per year. That figure mixes prices with quantities and includes imputed rents for owner-occupiers, so treat it as a size-of-the-bill comparison, not a price index — the parity indexes above are the cleaner price story.
Put the ledgers side by side and the movers' spreadsheet checks out — with the fine print attached. The Midwest really is 6 to 12 percent cheaper than the average state for a standard basket, and 27 percent cheaper on housing in Ohio's case; the people have noticed and the counts have turned; the cost is a real income about five to ten percent below the national level and payrolls that grow in single digits while Texas and Florida add at double-digit rates since 2019. That is the actual deal on the table, officially priced. Whether it is a good deal depends on what a household is leaving — but no longer on guesswork about what the Midwest costs.
What the same roof costs, on the official books

View exact chart values
| state | hu_pc_2015 | hu_pc_2025 | gap_vs_ohio_2025 |
|---|---|---|---|
| Ohio | 5744 | 8937 | 0 |
| Michigan | 6283 | 10007 | 1070 |
| Indiana | 5717 | 8839 | -98 |
| Illinois | 6686 | 10323 | 1386 |
| United States | 6824 | 11159 | 2222 |
| Texas | 6252 | 10353 | 1416 |
| Florida | 7861 | 14278 | 5341 |
| California | 7836 | 13333 | 4396 |
Sources and methods
Research uses only pinned, read-only catalogue snapshots; source vintages: BEA Regional Price Parities release bea-rpp-2026-02-19 (state data through 2024), BEA annual state personal income/population release bea-regional-state-annual-2026-09-30 (through 2025), BEA state PCE release bea-sapce-2026-09-30 (through 2025), BLS State and Area Employment snapshot 2026-08-24 (seasonally adjusted, through August 2026).
Regional price parities are price-level indexes (U.S. = 100); housing RPPs measure housing-services price levels and are estimated for tenant-occupied housing. Real per capita personal income is deflated by state price level, constant 2017 dollars.
Per-capita housing-and-utilities PCE is current-dollar consumption including imputed rents; it mixes prices and quantities and is not a household bill.
Population figures are BEA midyear resident estimates (natural change plus migration), a different measure from the Census net domestic-migration figures cited in today's reporting; both are labeled as such.
All comparisons are descriptive. No causal effect of prices on migration or employment is inferred. Employment figures are state total nonfarm, seasonally adjusted; percent changes compare January 2019 with August 2026.
Calculations are reproducible in saved scripts midwest-cost-advantage-calc1 through calc4 over saved extracts; nulls were absent in used series and no imputation was performed.
Research completed 2026-10-28, for the October 27, 2026 news edition. The available source data may cover earlier periods; see the observation periods and source vintages above.
- BEA Regional Price Parities and Real Income (SARPP/SARPI bulk release bea-rpp-2026-02-19): Source 1, Source 2
- BEA Annual State GDP and Income — population (SAINC1, release bea-regional-state-annual-2026-09-30): Source 1, Source 2
- BEA Personal Consumption Expenditures by State (SAPCE2, release bea-sapce-2026-09-30): Source 1, Source 2
- BLS State and Area Employment (snapshot bls-sm-snapshot-2026-08-24): Source 1, Source 2