Research
The labor wards closed. Chicago’s hospital payroll did not.
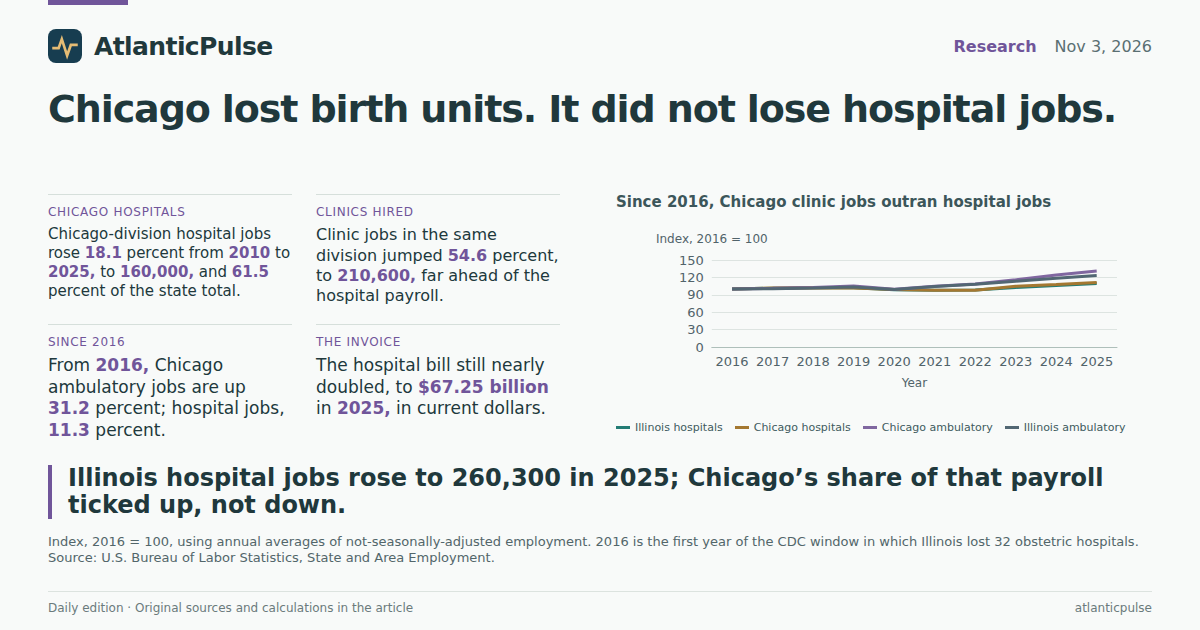
The wards closed. The payroll did not.
Roseland Community Hospital shut its maternity ward on Saturday. It was the fourth Chicago-area hospital to suspend labor and delivery in 30 days, after Prime Healthcare cut obstetrics at Saint Joseph in Joliet, Mercy in Aurora and Resurrection on the North Side, WTTW reported. The hospital’s own president blamed decades of underfunding for safety-net hospitals and falling birth rates. Dr. Joy West, who had chaired obstetrics there for years, compared the closures to pulling a fire station from a neighborhood that already has fires. Illinois, according to CDC figures cited in that reporting, lost 32 obstetric hospitals between 2016 and 2023. Black women in the state remain more than twice as likely as White women to die of a pregnancy-related condition.
That is a story about access, not about a disappearing hospital industry. The official payroll does not count labor rooms. It counts people on hospital badges. On that ledger, Illinois hospital employment — the annual average of not-seasonally-adjusted jobs in the Bureau of Labor Statistics State and Area Employment series — rose from 230,300 in 2010 to 260,300 in 2025. The Chicago-Naperville-Schaumburg metropolitan division, which is not the whole metro but is where most of those closing wards sit, went from 135,500 hospital jobs to 160,000. Chicago’s share of the state’s hospital payroll ticked up from 58.8 percent to 61.5 percent. The city’s hospitals did not hollow out. They slightly concentrated.
Chicago still holds most of Illinois’s hospital jobs

View exact chart values
| year | illinois_hospitals_thousands | chicago_division_hospitals_thousands | chicago_share_pct | chicago_ambulatory_thousands | illinois_ambulatory_avg_thousands |
|---|---|---|---|---|---|
| 2010 | 230.3 | 135.5 | 58.8 | 136.2 | 224.2 |
| 2011 | 231.6 | 137 | 59.2 | 140.9 | 229.1 |
| 2012 | 232.9 | 137.5 | 59 | 144.7 | 233.4 |
| 2013 | 231 | 135.3 | 58.6 | 151 | 239.3 |
| 2014 | 230.4 | 136.3 | 59.2 | 155.1 | 243.7 |
| 2015 | 232.1 | 139.3 | 60 | 158.6 | 249.4 |
| 2016 | 237.6 | 143.8 | 60.5 | 160.5 | 253.9 |
| 2017 | 241 | 146.1 | 60.6 | 162.5 | 255.2 |
| 2018 | 242.9 | 146.9 | 60.5 | 165 | 258.1 |
| 2019 | 242.5 | 146.1 | 60.2 | 168.6 | 262.8 |
| 2020 | 234.8 | 142.2 | 60.6 | 159.9 | 251.7 |
| 2021 | 232.2 | 140.8 | 60.6 | 168.1 | 264.2 |
| 2022 | 233.3 | 140.8 | 60.4 | 174.5 | 275 |
| 2023 | 244 | 150.5 | 61.7 | 185.8 | 287.9 |
| 2024 | 252.3 | 155 | 61.4 | 199 | 301.4 |
| 2025 | 260.3 | 160 | 61.5 | 210.6 | 312.5 |
The hiring went to clinics
The more honest split is between hospitals and everything that is not a hospital. Ambulatory health care — physician offices, outpatient centers, home-health agencies — is where the jobs actually multiplied. In the same Chicago division, ambulatory employment rose from 136,200 in 2010 to 210,600 in 2025, a 54.6 percent gain against an 18.1 percent gain in hospital jobs. Statewide, the annual average of Illinois ambulatory jobs went from about 224,200 to 312,500. Month to month, not-seasonally-adjusted ambulatory employment stood at 218,400 in January 2010 and 318,500 in August 2026.
Index the series to 2016, the first year of the CDC window in which Illinois lost those 32 obstetric hospitals, and the fork is even clearer. By 2025, Chicago hospital jobs were 11.3 percent above 2016. Statewide hospital jobs were 9.6 percent above. Chicago ambulatory jobs were 31.2 percent above; statewide ambulatory jobs, 23.1 percent above. A pandemic dip in 2020 shows up in every series. Only the hospital lines were still below their 2016 level as late as 2022. The clinics had already recouped.
None of that measures a labor-and-delivery nurse. BLS does not publish obstetric-unit employment for Chicago. A hospital can close a maternity ward, keep its ICU, and still add badges. The books do say this: if you are looking for the part of the health system that absorbed the last decade’s hiring, it is not the inpatient tower. It is the clinic down the street, which is also where Roseland’s remaining patients are now being told to travel — more than four miles to Trinity, a hospital that is itself scheduled to close obstetrics in 2027.
Since 2016, Chicago clinic jobs outran hospital jobs

View exact chart values
| year | illinois_hospitals_index | chicago_hospitals_index | chicago_ambulatory_index | illinois_ambulatory_index |
|---|---|---|---|---|
| 2016 | 100 | 100 | 100 | 100 |
| 2017 | 101.4 | 101.6 | 101.2 | 100.5 |
| 2018 | 102.2 | 102.2 | 102.8 | 101.7 |
| 2019 | 102.1 | 101.6 | 105 | 103.5 |
| 2020 | 98.8 | 98.9 | 99.6 | 99.2 |
| 2021 | 97.7 | 97.9 | 104.7 | 104.1 |
| 2022 | 98.2 | 97.9 | 108.7 | 108.3 |
| 2023 | 102.7 | 104.7 | 115.8 | 113.4 |
| 2024 | 106.2 | 107.8 | 124 | 118.7 |
| 2025 | 109.6 | 111.3 | 131.2 | 123.1 |
The bill still doubled
Households did not get a discount for fewer birth units. Illinois residents spent $67.25 billion on hospital services in 2025, according to the Bureau of Economic Analysis state consumption accounts, up from $34.14 billion in 2010 — a 97 percent rise in current dollars, not adjusted for inflation. Outpatient services, which include physician, dental and paramedical care, rose from $30.22 billion to $55.85 billion, or 84.8 percent. Nursing homes went from $6.70 billion to $12.76 billion. Physician services, a piece of the outpatient total and not something to add on top, reached $28.54 billion.
Hospitals still take the largest slice of that three-way split: 49.5 percent of combined hospital, outpatient and nursing-home spending in 2025, barely changed from 48.0 percent in 2010. The mix of jobs moved toward clinics. The mix of dollars did not. That is the uncomfortable arithmetic of American health care in miniature: you can lose a ward and still send a bigger invoice. Seasonally adjusted health care and social assistance employment in Illinois rose from 680,000 in January 2010 to 877,500 in August 2026, and its share of private-and-government nonfarm jobs went from 12.2 percent to 14.2 percent. The industry that is shedding birth units is still the industry adding the jobs.
The hospital bill nearly doubled even as wards closed

View exact chart values
| year | hospitals_bil | outpatient_bil | nursing_homes_bil | physician_bil | hospital_share_pct |
|---|---|---|---|---|---|
| 2010 | 34.14 | 30.22 | 6.7 | 16.5 | 48 |
| 2011 | 35.04 | 31.23 | 6.8 | 17.15 | 48 |
| 2012 | 35.91 | 32.07 | 7.02 | 17.58 | 47.9 |
| 2013 | 37.34 | 31.93 | 7.22 | 17.47 | 48.8 |
| 2014 | 39.08 | 33.03 | 7.43 | 18.05 | 49.1 |
| 2015 | 39.88 | 34.55 | 7.71 | 18.85 | 48.5 |
| 2016 | 42.03 | 35.96 | 8.15 | 19.89 | 48.8 |
| 2017 | 43.02 | 36.81 | 8.37 | 20.48 | 48.8 |
| 2018 | 44.25 | 38.09 | 8.7 | 21.21 | 48.6 |
| 2019 | 46.49 | 39.02 | 9 | 21.53 | 49.2 |
| 2020 | 44.75 | 36.77 | 8.82 | 20.38 | 49.5 |
| 2021 | 49.6 | 40.74 | 9.04 | 22.1 | 49.9 |
| 2022 | 52.47 | 44.29 | 9.8 | 23.53 | 49.2 |
| 2023 | 57.45 | 47.79 | 11.04 | 25.06 | 49.4 |
| 2024 | 62.39 | 51.94 | 11.93 | 26.9 | 49.4 |
| 2025 | 67.25 | 55.85 | 12.76 | 28.54 | 49.5 |
Hospitals still take the largest slice of Illinois medical spending

View exact chart values
| category | billions_current_dollars |
|---|---|
| Hospitals | 67.25 |
| Outpatient services | 55.85 |
| Nursing homes | 12.76 |
Illinois is not the expensive neighbor
Per person, Illinois is not even the Midwest outlier. In 2025, Illinois households spent $10,681 per person on outpatient, hospital and nursing-home care. That was a 93.1 percent increase from $5,532 in 2010, and it sat a little above the U.S. average of $10,442. Indiana spent $11,817. Wisconsin spent $10,920. Missouri, whose own maternity-care deserts have been a separate story, spent $10,742. If closing birth units were a unique Illinois price shock, the per-capita books would show it. They show a region where medical bills climbed everywhere, and Illinois is in the middle of the pack.
The qualification writes itself. These are current-dollar accounts, so some of the doubling is inflation. They are annual statewide averages, so they cannot see a Far South Side ZIP code that just lost its labor ward. The 2025 hospital-job annual average was closed before Roseland’s Saturday shutdown, and it cannot register four closures in 30 days. Metropolitan-division boundaries are not the same as “Chicago.” None of that licenses a causal claim that closing obstetric units raised the hospital bill, or that adding clinic jobs replaced the midwives. It does license a narrower statement, which is the one the books will support: Illinois did not shrink its hospital workforce while it lost obstetric hospitals. It moved the hiring to ambulatory settings, kept sending a larger hospital invoice, and still spent less per person on medical care than Indiana.
Illinois is not the Midwest’s most expensive health-care state

View exact chart values
| state | per_capita_health_dollars |
|---|---|
| Indiana | 11817 |
| Wisconsin | 10920 |
| Missouri | 10742 |
| Illinois | 10681 |
| United States | 10442 |
Sources and methods
Research uses the pinned AtlanticPulse catalogue snapshots, not live downloads. BLS State and Area Employment observations come from the Aug. 24, 2026 snapshot of the SM all-history files; BEA state PCE observations come from the Sept. 30, 2026 SAPCE release covering 1997–2025. Provider lag is normal; 2025 PCE and 2025 annual employment averages are the latest complete years, not current-week counts.
Hospital and Chicago-division series in this snapshot are stored as annual averages of not-seasonally-adjusted monthly employment. Illinois statewide ambulatory employment is monthly NSA; annual averages used in the 2016-indexed comparison include only years with 12 monthly observations. Seasonally adjusted health care and total nonfarm series are monthly through August 2026.
Chicago-Naperville-Schaumburg is a metropolitan division (BLS area 16984), not the full Chicago-Naperville-Elgin MSA. Statewide hospital employment minus the division is not a clean rest-of-Illinois labor market. BLS does not publish obstetric-unit employment, so job counts cannot confirm or deny the loss of labor-and-delivery capacity.
BEA health-care PCE is nominal current dollars. Physician services are a component of outpatient services and were never added to outpatient totals. Per-capita health care covers outpatient, hospital and nursing-home services. Comparisons across states are descriptive. No causal effect is inferred from the coincidence of obstetric-hospital closures and rising bills.
Research completed 2026-11-04, for the November 3, 2026 news edition. The available source data may cover earlier periods; see the observation periods and source vintages above.