Research
The jobs boom healthcare already paid for
A boom that arrived with $4.14 gasoline
The Labor Day jobs report was written to be celebrated. U.S. employers added 162,000 payroll jobs in August, more than three times the 53,000 that had been penciled in, and the unemployment rate held at 4.1 percent. UBS promptly switched to expecting quarter-point rate increases in both September and December. Traders, via CME’s FedWatch, put the odds of a hike at the mid-September meeting around 58 percent. That is what a “strong” labor market is supposed to look like from a dealing desk.
It is not what it looks like from a pump. AAA put regular gasoline at a record Labor Day $4.14 a gallon and diesel at a record of its own. The White House talked about hiring. Drivers talked about the last summer trip they did not take. The useful question is not whether August printed a big number. It is whether the paycheck underneath that number had already stopped stretching.
The official books that can answer that question stop in July. The Current Employment Statistics extract used here is a 24 August 2026 snapshot, so it predates the September 4 revisions that turned July from a reported 23,000-job loss into a 21,000-job gain. August is not in the file. What the file does show, without any help from a holiday weekend, is that the labor market markets just re-rated was already a healthcare story with a stalled real wage.
The monthly job machine was already sputtering before August

View exact chart values
| month | total_nonfarm_change_thousands | food_services_change_thousands | local_gov_edu_change_thousands | manufacturing_change_thousands | information_change_thousands | private_ed_health_change_thousands |
|---|---|---|---|---|---|---|
| 2024-02 | 206 | 22.9 | 16.5 | -23 | -5 | 97 |
| 2024-03 | 228 | 19.5 | 31.6 | -16 | -7 | 95 |
| 2024-04 | 64 | -18.3 | -7.2 | -3 | -11 | 88 |
| 2024-05 | 78 | -30 | 3.7 | -8 | -10 | 70 |
| 2024-06 | 87 | 12.2 | -20.5 | -11 | 0 | 91 |
| 2024-07 | 53 | 5.3 | 34.2 | -8 | -13 | 41 |
| 2024-08 | 9 | -4.1 | 5.6 | -34 | -8 | 58 |
| 2024-09 | 155 | 25.8 | 2.4 | -14 | -6 | 118 |
| 2024-10 | 33 | 5.4 | 11.8 | -61 | -16 | 95 |
| 2024-11 | 134 | 3.1 | 5 | 14 | -2 | 84 |
| 2024-12 | 237 | 26.9 | 8.3 | -18 | 10 | 75 |
| 2025-01 | -48 | -29.1 | 10 | -20 | -18 | 61 |
| 2025-02 | 42 | -38.2 | 7.9 | -2 | -1 | 58 |
| 2025-03 | 67 | 10.4 | 7.4 | -5 | -9 | 68 |
| 2025-04 | 108 | 13.5 | 5.1 | -4 | -2 | 84 |
| 2025-05 | 13 | -4.4 | 4 | -11 | -1 | 60 |
| 2025-06 | -20 | 1.2 | 11.9 | -15 | -1 | 49 |
| 2025-07 | 64 | 5.3 | 4.6 | -11 | -2 | 87 |
| 2025-08 | -70 | 21 | 2.6 | -10 | -1 | 23 |
| 2025-09 | 76 | 38.9 | 7 | -3 | -1 | 54 |
| 2025-10 | -140 | 42.6 | 5.6 | -9 | -6 | 44 |
| 2025-11 | 41 | 21.6 | -2 | -10 | -5 | 56 |
| 2025-12 | -17 | -4.8 | -5.8 | -13 | -6 | 38 |
| 2026-01 | 160 | 23.2 | 2.9 | 2 | -27 | 119 |
| 2026-02 | -156 | -38.8 | -5.2 | 1 | -23 | -49 |
| 2026-03 | 214 | 27.5 | 11 | 15 | 1 | 95 |
| 2026-04 | 148 | 4.9 | -11 | -1 | -6 | 67 |
| 2026-05 | 63 | 24.9 | -26.1 | -2 | -5 | 24 |
| 2026-06 | 20 | -12.1 | -11.6 | 11 | -13 | 54 |
| 2026-07 | -23 | -26.1 | -49.6 | 5 | 11 | 25 |
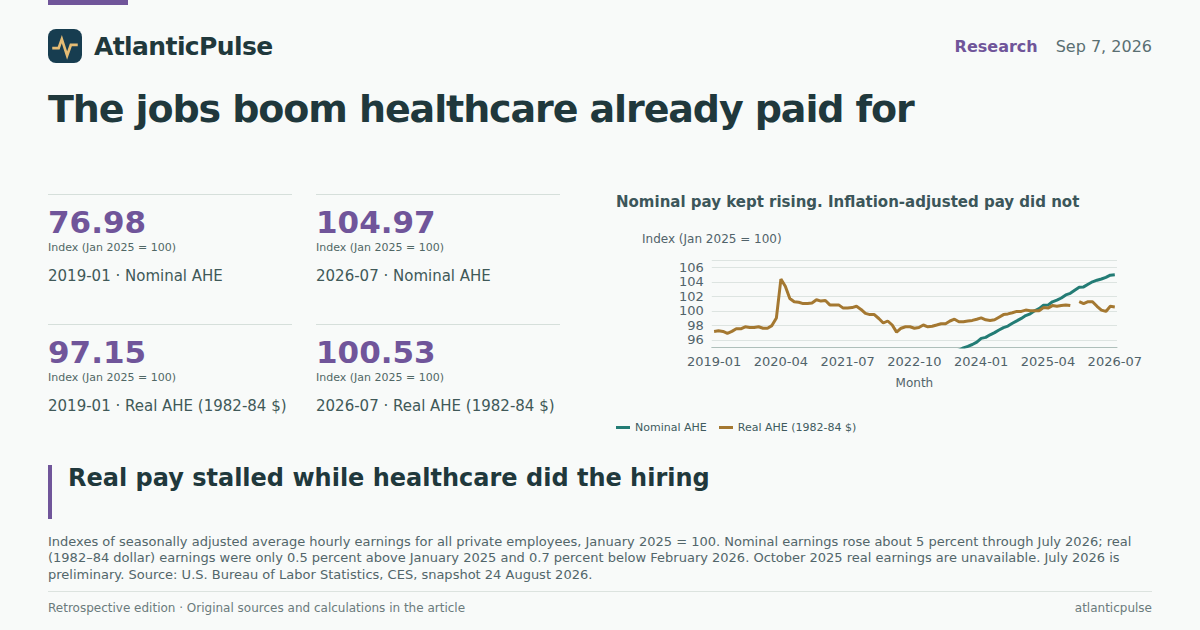
Nominal dollars kept rising. Real ones did not
Seasonally adjusted average hourly earnings for all private employees were $35.84 in January 2025 and $37.62 in July 2026, a 5.0 percent raise in the number on the stub. Deflate those same earnings the way the Bureau of Labor Statistics does — into 1982–84 dollars — and the picture flattens. Real average hourly earnings were $11.24 in January 2025. They peaked at $11.38 in November 2025 and again in January–February 2026, just as U.S. and Israeli strikes on Iran began. By July they were $11.30, still 0.5 percent above the start of 2025 and 0.7 percent below February. June and July are preliminary.
That is not a collapse. It is a stall with a dip attached, arriving in the same months gasoline and diesel were setting records. The 2022 inflation scare had already shown how this series behaves: real hourly pay bottomed at $10.91 in June 2022, when the national gasoline average last made politicians sweat. The 2026 slip is smaller. It is also happening while officials describe the labor market as sturdy enough to tighten. A 5 percent nominal raise that buys 0.5 percent more after prices is not what “blew past forecasts” sounds like in a grocery aisle.
Hours did not rescue the paycheck. Average weekly hours for all private employees were 34.1 in January 2025 and 34.3 in July 2026. Restaurant cooks did not get there by working a hidden extra shift. Food-services hourly pay, available through June in this snapshot, rose from $20.95 to $21.99, about 5.0 percent — the same nominal pace as the private sector overall, from a much lower base, in the industry that accounted for most of August’s headline gain.
Real average hourly earnings have slipped since the Iran war began

View exact chart values
| month | real_ahe_1982_84_dollars | status |
|---|---|---|
| 2019-01 | 10.92 | |
| 2019-02 | 10.93 | |
| 2019-03 | 10.92 | |
| 2019-04 | 10.89 | |
| 2019-05 | 10.92 | |
| 2019-06 | 10.96 | |
| 2019-07 | 10.96 | |
| 2019-08 | 10.99 | |
| 2019-09 | 10.98 | |
| 2019-10 | 10.98 | |
| 2019-11 | 10.99 | |
| 2019-12 | 10.97 | |
| 2020-01 | 10.97 | |
| 2020-02 | 11.01 | |
| 2020-03 | 11.13 | |
| 2020-04 | 11.73 | |
| 2020-05 | 11.62 | |
| 2020-06 | 11.43 | |
| 2020-07 | 11.38 | |
| 2020-08 | 11.37 | |
| 2020-09 | 11.35 | |
| 2020-10 | 11.35 | |
| 2020-11 | 11.36 | |
| 2020-12 | 11.41 | |
| 2021-01 | 11.39 | |
| 2021-02 | 11.4 | |
| 2021-03 | 11.33 | |
| 2021-04 | 11.33 | |
| 2021-05 | 11.33 | |
| 2021-06 | 11.28 | |
| 2021-07 | 11.28 | |
| 2021-08 | 11.29 | |
| 2021-09 | 11.31 | |
| 2021-10 | 11.26 | |
| 2021-11 | 11.2 | |
| 2021-12 | 11.18 | |
| 2022-01 | 11.18 | |
| 2022-02 | 11.12 | |
| 2022-03 | 11.05 | |
| 2022-04 | 11.08 | |
| 2022-05 | 11.02 | |
| 2022-06 | 10.91 | |
| 2022-07 | 10.97 | |
| 2022-08 | 10.99 | |
| 2022-09 | 10.99 | |
| 2022-10 | 10.97 | |
| 2022-11 | 10.98 | |
| 2022-12 | 11.02 | |
| 2023-01 | 10.99 | |
| 2023-02 | 11 | |
| 2023-03 | 11.02 | |
| 2023-04 | 11.04 | |
| 2023-05 | 11.04 | |
| 2023-06 | 11.08 | |
| 2023-07 | 11.11 | |
| 2023-08 | 11.07 | |
| 2023-09 | 11.07 | |
| 2023-10 | 11.08 | |
| 2023-11 | 11.09 | |
| 2023-12 | 11.11 | |
| 2024-01 | 11.13 | |
| 2024-02 | 11.1 | |
| 2024-03 | 11.09 | |
| 2024-04 | 11.1 | |
| 2024-05 | 11.14 | |
| 2024-06 | 11.18 | |
| 2024-07 | 11.19 | |
| 2024-08 | 11.21 | |
| 2024-09 | 11.23 | |
| 2024-10 | 11.23 | |
| 2024-11 | 11.25 | |
| 2024-12 | 11.24 | |
| 2025-01 | 11.24 | |
| 2025-02 | 11.24 | |
| 2025-03 | 11.29 | |
| 2025-04 | 11.28 | |
| 2025-05 | 11.32 | |
| 2025-06 | 11.31 | |
| 2025-07 | 11.32 | |
| 2025-08 | 11.33 | |
| 2025-09 | 11.32 | |
| 2025-11 | 11.38 | |
| 2025-12 | 11.35 | |
| 2026-01 | 11.38 | |
| 2026-02 | 11.38 | |
| 2026-03 | 11.31 | |
| 2026-04 | 11.25 | |
| 2026-05 | 11.23 | |
| 2026-06 | 11.31 | footnote:P |
| 2026-07 | 11.3 | footnote:P |
Nominal pay kept rising. Inflation-adjusted pay did not

View exact chart values
| month | nominal_index_jan2025 | nominal_ahe_dollars | real_index_jan2025 | real_ahe_1982_84_dollars |
|---|---|---|---|---|
| 2019-01 | 76.98 | 27.59 | 97.15 | 10.92 |
| 2019-02 | 77.26 | 27.69 | 97.24 | 10.93 |
| 2019-03 | 77.48 | 27.77 | 97.15 | 10.92 |
| 2019-04 | 77.54 | 27.79 | 96.89 | 10.89 |
| 2019-05 | 77.79 | 27.88 | 97.15 | 10.92 |
| 2019-06 | 78.04 | 27.97 | 97.51 | 10.96 |
| 2019-07 | 78.21 | 28.03 | 97.51 | 10.96 |
| 2019-08 | 78.52 | 28.14 | 97.78 | 10.99 |
| 2019-09 | 78.57 | 28.16 | 97.69 | 10.98 |
| 2019-10 | 78.79 | 28.24 | 97.69 | 10.98 |
| 2019-11 | 79.07 | 28.34 | 97.78 | 10.99 |
| 2019-12 | 79.19 | 28.38 | 97.6 | 10.97 |
| 2020-01 | 79.32 | 28.43 | 97.6 | 10.97 |
| 2020-02 | 79.63 | 28.54 | 97.95 | 11.01 |
| 2020-03 | 80.16 | 28.73 | 99.02 | 11.13 |
| 2020-04 | 83.82 | 30.04 | 104.36 | 11.73 |
| 2020-05 | 82.92 | 29.72 | 103.38 | 11.62 |
| 2020-06 | 81.98 | 29.38 | 101.69 | 11.43 |
| 2020-07 | 82 | 29.39 | 101.25 | 11.38 |
| 2020-08 | 82.28 | 29.49 | 101.16 | 11.37 |
| 2020-09 | 82.34 | 29.51 | 100.98 | 11.35 |
| 2020-10 | 82.42 | 29.54 | 100.98 | 11.35 |
| 2020-11 | 82.7 | 29.64 | 101.07 | 11.36 |
| 2020-12 | 83.45 | 29.91 | 101.51 | 11.41 |
| 2021-01 | 83.51 | 29.93 | 101.33 | 11.39 |
| 2021-02 | 83.84 | 30.05 | 101.42 | 11.4 |
| 2021-03 | 83.79 | 30.03 | 100.8 | 11.33 |
| 2021-04 | 84.32 | 30.22 | 100.8 | 11.33 |
| 2021-05 | 84.85 | 30.41 | 100.8 | 11.33 |
| 2021-06 | 85.21 | 30.54 | 100.36 | 11.28 |
| 2021-07 | 85.55 | 30.66 | 100.36 | 11.28 |
| 2021-08 | 85.88 | 30.78 | 100.44 | 11.29 |
| 2021-09 | 86.44 | 30.98 | 100.62 | 11.31 |
| 2021-10 | 86.89 | 31.14 | 100.18 | 11.26 |
| 2021-11 | 87.14 | 31.23 | 99.64 | 11.2 |
| 2021-12 | 87.58 | 31.39 | 99.47 | 11.18 |
| 2022-01 | 88.17 | 31.6 | 99.47 | 11.18 |
| 2022-02 | 88.28 | 31.64 | 98.93 | 11.12 |
| 2022-03 | 88.73 | 31.8 | 98.31 | 11.05 |
| 2022-04 | 89.17 | 31.96 | 98.58 | 11.08 |
| 2022-05 | 89.56 | 32.1 | 98.04 | 11.02 |
| 2022-06 | 89.82 | 32.19 | 97.06 | 10.91 |
| 2022-07 | 90.23 | 32.34 | 97.6 | 10.97 |
| 2022-08 | 90.51 | 32.44 | 97.78 | 10.99 |
| 2022-09 | 90.88 | 32.57 | 97.78 | 10.99 |
| 2022-10 | 91.24 | 32.7 | 97.6 | 10.97 |
| 2022-11 | 91.57 | 32.82 | 97.69 | 10.98 |
| 2022-12 | 91.91 | 32.94 | 98.04 | 11.02 |
| 2023-01 | 92.13 | 33.02 | 97.78 | 10.99 |
| 2023-02 | 92.49 | 33.15 | 97.86 | 11 |
| 2023-03 | 92.83 | 33.27 | 98.04 | 11.02 |
| 2023-04 | 93.28 | 33.43 | 98.22 | 11.04 |
| 2023-05 | 93.47 | 33.5 | 98.22 | 11.04 |
| 2023-06 | 94 | 33.69 | 98.58 | 11.08 |
| 2023-07 | 94.45 | 33.85 | 98.84 | 11.11 |
| 2023-08 | 94.56 | 33.89 | 98.49 | 11.07 |
| 2023-09 | 94.89 | 34.01 | 98.49 | 11.07 |
| 2023-10 | 95.09 | 34.08 | 98.58 | 11.08 |
| 2023-11 | 95.34 | 34.17 | 98.67 | 11.09 |
| 2023-12 | 95.68 | 34.29 | 98.84 | 11.11 |
| 2024-01 | 96.18 | 34.47 | 99.02 | 11.13 |
| 2024-02 | 96.32 | 34.52 | 98.75 | 11.1 |
| 2024-03 | 96.68 | 34.65 | 98.67 | 11.09 |
| 2024-04 | 96.99 | 34.76 | 98.75 | 11.1 |
| 2024-05 | 97.35 | 34.89 | 99.11 | 11.14 |
| 2024-06 | 97.68 | 35.01 | 99.47 | 11.18 |
| 2024-07 | 97.88 | 35.08 | 99.56 | 11.19 |
| 2024-08 | 98.27 | 35.22 | 99.73 | 11.21 |
| 2024-09 | 98.6 | 35.34 | 99.91 | 11.23 |
| 2024-10 | 98.94 | 35.46 | 99.91 | 11.23 |
| 2024-11 | 99.33 | 35.6 | 100.09 | 11.25 |
| 2024-12 | 99.58 | 35.69 | 100 | 11.24 |
| 2025-01 | 100 | 35.84 | 100 | 11.24 |
| 2025-02 | 100.28 | 35.94 | 100 | 11.24 |
| 2025-03 | 100.75 | 36.11 | 100.44 | 11.29 |
| 2025-04 | 100.78 | 36.12 | 100.36 | 11.28 |
| 2025-05 | 101.23 | 36.28 | 100.71 | 11.32 |
| 2025-06 | 101.45 | 36.36 | 100.62 | 11.31 |
| 2025-07 | 101.76 | 36.47 | 100.71 | 11.32 |
| 2025-08 | 102.18 | 36.62 | 100.8 | 11.33 |
| 2025-09 | 102.4 | 36.7 | 100.71 | 11.32 |
| 2025-10 | 102.82 | 36.85 | — | — |
| 2025-11 | 103.24 | 37 | 101.25 | 11.38 |
| 2025-12 | 103.29 | 37.02 | 100.98 | 11.35 |
| 2026-01 | 103.66 | 37.15 | 101.25 | 11.38 |
| 2026-02 | 103.99 | 37.27 | 101.25 | 11.38 |
| 2026-03 | 104.21 | 37.35 | 100.62 | 11.31 |
| 2026-04 | 104.38 | 37.41 | 100.09 | 11.25 |
| 2026-05 | 104.6 | 37.49 | 99.91 | 11.23 |
| 2026-06 | 104.91 | 37.6 | 100.62 | 11.31 |
| 2026-07 | 104.97 | 37.62 | 100.53 | 11.3 |
Healthcare hired. Factories and information did not
Count the jobs, not the adjectives. From January 2025 through July 2026, total nonfarm payrolls rose by 590,000, or 0.37 percent — 158.3 million to 158.9 million. Private education and health services alone added 956,000 jobs, a 3.5 percent increase. That single supersector more than accounted for the entire net gain. Everyone else, taken together, shrank.
The split is not subtle. Manufacturing fell by 62,000 jobs, or 0.5 percent, to 12.61 million. Information, the payroll home of publishing, telecom, data processing and a good deal of the industry now promising artificial general intelligence, fell by 97,000 jobs, or 3.4 percent, to 2.78 million. Goods-producing employment as a whole was essentially unchanged, up 2,000 jobs on a base of 21.6 million. If the political argument is that tariffs and a tighter border would restock the factory floor, the factory floor had not noticed by July.
Food services and drinking places did add 111,000 jobs over those 18 months, a 0.9 percent rise. Leisure and hospitality, the broader grouping that includes restaurants, added 99,000. Those two figures cannot be stacked: restaurants sit inside leisure. Local government education, which the August report credited with 42,000 new jobs in a single month, was down 41,000 from January 2025 through July. August may well have been a bounce. It was bouncing off a decline.
Healthcare did the hiring. Factories and information did not

View exact chart values
| industry | job_change_thousands |
|---|---|
| Private education and health services | 956 |
| Food services and drinking places | 110.6 |
| Leisure and hospitality | 99 |
| Goods-producing | 2 |
| Local government education | -41.3 |
| Manufacturing | -62 |
| Information | -97 |
One sector carried the payroll. Several others went the other way

View exact chart values
| month | total_nonfarm_index | total_nonfarm_thousands | food_services_index | food_services_thousands | local_gov_education_index | local_gov_education_thousands | manufacturing_index | manufacturing_thousands | information_index | information_thousands | private_ed_health_index | private_ed_health_thousands | goods_producing_index | goods_producing_thousands | leisure_hospitality_index | leisure_hospitality_thousands |
|---|---|---|---|---|---|---|---|---|---|---|---|---|---|---|---|---|
| 2024-01 | 99.22 | 157032 | 99.68 | 12196.6 | 98.76 | 8082.1 | 101.59 | 12875 | 102.99 | 2963 | 96.4 | 26033 | 100.33 | 21631 | 99.31 | 16716 |
| 2024-02 | 99.35 | 157238 | 99.86 | 12219.5 | 98.96 | 8098.6 | 101.41 | 12852 | 102.82 | 2958 | 96.76 | 26130 | 100.27 | 21617 | 99.48 | 16744 |
| 2024-03 | 99.49 | 157466 | 100.02 | 12239 | 99.35 | 8130.2 | 101.29 | 12836 | 102.57 | 2951 | 97.11 | 26225 | 100.36 | 21636 | 99.69 | 16780 |
| 2024-04 | 99.53 | 157530 | 99.87 | 12220.7 | 99.26 | 8123 | 101.26 | 12833 | 102.19 | 2940 | 97.43 | 26313 | 100.33 | 21631 | 99.58 | 16762 |
| 2024-05 | 99.58 | 157608 | 99.63 | 12190.7 | 99.31 | 8126.7 | 101.2 | 12825 | 101.84 | 2930 | 97.69 | 26383 | 100.31 | 21625 | 99.4 | 16731 |
| 2024-06 | 99.64 | 157695 | 99.73 | 12202.9 | 99.06 | 8106.2 | 101.11 | 12814 | 101.84 | 2930 | 98.03 | 26474 | 100.33 | 21630 | 99.48 | 16744 |
| 2024-07 | 99.67 | 157748 | 99.77 | 12208.2 | 99.47 | 8140.4 | 101.05 | 12806 | 101.39 | 2917 | 98.18 | 26515 | 100.36 | 21636 | 99.52 | 16751 |
| 2024-08 | 99.68 | 157757 | 99.74 | 12204.1 | 99.54 | 8146 | 100.78 | 12772 | 101.11 | 2909 | 98.4 | 26573 | 100.32 | 21628 | 99.49 | 16746 |
| 2024-09 | 99.78 | 157912 | 99.95 | 12229.9 | 99.57 | 8148.4 | 100.67 | 12758 | 100.9 | 2903 | 98.83 | 26691 | 100.35 | 21634 | 99.67 | 16776 |
| 2024-10 | 99.8 | 157945 | 99.99 | 12235.3 | 99.72 | 8160.2 | 100.19 | 12697 | 100.35 | 2887 | 99.19 | 26786 | 100.1 | 21581 | 99.8 | 16799 |
| 2024-11 | 99.88 | 158079 | 100.02 | 12238.4 | 99.78 | 8165.2 | 100.3 | 12711 | 100.28 | 2885 | 99.5 | 26870 | 100.2 | 21602 | 99.95 | 16823 |
| 2024-12 | 100.03 | 158316 | 100.24 | 12265.3 | 99.88 | 8173.5 | 100.16 | 12693 | 100.63 | 2895 | 99.77 | 26945 | 100.15 | 21591 | 100.18 | 16862 |
| 2025-01 | 100 | 158268 | 100 | 12236.2 | 100 | 8183.5 | 100 | 12673 | 100 | 2877 | 100 | 27006 | 100 | 21559 | 100 | 16832 |
| 2025-02 | 100.03 | 158310 | 99.69 | 12198 | 100.1 | 8191.4 | 99.98 | 12671 | 99.97 | 2876 | 100.21 | 27064 | 100 | 21560 | 99.79 | 16796 |
| 2025-03 | 100.07 | 158377 | 99.77 | 12208.4 | 100.19 | 8198.8 | 99.94 | 12666 | 99.65 | 2867 | 100.47 | 27132 | 100 | 21559 | 99.95 | 16823 |
| 2025-04 | 100.14 | 158485 | 99.88 | 12221.9 | 100.25 | 8203.9 | 99.91 | 12662 | 99.58 | 2865 | 100.78 | 27216 | 99.98 | 21555 | 100.02 | 16836 |
| 2025-05 | 100.15 | 158498 | 99.85 | 12217.5 | 100.3 | 8207.9 | 99.83 | 12651 | 99.55 | 2864 | 101 | 27276 | 99.9 | 21538 | 100.04 | 16839 |
| 2025-06 | 100.13 | 158478 | 99.86 | 12218.7 | 100.44 | 8219.8 | 99.71 | 12636 | 99.51 | 2863 | 101.18 | 27325 | 99.81 | 21519 | 100.03 | 16837 |
| 2025-07 | 100.17 | 158542 | 99.9 | 12224 | 100.5 | 8224.4 | 99.62 | 12625 | 99.44 | 2861 | 101.5 | 27412 | 99.71 | 21496 | 100.1 | 16848 |
| 2025-08 | 100.13 | 158472 | 100.07 | 12245 | 100.53 | 8227 | 99.54 | 12615 | 99.41 | 2860 | 101.59 | 27435 | 99.55 | 21461 | 100.23 | 16870 |
| 2025-09 | 100.18 | 158548 | 100.39 | 12283.9 | 100.62 | 8234 | 99.52 | 12612 | 99.37 | 2859 | 101.79 | 27489 | 99.6 | 21472 | 100.45 | 16907 |
| 2025-10 | 100.09 | 158408 | 100.74 | 12326.5 | 100.69 | 8239.6 | 99.45 | 12603 | 99.17 | 2853 | 101.95 | 27533 | 99.5 | 21452 | 100.69 | 16948 |
| 2025-11 | 100.11 | 158449 | 100.91 | 12348.1 | 100.66 | 8237.6 | 99.37 | 12593 | 98.99 | 2848 | 102.16 | 27589 | 99.62 | 21477 | 100.62 | 16936 |
| 2025-12 | 100.1 | 158432 | 100.88 | 12343.3 | 100.59 | 8231.8 | 99.27 | 12580 | 98.78 | 2842 | 102.3 | 27627 | 99.52 | 21456 | 100.77 | 16961 |
| 2026-01 | 100.2 | 158592 | 101.06 | 12366.5 | 100.63 | 8234.7 | 99.28 | 12582 | 97.84 | 2815 | 102.74 | 27746 | 99.73 | 21501 | 100.8 | 16966 |
| 2026-02 | 100.11 | 158436 | 100.75 | 12327.7 | 100.56 | 8229.5 | 99.29 | 12583 | 97.05 | 2792 | 102.56 | 27697 | 99.63 | 21480 | 100.61 | 16935 |
| 2026-03 | 100.24 | 158650 | 100.97 | 12355.2 | 100.7 | 8240.5 | 99.41 | 12598 | 97.08 | 2793 | 102.91 | 27792 | 99.79 | 21513 | 100.87 | 16979 |
| 2026-04 | 100.33 | 158798 | 101.01 | 12360.1 | 100.56 | 8229.5 | 99.4 | 12597 | 96.87 | 2787 | 103.16 | 27859 | 99.81 | 21519 | 100.83 | 16972 |
| 2026-05 | 100.37 | 158861 | 101.22 | 12385 | 100.24 | 8203.4 | 99.38 | 12595 | 96.7 | 2782 | 103.25 | 27883 | 99.83 | 21522 | 101.08 | 17014 |
| 2026-06 | 100.39 | 158881 | 101.12 | 12372.9 | 100.1 | 8191.8 | 99.47 | 12606 | 96.25 | 2769 | 103.45 | 27937 | 99.89 | 21536 | 100.83 | 16971 |
| 2026-07 | 100.37 | 158858 | 100.9 | 12346.8 | 99.5 | 8142.2 | 99.51 | 12611 | 96.63 | 2780 | 103.54 | 27962 | 100.01 | 21561 | 100.59 | 16931 |
What a rate hike would be reacting to
Index the same payrolls to January 2025 and the lines diverge in a way a single monthly print cannot hide. Private education and health services climb to 103.5 by July. Information slides to 96.6. Manufacturing drifts down and then sideways. Food services peak just after the new year and give some of it back. Total nonfarm barely makes it to 100.4. That is a labor market in which hospitals and clinics are still staffing up, software and media are still cutting, and the rest of the economy is close to treading water.
Month to month, the machine was already sputtering. In this vintage, total nonfarm payrolls fell in January, June, August, October and December 2025, and again in February and July 2026. Several of the plus months were smaller than a rounding error on a 159 million payroll. The September 4 revisions will have rewritten July. They will not have rewritten the 18-month arithmetic: net hiring was slow, concentrated, and already fading in real pay when the Iran war pushed energy costs back into the CPI.
None of this proves that $4 gasoline caused the real-wage dip, or that 162,000 August jobs were “fake,” or that the Federal Reserve should or should not hike. CES earnings are averages, not household budgets; a nurse’s raise and a cook’s raise are in the same mean. Food services is a slice of leisure, not a second helping. The extract is not the September 4 report. What it can say, without a speechwriter, is simpler. The boom traders just priced in was, through July, a healthcare boom. Real hourly pay had already stopped rising. The holiday-weekend gasoline line is what that feels like when you still have to drive to the shift.
Sources and methods
This is retrospective enrichment using a pinned CES snapshot, not a reconstruction of what was knowable on the 7 September 2026 edition date. Later releases and revisions may differ.
Research date: 11 September 2026. Historical edition date: 7 September 2026. Observation window: monthly CES series from January 2015 (earnings) or January 2019 (payrolls and hours) through July 2026. Product snapshot: bls-ce-snapshot-2026-08-24, created 24 August 2026, covering employment, hours and earnings through July 2026.
July 2026 values carry BLS preliminary status (footnote P) in this vintage. The snapshot predates the 4 September 2026 Employment Situation, which reported 162,000 August jobs and revised July from −23,000 to +21,000. August 2026 is therefore cited only from that day’s reporting, not from the extract.
Real average hourly earnings are BLS series CES0500000013 (all employees, total private, seasonally adjusted, 1982–84 dollars). Nominal earnings are CES0500000003. Payrolls are all-employees, thousands, seasonally adjusted. One real-earnings observation (October 2025) is null in the extract and is omitted, not treated as zero. No duplicate periods were found.
Industry totals are not additive across overlapping groups: food services and drinking places sit inside leisure and hospitality. Private education and health services is not the same as local government education. Changes are arithmetic differences in seasonally adjusted levels; they are not causal estimates of the Iran war, tariffs, or immigration policy. Averages are not household budgets. Scale is thousands of jobs for payrolls and dollars per hour for earnings.
Research completed 2026-09-11, for the September 7, 2026 news edition. This is retrospective analysis, not a reconstruction of information available that day.