Research
The Hike-Proof Boom: Americans Are Starting Businesses at a Record Pace, and the Fed Just Raised Rates Into It
Why the Fed pressed the button
On Wednesday the Federal Reserve raised its benchmark rate by a quarter point, to 3.75%–4.00% — the first increase in three years — and Chair Kevin Warsh explained why in one sentence: "The plain fact is that inflation is too high and has been for too long." The Fed also signaled that a majority of its policymakers expect at least one more hike this year, citing an economy that keeps surprising on the strong side. Retail sales jumped 1.2% in August, the largest monthly gain since March, even as gas prices climbed more than 7% in a month on war-driven energy costs (The Business Journal).
Central banks tighten when demand outruns supply, so the interesting question is where all this demand actually lives. One answer hides in a dataset almost nobody reads for fun: the Census Bureau's Business Formation Statistics, the official tally of applications for new Employer Identification Numbers — the paperwork that precedes essentially every new American business, from food truck to fusion startup. Applications are cheap to file, so they are noisy. But when they move this much, they are telling you something about how many Americans are trying to build things rather than just buy them (Census Bureau BFS).
The record: 129,000 founding papers a week
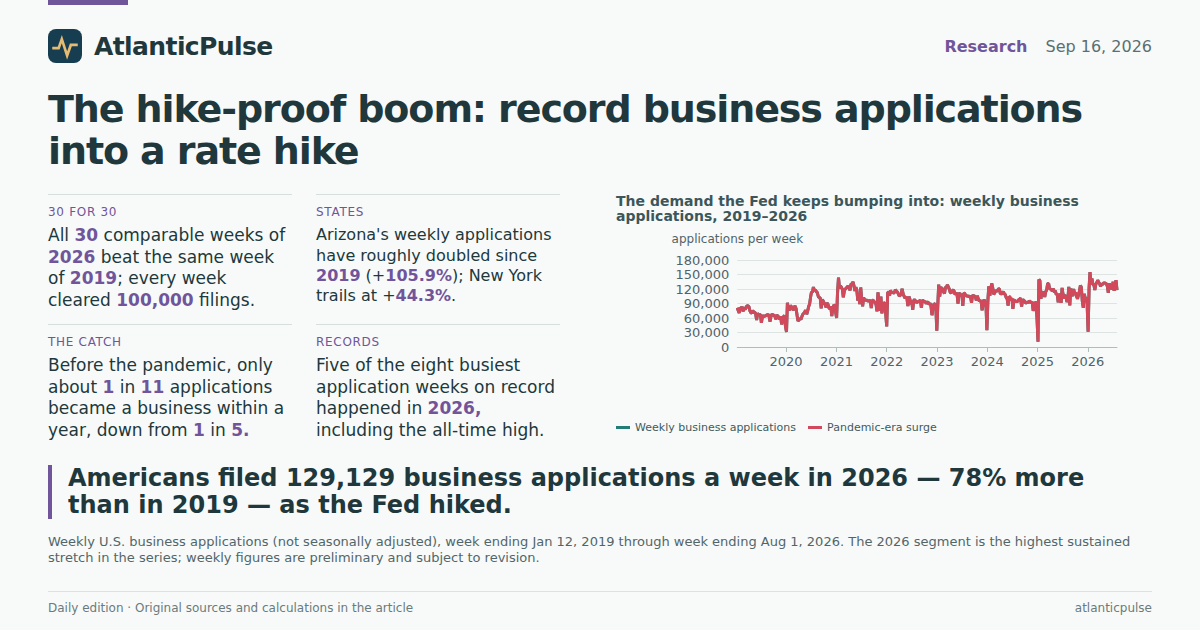
Here is the headline the hike will have to beat: in the first thirty-one weeks of 2026, Americans filed an average of 129,129 business applications per week. In the same calendar weeks of 2019 — the pre-pandemic baseline — the figure was 72,369. That is a 78.4% increase, measured on identical weeks so seasonal quirks (Americans famously file in January and slack off in July) cancel out entirely (Census Bureau BFS).
This is not a one-month blip. The weekly record shows the now-familiar shape: a modest plateau around 70,000–85,000 a week before 2020, a violent spike that summer — the week ending July 18, 2020, hit 124,000 — and then a step-change that never reversed. The averages for the same early-year window ran 115,241 in 2021, 104,980 in 2022, 112,193 in 2023, 107,316 in 2024 and 112,658 in 2025. Each of those was extraordinary by any pre-pandemic standard. 2026 beat them all.
The comparison gets almost comic at the extremes. All 30 comparable weeks of 2026 came in above their 2019 counterparts — 30 for 30 — and every single one cleared 100,000 filings. The weakest week of 2026 so far (112,090) would have been an above-average week in 2021. The average week of 2026 (129,129) outruns the single busiest week of the entire 2020 pandemic surge (124,000). And five of the eight busiest weekly figures in this six-and-a-half-year record occurred in 2026, topped by the all-time high of 155,020 in mid-January. Whatever the Fed is trying to cool, it is not a flickering flame.
The demand the Fed keeps bumping into: weekly business applications, 2019–2026

View exact chart values
| weekend | apps |
|---|---|
| 2019-01-12 | 81070 |
| 2019-01-19 | 75100 |
| 2019-01-26 | 70650 |
| 2019-02-02 | 80590 |
| 2019-02-09 | 80790 |
| 2019-02-16 | 83210 |
| 2019-02-23 | 73790 |
| 2019-03-02 | 82540 |
| 2019-03-09 | 77530 |
| 2019-03-16 | 80860 |
| 2019-03-23 | 85430 |
| 2019-03-30 | 84950 |
| 2019-04-06 | 83760 |
| 2019-04-13 | 75470 |
| 2019-04-20 | 71270 |
| 2019-04-27 | 70080 |
| 2019-05-04 | 75240 |
| 2019-05-11 | 71550 |
| 2019-05-18 | 71890 |
| 2019-05-25 | 70030 |
| 2019-06-01 | 55910 |
| 2019-06-08 | 69720 |
| 2019-06-15 | 66610 |
| 2019-06-22 | 67180 |
| 2019-06-29 | 67520 |
| 2019-07-06 | 49980 |
| 2019-07-13 | 63050 |
| 2019-07-20 | 64530 |
| 2019-07-27 | 63490 |
| 2019-08-03 | 64290 |
| 2019-08-10 | 65350 |
| 2019-08-17 | 66360 |
| 2019-08-24 | 67780 |
| 2019-08-31 | 63090 |
| 2019-09-07 | 52570 |
| 2019-09-14 | 64250 |
| 2019-09-21 | 67470 |
| 2019-09-28 | 66350 |
| 2019-10-05 | 65400 |
| 2019-10-12 | 63360 |
| 2019-10-19 | 57100 |
| 2019-10-26 | 66430 |
| 2019-11-02 | 64170 |
| 2019-11-09 | 62150 |
| 2019-11-16 | 57090 |
| 2019-11-23 | 63440 |
| 2019-11-30 | 46830 |
| 2019-12-07 | 55110 |
| 2019-12-14 | 62970 |
| 2019-12-21 | 64910 |
| 2019-12-28 | 42290 |
| 2020-01-04 | 31010 |
| 2020-01-11 | 91540 |
| 2020-01-18 | 79650 |
| 2020-01-25 | 75690 |
| 2020-02-01 | 85520 |
| 2020-02-08 | 83810 |
| 2020-02-15 | 82130 |
| 2020-02-22 | 75760 |
| 2020-02-29 | 82570 |
| 2020-03-07 | 84750 |
| 2020-03-14 | 79290 |
| 2020-03-21 | 65420 |
| 2020-03-28 | 54070 |
| 2020-04-04 | 55650 |
| 2020-04-11 | 59360 |
| 2020-04-18 | 56960 |
| 2020-04-25 | 62920 |
| 2020-05-02 | 67900 |
| 2020-05-09 | 69990 |
| 2020-05-16 | 72790 |
| 2020-05-23 | 75840 |
| 2020-05-30 | 67800 |
| 2020-06-06 | 74790 |
| 2020-06-13 | 83240 |
| 2020-06-20 | 88690 |
| 2020-06-27 | 103700 |
| 2020-07-04 | 114050 |
| 2020-07-11 | 113100 |
| 2020-07-18 | 124000 |
| 2020-07-25 | 117340 |
| 2020-08-01 | 118080 |
| 2020-08-08 | 114650 |
| 2020-08-15 | 112460 |
| 2020-08-22 | 104410 |
| 2020-08-29 | 102150 |
| 2020-09-05 | 101990 |
| 2020-09-12 | 79890 |
| 2020-09-19 | 97820 |
| 2020-09-26 | 95590 |
| 2020-10-03 | 91580 |
| 2020-10-10 | 87870 |
| 2020-10-17 | 82230 |
| 2020-10-24 | 91540 |
| 2020-10-31 | 88780 |
| 2020-11-07 | 81280 |
| 2020-11-14 | 79100 |
| 2020-11-21 | 84280 |
| 2020-11-28 | 64240 |
| 2020-12-05 | 78910 |
| 2020-12-12 | 86940 |
| 2020-12-19 | 85470 |
| 2021-01-02 | 59920 |
| 2021-01-09 | 111200 |
| 2021-01-16 | 143290 |
| 2021-01-23 | 121270 |
| 2021-01-30 | 126670 |
| 2021-02-06 | 123400 |
| 2021-02-13 | 119610 |
| 2021-02-20 | 102740 |
| 2021-02-27 | 116070 |
| 2021-03-06 | 119940 |
| 2021-03-13 | 121760 |
| 2021-03-20 | 123900 |
| 2021-03-27 | 125920 |
| 2021-04-03 | 122140 |
| 2021-04-10 | 117300 |
| 2021-04-17 | 130300 |
| 2021-04-24 | 130330 |
| 2021-05-01 | 134880 |
| 2021-05-08 | 127450 |
| 2021-05-15 | 115800 |
| 2021-05-22 | 123210 |
| 2021-05-29 | 118080 |
| 2021-06-05 | 96160 |
| 2021-06-12 | 109320 |
| 2021-06-19 | 88620 |
| 2021-06-26 | 123150 |
| 2021-07-03 | 101070 |
| 2021-07-10 | 84270 |
| 2021-07-17 | 101860 |
| 2021-07-24 | 99020 |
| 2021-07-31 | 96660 |
| 2021-08-07 | 97090 |
| 2021-08-14 | 95550 |
| 2021-08-21 | 95240 |
| 2021-08-28 | 95810 |
| 2021-09-04 | 95540 |
| 2021-09-11 | 80390 |
| 2021-09-18 | 97050 |
| 2021-09-25 | 96480 |
| 2021-10-02 | 93420 |
| 2021-10-09 | 92790 |
| 2021-10-16 | 87310 |
| 2021-10-23 | 73640 |
| 2021-10-30 | 113160 |
| 2021-11-06 | 88690 |
| 2021-11-13 | 74950 |
| 2021-11-20 | 104000 |
| 2021-11-27 | 69630 |
| 2021-12-04 | 82210 |
| 2021-12-11 | 91210 |
| 2021-12-18 | 91180 |
| 2021-12-25 | 69750 |
| 2022-01-01 | 42420 |
| 2022-01-08 | 113260 |
| 2022-01-15 | 112980 |
| 2022-01-22 | 106420 |
| 2022-01-29 | 117480 |
| 2022-02-05 | 112120 |
| 2022-02-12 | 114030 |
| 2022-02-19 | 111640 |
| 2022-02-26 | 112620 |
| 2022-03-05 | 118700 |
| 2022-03-12 | 115680 |
| 2022-03-19 | 113980 |
| 2022-03-26 | 110120 |
| 2022-04-02 | 105500 |
| 2022-04-09 | 107250 |
| 2022-04-16 | 108600 |
| 2022-04-23 | 120420 |
| 2022-04-30 | 110370 |
| 2022-05-07 | 105420 |
| 2022-05-14 | 101140 |
| 2022-05-21 | 103460 |
| 2022-05-28 | 101180 |
| 2022-06-04 | 84540 |
| 2022-06-11 | 104370 |
| 2022-06-18 | 99790 |
| 2022-06-25 | 88520 |
| 2022-07-02 | 96700 |
| 2022-07-09 | 76660 |
| 2022-07-16 | 96310 |
| 2022-07-23 | 98050 |
| 2022-07-30 | 95190 |
| 2022-08-06 | 91890 |
| 2022-08-13 | 93570 |
| 2022-08-20 | 93440 |
| 2022-08-27 | 95610 |
| 2022-09-03 | 96330 |
| 2022-09-10 | 80800 |
| 2022-09-17 | 96800 |
| 2022-09-24 | 95650 |
| 2022-10-01 | 93570 |
| 2022-10-08 | 94620 |
| 2022-10-15 | 89560 |
| 2022-10-22 | 92690 |
| 2022-10-29 | 92760 |
| 2022-11-05 | 88230 |
| 2022-11-12 | 90390 |
| 2022-11-19 | 84230 |
| 2022-11-26 | 65820 |
| 2022-12-03 | 79430 |
| 2022-12-10 | 89660 |
| 2022-12-17 | 88720 |
| 2022-12-24 | 84560 |
| 2022-12-31 | 33560 |
| 2023-01-07 | 86900 |
| 2023-01-14 | 129260 |
| 2023-01-21 | 103990 |
| 2023-01-28 | 122230 |
| 2023-02-04 | 123120 |
| 2023-02-11 | 118530 |
| 2023-02-18 | 113860 |
| 2023-02-25 | 110790 |
| 2023-03-04 | 124440 |
| 2023-03-11 | 123370 |
| 2023-03-18 | 128420 |
| 2023-03-25 | 123730 |
| 2023-04-01 | 119510 |
| 2023-04-08 | 112700 |
| 2023-04-15 | 112000 |
| 2023-04-22 | 116310 |
| 2023-04-29 | 117960 |
| 2023-05-06 | 115400 |
| 2023-05-13 | 108120 |
| 2023-05-20 | 111090 |
| 2023-05-27 | 110220 |
| 2023-06-03 | 89960 |
| 2023-06-10 | 110260 |
| 2023-06-17 | 110980 |
| 2023-06-24 | 105890 |
| 2023-07-01 | 109610 |
| 2023-07-08 | 84740 |
| 2023-07-15 | 111690 |
| 2023-07-22 | 110950 |
| 2023-07-29 | 106660 |
| 2023-08-05 | 105280 |
| 2023-08-12 | 105480 |
| 2023-08-19 | 104590 |
| 2023-08-26 | 103870 |
| 2023-09-02 | 105890 |
| 2023-09-09 | 91510 |
| 2023-09-16 | 106950 |
| 2023-09-23 | 106260 |
| 2023-09-30 | 105200 |
| 2023-10-07 | 104400 |
| 2023-10-14 | 96170 |
| 2023-10-21 | 105980 |
| 2023-10-28 | 99930 |
| 2023-11-04 | 95510 |
| 2023-11-11 | 95600 |
| 2023-11-18 | 95280 |
| 2023-11-25 | 75850 |
| 2023-12-02 | 87210 |
| 2023-12-09 | 98090 |
| 2023-12-16 | 92740 |
| 2023-12-23 | 92040 |
| 2023-12-30 | 34820 |
| 2024-01-06 | 96990 |
| 2024-01-13 | 125350 |
| 2024-01-20 | 106050 |
| 2024-01-27 | 120000 |
| 2024-02-03 | 131500 |
| 2024-02-10 | 122570 |
| 2024-02-17 | 108850 |
| 2024-02-24 | 111400 |
| 2024-03-02 | 117380 |
| 2024-03-09 | 115630 |
| 2024-03-16 | 116210 |
| 2024-03-23 | 120700 |
| 2024-03-30 | 119830 |
| 2024-04-06 | 109860 |
| 2024-04-13 | 110300 |
| 2024-04-20 | 109960 |
| 2024-04-27 | 115110 |
| 2024-05-04 | 109390 |
| 2024-05-11 | 109020 |
| 2024-05-18 | 102010 |
| 2024-05-25 | 100600 |
| 2024-06-01 | 85780 |
| 2024-06-08 | 104280 |
| 2024-06-15 | 103150 |
| 2024-06-22 | 96150 |
| 2024-06-29 | 100960 |
| 2024-07-06 | 78990 |
| 2024-07-13 | 96550 |
| 2024-07-20 | 96270 |
| 2024-07-27 | 94590 |
| 2024-08-03 | 93890 |
| 2024-08-10 | 94470 |
| 2024-08-17 | 97920 |
| 2024-08-24 | 99330 |
| 2024-08-31 | 100690 |
| 2024-09-07 | 83870 |
| 2024-09-14 | 97670 |
| 2024-09-21 | 96910 |
| 2024-09-28 | 95020 |
| 2024-10-05 | 90840 |
| 2024-10-12 | 91670 |
| 2024-10-19 | 93000 |
| 2024-10-26 | 91900 |
| 2024-11-02 | 95220 |
| 2024-11-09 | 93840 |
| 2024-11-16 | 91610 |
| 2024-11-23 | 93570 |
| 2024-11-30 | 74720 |
| 2024-12-07 | 81060 |
| 2024-12-14 | 93210 |
| 2024-12-21 | 91030 |
| 2024-12-28 | 59230 |
| 2025-01-04 | 11060 |
| 2025-01-11 | 139820 |
| 2025-01-18 | 137180 |
| 2025-01-25 | 99930 |
| 2025-02-01 | 112590 |
| 2025-02-08 | 113810 |
| 2025-02-15 | 111750 |
| 2025-02-22 | 103700 |
| 2025-03-01 | 114360 |
| 2025-03-08 | 118140 |
| 2025-03-15 | 131020 |
| 2025-03-22 | 131530 |
| 2025-03-29 | 121170 |
| 2025-04-05 | 119670 |
| 2025-04-12 | 117920 |
| 2025-04-19 | 115660 |
| 2025-04-26 | 120580 |
| 2025-05-03 | 113150 |
| 2025-05-10 | 116760 |
| 2025-05-17 | 108200 |
| 2025-05-24 | 109580 |
| 2025-05-31 | 92330 |
| 2025-06-07 | 106520 |
| 2025-06-14 | 109800 |
| 2025-06-21 | 91250 |
| 2025-06-28 | 122210 |
| 2025-07-05 | 109430 |
| 2025-07-12 | 100560 |
| 2025-07-19 | 105650 |
| 2025-07-26 | 105980 |
| 2025-08-02 | 93220 |
| 2025-08-09 | 98930 |
| 2025-08-16 | 124280 |
| 2025-08-23 | 85930 |
| 2025-08-30 | 121120 |
| 2025-09-06 | 109960 |
| 2025-09-13 | 105330 |
| 2025-09-20 | 120070 |
| 2025-09-27 | 111790 |
| 2025-10-04 | 112660 |
| 2025-10-11 | 104810 |
| 2025-10-18 | 99740 |
| 2025-10-25 | 108320 |
| 2025-11-01 | 115160 |
| 2025-11-08 | 127510 |
| 2025-11-15 | 123990 |
| 2025-11-22 | 95250 |
| 2025-11-29 | 80900 |
| 2025-12-06 | 109910 |
| 2025-12-13 | 101540 |
| 2025-12-20 | 100130 |
| 2025-12-27 | 90330 |
| 2026-01-03 | 31680 |
| 2026-01-10 | 122810 |
| 2026-01-17 | 155020 |
| 2026-01-24 | 128620 |
| 2026-01-31 | 141830 |
| 2026-02-07 | 129610 |
| 2026-02-14 | 128630 |
| 2026-02-21 | 118030 |
| 2026-02-28 | 129840 |
| 2026-03-07 | 133020 |
| 2026-03-14 | 137910 |
| 2026-03-21 | 134060 |
| 2026-03-28 | 130790 |
| 2026-04-04 | 125270 |
| 2026-04-11 | 130810 |
| 2026-04-18 | 129340 |
| 2026-04-25 | 132030 |
| 2026-05-02 | 132870 |
| 2026-05-09 | 131810 |
| 2026-05-16 | 130580 |
| 2026-05-23 | 125220 |
| 2026-05-30 | 112090 |
| 2026-06-06 | 131630 |
| 2026-06-13 | 123810 |
| 2026-06-20 | 121310 |
| 2026-06-27 | 121000 |
| 2026-07-04 | 134970 |
| 2026-07-11 | 116370 |
| 2026-07-18 | 128620 |
| 2026-07-25 | 138230 |
| 2026-08-01 | 117750 |
Same weeks, different country: Jan–Aug application averages, 2019–2026

View exact chart values
| year | avgweekly | nweeks |
|---|---|---|
| 2019 | 72369 | 31 |
| 2020 | 83260 | 31 |
| 2021 | 115241 | 31 |
| 2022 | 104980 | 31 |
| 2023 | 112193 | 31 |
| 2024 | 107316 | 31 |
| 2025 | 112658 | 31 |
| 2026 YTD | 129129 | 30 |
Thirty for thirty: 2026 weeks against the same weeks of 2019

View exact chart values
| weeknum | y2019 | y2026 |
|---|---|---|
| 1 | 81070 | 122810 |
| 2 | 75100 | 155020 |
| 3 | 70650 | 128620 |
| 4 | 80590 | 141830 |
| 5 | 80790 | 129610 |
| 6 | 83210 | 128630 |
| 7 | 73790 | 118030 |
| 8 | 82540 | 129840 |
| 9 | 77530 | 133020 |
| 10 | 80860 | 137910 |
| 11 | 85430 | 134060 |
| 12 | 84950 | 130790 |
| 13 | 83760 | 125270 |
| 14 | 75470 | 130810 |
| 15 | 71270 | 129340 |
| 16 | 70080 | 132030 |
| 17 | 75240 | 132870 |
| 18 | 71550 | 131810 |
| 19 | 71890 | 130580 |
| 20 | 70030 | 125220 |
| 21 | 55910 | 112090 |
| 22 | 69720 | 131630 |
| 23 | 66610 | 123810 |
| 24 | 67180 | 121310 |
| 25 | 67520 | 121000 |
| 26 | 49980 | 134970 |
| 27 | 63050 | 116370 |
| 28 | 64530 | 128620 |
| 29 | 63490 | 138230 |
| 30 | 64290 | 117750 |
Every region, same direction
Nor is this a one-region story driven by population shuffling. Across nine large states spanning the map, average weekly applications in 2026 ran far above the same weeks of 2019: Arizona +105.9%, Texas +91.2%, North Carolina +89.1%, Florida +87.9%, California +72.3%, Washington +71.4%, Georgia +67.3%, Illinois +63.3% and New York +44.3%. The Sun Belt is pulling hardest — Arizona has effectively doubled its founding pace — but the slowest grower on the list is still up nearly half from 2019 levels (Census Bureau BFS).
It is worth being careful about what these figures are not. They are not seasonally adjusted counts of open businesses, and the nine states here are a large-sample comparison rather than a full 50-state league table. But the direction is unanimous, which is the part that matters for a policymaker looking for weak demand: the part of the economy where people commit their own names, savings and evenings to starting something is the strongest it has been in the life of this dataset.
Nine states, one direction: application growth vs 2019

View exact chart values
| state | avg2019 | avg2026 | pctvs2019 |
|---|---|---|---|
| Arizona | 1570 | 3232 | 105.9 |
| Texas | 6274 | 11993 | 91.2 |
| North Carolina | 2153 | 4071 | 89.1 |
| Florida | 8141 | 15294 | 87.9 |
| California | 7539 | 12990 | 72.3 |
| Washington | 1426 | 2445 | 71.4 |
| Georgia | 3566 | 5964 | 67.3 |
| Illinois | 2414 | 3942 | 63.3 |
| New York | 4683 | 6756 | 44.3 |
The fine print: applications are promises
Now the skeptic's turn, and it is a good one: a business application is a form, not a firm. Some applications are side hustles that never hire; a portion are filed by people protecting a name before they know what it does. The Census Bureau has long tracked how many applications become actual businesses within four quarters — and the history is sobering. In 2005, about 20.5% of applications turned into a real business within a year. By 2019 the conversion rate had fallen to roughly 9%. In other words, even before the pandemic, America was filing a ballooning number of intentions and delivering a much thinner slice of companies (Census Bureau historic file).
There is a catch for our moment, though: the published conversion series in the current historical file ends with 2019-Q4, because formations necessarily lag applications by at least a year and the quarterly series here has not caught up. So nobody — including us — can yet say whether the 2021–2026 application boom is producing a proportionate wave of real companies. The most recent independent read on the mix is suggestive rather than definitive: a report by the AI firm MyUser, circulated by ANI, estimated that 36.3% of new U.S. companies in the first half of 2025 had a single founder, up from 23.7% in 2019, which it attributed to AI tools absorbing work that used to require staff (Indias News/ANI). If that is right, today's application flood may be a flood of one-person enterprises — exactly the kind of activity a rate hike is least able to stop and least likely to cool.
The catch: fewer applications became businesses before the pandemic

View exact chart values
| quarter | appslag | form4q | rate |
|---|---|---|---|
| 2005-Q3 | 574777 | 117878 | 20.5 |
| 2005-Q4 | 583203 | 113847 | 19.5 |
| 2006-Q1 | 610664 | 111756 | 18.3 |
| 2006-Q2 | 618094 | 107969 | 17.5 |
| 2006-Q3 | 630382 | 103506 | 16.4 |
| 2006-Q4 | 642871 | 101780 | 15.8 |
| 2007-Q1 | 670806 | 100006 | 14.9 |
| 2007-Q2 | 669661 | 98398 | 14.7 |
| 2007-Q3 | 652251 | 95646 | 14.7 |
| 2007-Q4 | 651490 | 92926 | 14.3 |
| 2008-Q1 | 650811 | 85435 | 13.1 |
| 2008-Q2 | 661710 | 83005 | 12.5 |
| 2008-Q3 | 669253 | 78370 | 11.7 |
| 2008-Q4 | 678039 | 75753 | 11.2 |
| 2009-Q1 | 639539 | 72694 | 11.4 |
| 2009-Q2 | 649892 | 71825 | 11.1 |
| 2009-Q3 | 636102 | 72624 | 11.4 |
| 2009-Q4 | 630516 | 71353 | 11.3 |
| 2010-Q1 | 600559 | 72665 | 12.1 |
| 2010-Q2 | 596991 | 72594 | 12.2 |
| 2010-Q3 | 607473 | 73694 | 12.1 |
| 2010-Q4 | 596111 | 72011 | 12.1 |
| 2011-Q1 | 608151 | 73267 | 12 |
| 2011-Q2 | 614928 | 71480 | 11.6 |
| 2011-Q3 | 619414 | 72899 | 11.8 |
| 2011-Q4 | 621342 | 71449 | 11.5 |
| 2012-Q1 | 652784 | 68369 | 10.5 |
| 2012-Q2 | 617669 | 70689 | 11.4 |
| 2012-Q3 | 631285 | 68540 | 10.9 |
| 2012-Q4 | 635376 | 73292 | 11.5 |
| 2013-Q1 | 618671 | 69074 | 11.2 |
| 2013-Q2 | 643944 | 70571 | 11 |
| 2013-Q3 | 619285 | 70820 | 11.4 |
| 2013-Q4 | 660338 | 71964 | 10.9 |
| 2014-Q1 | 639819 | 69690 | 10.9 |
| 2014-Q2 | 636583 | 72125 | 11.3 |
| 2014-Q3 | 646090 | 72614 | 11.2 |
| 2014-Q4 | 660101 | 74929 | 11.4 |
| 2015-Q1 | 650733 | 75524 | 11.6 |
| 2015-Q2 | 676090 | 72743 | 10.8 |
| 2015-Q3 | 669731 | 72564 | 10.8 |
| 2015-Q4 | 692632 | 70826 | 10.2 |
| 2016-Q1 | 704912 | 75138 | 10.7 |
| 2016-Q2 | 687696 | 72240 | 10.5 |
| 2016-Q3 | 703158 | 76054 | 10.8 |
| 2016-Q4 | 691004 | 74340 | 10.8 |
| 2017-Q1 | 726847 | 75721 | 10.4 |
| 2017-Q2 | 712970 | 76326 | 10.7 |
| 2017-Q3 | 756051 | 75934 | 10 |
| 2017-Q4 | 750017 | 76905 | 10.3 |
| 2018-Q1 | 775431 | 81833 | 10.6 |
| 2018-Q2 | 790725 | 81984 | 10.4 |
| 2018-Q3 | 790739 | 80846 | 10.2 |
| 2018-Q4 | 819236 | 79945 | 9.8 |
| 2019-Q1 | 859520 | 78408 | 9.1 |
| 2019-Q2 | 874271 | 79449 | 9.1 |
| 2019-Q3 | 872926 | 77523 | 8.9 |
| 2019-Q4 | 862674 | 77793 | 9 |
What it means for the hike — and what would prove this wrong
For the Fed, this picture cuts both ways. Record applications help explain the resilience officials keep citing: new firms eventually rent storefronts, buy equipment and hire, which supports exactly the demand-side strength that keeps inflation sticky. It also suggests the mechanism rate hikes rely on — making future plans more expensive to finance — is running into a wave of ventures whose upfront costs are low and whose financing needs are modest. That is a description, not a forecast: seven years of low-rate and high-rate regimes alike have now coincided with application totals far above the old normal, so the record alone cannot tell you what rates are doing to it.
For readers, the payoff is a dashboard with two dials. The first is the weekly application pace itself: if 2027 begins and filings are still clearing 120,000 a week, the demand story the Fed is fighting is intact. The second is the conversion data, whenever the Census Bureau publishes the pandemic-era cohorts — the single number that will reveal whether this was a golden age of American company creation or the largest pile of unfinished paperwork in statistical history. Given everything else in this week's news, betting on the paperwork seems safe either way.
Sources and methods
Analysis uses the pinned Census Bureau Business Formation Statistics snapshot (built 2026-08-23); weekly observations run through the week ending 2026-08-01 and are preliminary and subject to revision.
Weekly series are not seasonally adjusted. All 2019-vs-2026 comparisons use identical calendar windows (weeks ending in the Jan 7–Aug 10 span), so seasonal patterns affect both years equally; a separate February-onward check (+77.6%) confirms the January spike does not drive the result.
The seasonally adjusted national quarterly file in this snapshot ends with 2020-Q4 and the business-formations (conversion) series ends with 2019-Q4; claims about 2021–2026 therefore rely on the weekly record, and no post-2019 conversion rate is asserted.
Nine large states were compared (those extracts chosen for this analysis), not all 50; state figures use unadjusted weekly counts.
The analysis is descriptive. No causal effect is claimed between the Fed's rate decision, the Iran war, and application growth.
The digest reports same-day events; this research uses the most recent official data snapshot, which necessarily lags the news cycle by about six weeks.
Research completed 2026-09-17, for the September 16, 2026 news edition. The available source data may cover earlier periods; see the observation periods and source vintages above.