Research
The grapes are unsold. The alcohol bill is not.
The harvest no one wants
It is harvest time in Lodi, and Bill Berryhill is staring at merlot he cannot sell. Fortune, citing the Associated Press, reports U.S. wine case sales fell 23 percent from 2020 to 2025, California growers have taken about a quarter of peak vineyard acreage out of production, and roughly half this year's crop went into harvest without a buyer contract. Berryhill cannot find homes for grapes on 200 of 500 acres and plans to rip out 50. "The kids just aren't drinking as much," he said.
That is a grower's diagnosis. It is not, by itself, a reading of the state's books. Wine grapes are a slice of California agriculture. Wineries are a slice of beverage manufacturing, which also bottles beer, spirits and soda. And the alcohol people buy at the store is not the same as the alcohol they used to order with dinner. The question for readers is narrower and more useful: on the official ledgers, how big is the farm-and-bottle economy that this glut is hitting, has household alcohol spending actually fallen, and have the jobs already turned?
Households did not put the bottle down
They did not, at least not in current dollars, and not if you count beer, spirits and wine together. Bureau of Economic Analysis figures for alcoholic beverages purchased for off-premises consumption — grocery-store and liquor-store spending, not bar tabs — show California households spent $29.5 billion in 2024. That was 12.9 percent of the U.S. total of $228.7 billion. Per person, it was $749 in California versus $673 nationwide.
The pandemic did what everyone remembers: people stocked up at home. California's off-premises alcohol bill jumped 27 percent from 2019 to 2021, from $20.7 billion to $26.3 billion. What it did not do, in these books, is crash afterward. Spending was still rising in 2024, up 12 percent from 2021. Per person, California's 2024 figure was 43 percent above 2019. The national increase was 37 percent. Inflation is in those numbers. So is a shift from restaurants to living rooms. What is not in them is a collapse of the entire alcohol receipt.
Wine country is not the whole West Coast, and California is not even the thirstiest state in this sample. In 2024 Oregon spent $853 per person on off-premises alcohol and Washington $814. Florida was almost even with California at $745. Texas was $693, New York $609, Wisconsin $598. If younger drinkers have swapped cabernet for seltzers and cannabis, as growers told Fortune, that substitution can wreck a vineyard while leaving the liquor-aisle total intact. The BEA series cannot separate wine from beer. That is the point, not a footnote.
Californians still spend more on off-premises alcohol, not less

View exact chart values
| year | ca_per_capita | us_per_capita | ca_index_2019 | us_index_2019 | ca_millions | us_millions |
|---|---|---|---|---|---|---|
| 1997 | 221 | 226 | 42.3 | 45.9 | 7180.3 | 61598.4 |
| 1998 | 229 | 236 | 43.8 | 47.9 | 7554.4 | 64967.8 |
| 1999 | 248 | 252 | 47.4 | 51.2 | 8305.9 | 70234.9 |
| 2000 | 274 | 273 | 52.4 | 55.6 | 9300.6 | 77135.7 |
| 2001 | 291 | 286 | 55.6 | 58.1 | 10023 | 81489.2 |
| 2002 | 305 | 293 | 58.4 | 59.6 | 10648.3 | 84374.3 |
| 2003 | 308 | 296 | 59 | 60.1 | 10862.4 | 85727.7 |
| 2004 | 313 | 305 | 60 | 62 | 11150.9 | 89269 |
| 2005 | 322 | 313 | 61.5 | 63.7 | 11525.1 | 92550.6 |
| 2006 | 341 | 329 | 65.2 | 66.9 | 12266.5 | 98231.1 |
| 2007 | 357 | 339 | 68.3 | 69 | 12947.8 | 102215.4 |
| 2008 | 352 | 338 | 67.4 | 68.8 | 12888.6 | 102877 |
| 2009 | 338 | 337 | 64.7 | 68.6 | 12502 | 103433.6 |
| 2010 | 350 | 349 | 67 | 70.9 | 13076.4 | 107894.8 |
| 2011 | 356 | 353 | 68.2 | 71.8 | 13415.2 | 110122.7 |
| 2012 | 366 | 363 | 70.1 | 73.9 | 13903.8 | 114172.2 |
| 2013 | 376 | 371 | 72 | 75.3 | 14407.5 | 117369.4 |
| 2014 | 400 | 390 | 76.6 | 79.3 | 15464.8 | 124497.9 |
| 2015 | 432 | 412 | 82.7 | 83.7 | 16839.7 | 132445.6 |
| 2016 | 453 | 432 | 86.6 | 87.9 | 17760.4 | 140161.3 |
| 2017 | 473 | 451 | 90.5 | 91.8 | 18646.6 | 147455.6 |
| 2018 | 497 | 471 | 95.2 | 95.8 | 19667.3 | 154838.2 |
| 2019 | 523 | 492 | 100 | 100 | 20669.6 | 162413.2 |
| 2020 | 611 | 571 | 116.9 | 116.1 | 24143.3 | 189301.7 |
| 2021 | 672 | 613 | 128.6 | 124.6 | 26321 | 203516.3 |
| 2022 | 704 | 642 | 134.7 | 130.5 | 27541.3 | 214351.6 |
| 2023 | 726 | 658 | 138.9 | 133.9 | 28436.3 | 221750.4 |
| 2024 | 749 | 673 | 143.2 | 136.8 | 29466.8 | 228732.5 |
West Coast states lead this sample on alcohol spending per person

View exact chart values
| state | alcohol_millions | population | per_capita_dollars | change_from_2020_pct |
|---|---|---|---|---|
| Oregon | 3638.1 | 4265324 | 853 | 20 |
| Washington | 6455.2 | 7927958 | 814 | 16.2 |
| California | 29466.8 | 39364774 | 749 | 22 |
| Florida | 17332.2 | 23265838 | 745 | 31.3 |
| Texas | 21704.4 | 31318578 | 693 | 26.7 |
| New York | 12185.6 | 20001419 | 609 | 16.3 |
| Wisconsin | 3565.3 | 5957168 | 598 | 20.6 |
| United States | 228732.5 | 340003797 | 673 | 20.8 |
A $35 billion farm state, not a wine monoculture
California remains a farm power. BEA state GDP puts farm output — all crop and animal production, not grapes alone — at $35.1 billion in 2024, 16.3 percent of U.S. farm GDP. That is a lot of almonds, milk, lettuce and cattle standing next to the unsold merlot. It is also a small slice of California's overall economy, under 1 percent of statewide GDP. Growers can be drowning in one crop while the state's output ledger barely notices.
The real-output path is jumpy. Chained 2017-dollar farm GDP in California fell to $20.1 billion in 2022, then recovered to $25.8 billion in 2024. Current-dollar output kept climbing to that $35.1 billion high. Farm proprietors' income, which covers sole proprietors and partnerships and excludes corporate farms, tells a harsher story: it dropped to $6.3 billion in 2023 before bouncing to $11.9 billion in 2024. A third-generation vineyard can have a brutal year inside a farm sector that, on paper, is still enormous.
The factory side is similar. Food, beverage and tobacco product manufacturing in California produced $34.7 billion of GDP in 2024, 9.6 percent of the U.S. industry. Real output in that bundle was $28.5 billion in chained 2017 dollars, a shade below $29.1 billion in 2021. Wineries sit inside that bundle with breweries, bottling plants and tobacco. The official industry is not shrinking fast. It is also not a clean window onto Napa and Lodi.
California farm output is large. It is also jumpy.

View exact chart values
| year | ca_current_millions | us_current_millions | ca_share_pct | ca_real_2017_millions | ca_share_of_state_gdp_pct |
|---|---|---|---|---|---|
| 1997 | 14234.1 | 88135 | 16.15 | 14151.2 | 1.333 |
| 1998 | 12916.1 | 80020 | 16.14 | 13827.6 | 1.129 |
| 1999 | 13254.4 | 71655 | 18.5 | 16124.6 | 1.069 |
| 2000 | 13780.7 | 76657 | 17.98 | 18310.7 | 1.017 |
| 2001 | 13549.5 | 79028 | 17.15 | 16465.2 | 0.987 |
| 2002 | 14210.7 | 75073 | 18.93 | 18917.6 | 1.001 |
| 2003 | 16050 | 92417 | 17.37 | 18837.1 | 1.071 |
| 2004 | 19806 | 120924 | 16.38 | 19668.4 | 1.25 |
| 2005 | 19745.4 | 106317 | 18.57 | 23484.8 | 1.162 |
| 2006 | 17301.3 | 98279 | 17.6 | 21763.7 | 0.955 |
| 2007 | 20923.7 | 117852 | 17.75 | 19584.9 | 1.101 |
| 2008 | 18125 | 118766 | 15.26 | 16799.1 | 0.931 |
| 2009 | 17596.8 | 102461 | 17.17 | 21779.2 | 0.936 |
| 2010 | 20539.3 | 117043 | 17.55 | 21640 | 1.059 |
| 2011 | 24141.1 | 151135 | 15.97 | 18841.8 | 1.199 |
| 2012 | 25165.8 | 148752 | 16.92 | 19012.6 | 1.193 |
| 2013 | 28826.8 | 184472 | 15.63 | 19765.6 | 1.297 |
| 2014 | 30792 | 167051 | 18.43 | 22946.3 | 1.315 |
| 2015 | 26979.3 | 146259 | 18.45 | 24870.6 | 1.085 |
| 2016 | 25514.2 | 130270 | 19.59 | 28179.9 | 0.986 |
| 2017 | 27139.1 | 138733 | 19.56 | 27139.1 | 0.99 |
| 2018 | 26245.6 | 136825 | 19.18 | 27649.1 | 0.905 |
| 2019 | 24085.5 | 122630 | 19.64 | 25806.5 | 0.785 |
| 2020 | 24650.2 | 120506 | 20.46 | 27496.3 | 0.802 |
| 2021 | 28862.5 | 185707 | 15.54 | 22720 | 0.844 |
| 2022 | 33701.8 | 247070 | 13.64 | 20079.8 | 0.931 |
| 2023 | 31338.9 | 218198 | 14.36 | 21518 | 0.819 |
| 2024 | 35079 | 215830 | 16.25 | 25760.2 | 0.867 |
California farm proprietors took a 2023 punch, then a 2024 bounce

View exact chart values
| year | millions |
|---|---|
| 1997 | 4486.4 |
| 1998 | 3719 |
| 1999 | 3769.4 |
| 2000 | 3601.8 |
| 2001 | 3174.6 |
| 2002 | 3988.3 |
| 2003 | 5111.8 |
| 2004 | 6882.3 |
| 2005 | 6600.3 |
| 2006 | 4701.6 |
| 2007 | 7540.9 |
| 2008 | 5326.8 |
| 2009 | 6070 |
| 2010 | 6972.5 |
| 2011 | 9975 |
| 2012 | 11249.4 |
| 2013 | 13707.5 |
| 2014 | 16238.3 |
| 2015 | 14921.7 |
| 2016 | 12219 |
| 2017 | 11967.8 |
| 2018 | 9124.1 |
| 2019 | 7954.8 |
| 2020 | 10699.1 |
| 2021 | 9490.8 |
| 2022 | 9459.8 |
| 2023 | 6288.6 |
| 2024 | 11862.7 |
The jobs turned first
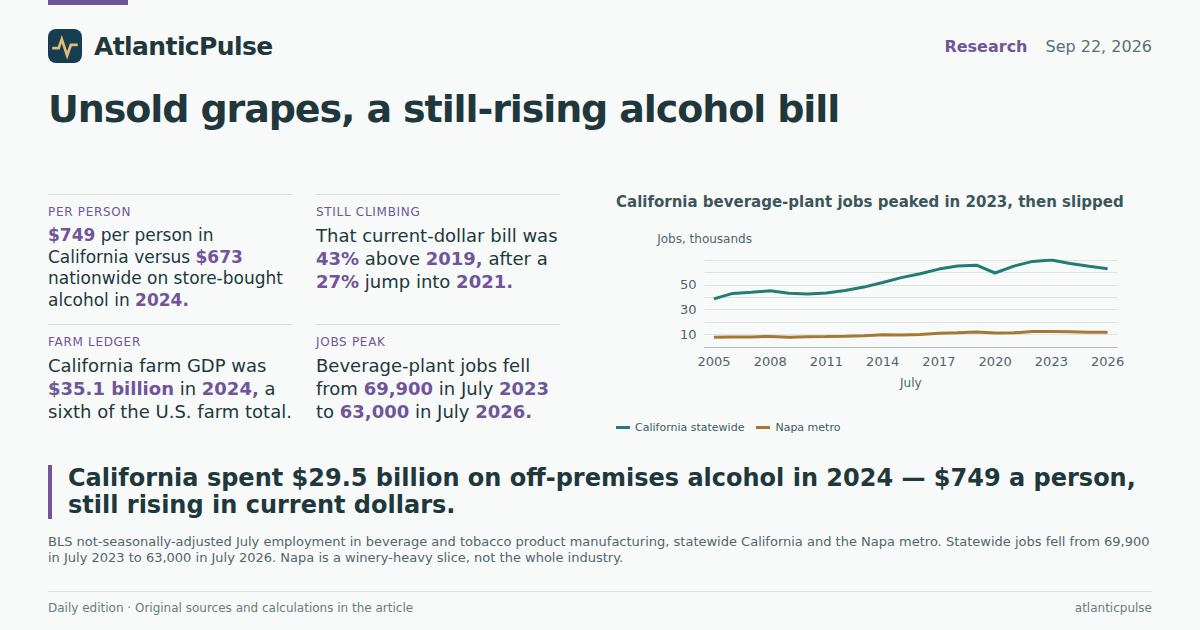
Employment is the ledger that already looks like a hangover. BLS state figures for beverage and tobacco product manufacturing, not seasonally adjusted, show 63,000 California jobs in July 2026, down from a July 2023 peak of 69,900. That is a 10 percent drop in three years, and it leaves the industry a little below July 2019. Napa, a winery-heavy metro rather than a proxy for the whole state, went from 12,500 jobs in July 2023 to 11,900 in July 2026.
Nationally, seasonally adjusted beverage-manufacturing jobs — a cleaner series, but U.S. rather than California — peaked around 330,000 in July 2024 and were 310,300 in July 2025. California's downturn is not a rounding error on a still-booming bottling belt. It is a modest, visible retreat from a pandemic-era bulge, arriving just as growers say they are dropping fruit on the ground.
None of this proves the kids caused the glut, or that ripping out vines will fix it. Case sales, grape prices and winery profits are not in these tables. What the books do show is a mismatch: household off-premises alcohol spending in current dollars was still setting highs through 2024, California still accounts for about a sixth of U.S. farm GDP, and the beverage-plant payroll has already given back its 2023 peak. The grapes on the ground are a wine problem. They are not yet a disappearance of California's farm-and-bottle economy.
California beverage-plant jobs peaked in 2023, then slipped

View exact chart values
| year | ca_nsa_thousands | napa_nsa_thousands | us_sa_thousands |
|---|---|---|---|
| 2005 | 38.7 | 7.9 | 165.3 |
| 2006 | 43.1 | 8.1 | 169.7 |
| 2007 | 44 | 8.1 | 177.2 |
| 2008 | 45.2 | 8.5 | 177.7 |
| 2009 | 43.3 | 7.9 | 168.1 |
| 2010 | 42.6 | 8.2 | 165.5 |
| 2011 | 43.5 | 8.4 | 171.6 |
| 2012 | 45.5 | 8.6 | 179.4 |
| 2013 | 48.2 | 9.1 | 184.9 |
| 2014 | 51.9 | 9.8 | 197.9 |
| 2015 | 55.8 | 9.7 | 215.5 |
| 2016 | 59 | 10.1 | 235.8 |
| 2017 | 62.7 | 11.1 | 252 |
| 2018 | 65.2 | 11.5 | 262.2 |
| 2019 | 65.8 | 12 | 272.8 |
| 2020 | 59.5 | 11.2 | 256.4 |
| 2021 | 65.1 | 11.4 | 291.2 |
| 2022 | 68.9 | 12.4 | 315.5 |
| 2023 | 69.9 | 12.5 | 325.6 |
| 2024 | 67.2 | 12.3 | 330 |
| 2025 | 64.9 | 11.9 | 310.3 |
| 2026 | 63 | 11.9 | — |
Sources and methods
Observation windows: BEA off-premises alcoholic-beverage PCE and population through calendar 2024 (PCE vintage bea-sapce-2025-09-26; income/GDP vintage bea-regional-state-annual-2026-04-09). BEA farm GDP, food-beverage-tobacco manufacturing GDP, and farm proprietors' income through 2024. BLS SAE beverage and tobacco manufacturing employment, not seasonally adjusted, January 2005–July 2026 (snapshot 2026-08-24). CES U.S. beverage manufacturing, seasonally adjusted, is cited only through July 2025 because July 2026 was not in the extract.
Per-person alcohol spending is state PCE in current dollars divided by BEA population. It is not a household average, not wine-only, and not inflation-adjusted. Off-premises spending excludes bars and restaurants. Farm GDP is all crop and animal production. Food, beverage and tobacco manufacturing is broader than wineries. Farm proprietors' income excludes corporate farms. July NSA jobs are used for California and Napa so harvest-season staffing is visible; they are not seasonally adjusted. Missing values were not treated as zero. No causal claim is made that drinking habits, tariffs or cannabis caused the grape glut.
Research completed 2026-09-23, for the September 22, 2026 news edition. The available source data may cover earlier periods; see the observation periods and source vintages above.