Research
The fortune is in the price, not the payroll
A 36 percent jump in two quarters
On Friday, ExxonMobil reported a $15.4 billion third-quarter profit and Chevron $9.9 billion, more than double year-ago levels, as oil stayed above $100 a barrel and refining margins soared. President Donald Trump, campaigning four days before the midterms, said U.S. energy companies were “making a freaking fortune.” The question for anyone who is not a shareholder is simpler: has that fortune already shown up as a bigger American oil-and-gas industry, or mainly as a more expensive one?
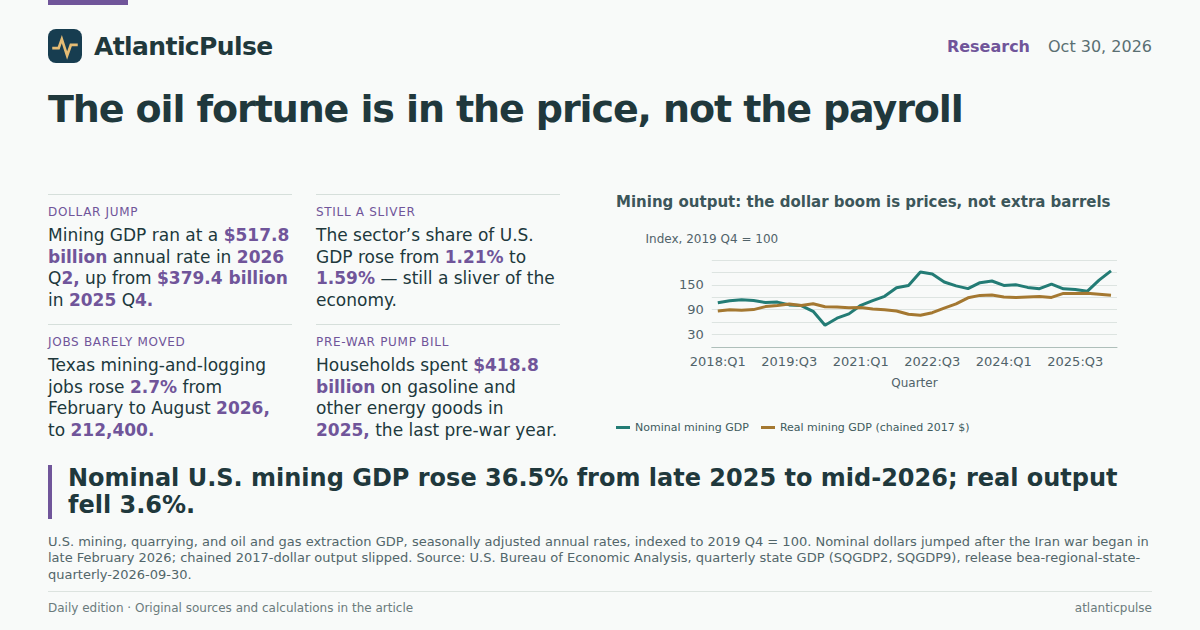
The last official industry accounts that can answer that are the Bureau of Economic Analysis quarterly state GDP files through 2026 Q2, published at a seasonally adjusted annual rate. Those books put U.S. mining, quarrying, and oil and gas extraction at $517.8 billion in current dollars in the second quarter — up 36.5% from $379.4 billion in 2025 Q4, the last full quarter before the Iran war that began on February 28. The sector’s share of U.S. GDP rose from 1.21% to 1.59%. That is a real jump. It is not a new industrial order. Mining was 1.97% of GDP at the 2022 price spike and still less than 2% of the economy even now.
Those dollar totals are annualized flows, not cash Exxon can deposit. They also mix oil and gas with coal, ores and quarry stone. Louisiana’s mining series is suppressed in this vintage, so it is omitted rather than treated as zero. None of that changes the direction: between the last pre-war quarter and mid-2026, the official mining bill got a lot larger, very quickly.
Mining is still a sliver of the U.S. economy — even after the 2026 price spike

View exact chart values
| quarter | mining_nom_bil | mining_real_bil | share_pct | index_nom_2019q4 | index_real_2019q4 | contrib_pp |
|---|---|---|---|---|---|---|
| 2018:Q1 | 300.9 | 270.1 | 1.48 | 106.7 | 86.7 | -0.18 |
| 2018:Q2 | 314.6 | 279.9 | 1.53 | 111.6 | 89.8 | 0.21 |
| 2018:Q3 | 322 | 276.5 | 1.55 | 114.2 | 88.7 | -0.05 |
| 2018:Q4 | 316.5 | 281.5 | 1.51 | 112.2 | 90.3 | 0.16 |
| 2019:Q1 | 302.5 | 303.4 | 1.43 | 107.3 | 97.4 | 0.54 |
| 2019:Q2 | 305.3 | 312 | 1.43 | 108.3 | 100.1 | 0.21 |
| 2019:Q3 | 286.3 | 322.8 | 1.32 | 101.5 | 103.6 | 0.2 |
| 2019:Q4 | 282 | 311.6 | 1.29 | 100 | 100 | -0.21 |
| 2020:Q1 | 242.9 | 325 | 1.12 | 86.1 | 104.3 | 0.13 |
| 2020:Q2 | 147.3 | 302.9 | 0.74 | 52.3 | 97.2 | -0.19 |
| 2020:Q3 | 196 | 300.3 | 0.9 | 69.5 | 96.4 | 0.08 |
| 2020:Q4 | 225.1 | 295.6 | 1.02 | 79.8 | 94.9 | 0.07 |
| 2021:Q1 | 283.6 | 297.5 | 1.25 | 100.6 | 95.5 | 0.25 |
| 2021:Q2 | 315.2 | 285.2 | 1.34 | 111.8 | 91.5 | -0.01 |
| 2021:Q3 | 345.6 | 280.8 | 1.44 | 122.5 | 90.1 | 0.09 |
| 2021:Q4 | 403.7 | 270.8 | 1.63 | 143.1 | 86.9 | -0.09 |
| 2022:Q1 | 418.3 | 246.7 | 1.66 | 148.3 | 79.2 | -0.54 |
| 2022:Q2 | 510.1 | 238.7 | 1.97 | 180.9 | 76.6 | -0.2 |
| 2022:Q3 | 496.3 | 257.9 | 1.88 | 176 | 82.8 | 0.58 |
| 2022:Q4 | 442.7 | 292.8 | 1.65 | 157 | 94 | 0.84 |
| 2023:Q1 | 415.7 | 324.3 | 1.53 | 147.4 | 104.1 | 0.55 |
| 2023:Q2 | 397.5 | 370.2 | 1.44 | 141 | 118.8 | 0.72 |
| 2023:Q3 | 437.5 | 388.1 | 1.56 | 155.1 | 124.5 | 0.26 |
| 2023:Q4 | 449.6 | 390.2 | 1.58 | 159.4 | 125.2 | 0.04 |
| 2024:Q1 | 419.1 | 375.2 | 1.46 | 148.6 | 120.4 | -0.2 |
| 2024:Q2 | 424.4 | 372.6 | 1.45 | 150.5 | 119.6 | -0.02 |
| 2024:Q3 | 405.9 | 376.3 | 1.37 | 143.9 | 120.7 | 0.05 |
| 2024:Q4 | 397.1 | 379.2 | 1.33 | 140.8 | 121.7 | 0.02 |
| 2025:Q1 | 427.3 | 373.4 | 1.42 | 151.5 | 119.8 | -0.13 |
| 2025:Q2 | 395.8 | 403.1 | 1.29 | 140.4 | 129.4 | 0.38 |
| 2025:Q3 | 392.2 | 403.3 | 1.26 | 139.1 | 129.4 | -0.02 |
| 2025:Q4 | 379.4 | 404 | 1.21 | 134.5 | 129.7 | 0 |
| 2026:Q1 | 455.6 | 397.4 | 1.43 | 161.5 | 127.5 | -0.09 |
| 2026:Q2 | 517.8 | 389.6 | 1.59 | 183.6 | 125 | -0.12 |
The barrels did not follow the dollars
Strip out prices and the boom shrinks. In chained 2017 dollars, U.S. mining GDP fell 3.6% from 2025 Q4 to 2026 Q2. Indexed to 2019 Q4, nominal mining output stood at 183.6 in 2026 Q2; real output was 125.0. The industry is producing more than it did before the pandemic in volume terms, but the 2026 leap is a revaluation. BEA’s own contributions table, which is the right way to ask whether mining added to real growth, shows the sector subtracting 0.09 percentage points from real GDP in 2026 Q1 and 0.12 points in Q2.
That is the opposite of a wartime production surge. It is what a price spike looks like when wells are already running and the extra money is coming from the same barrels. The 2022 episode rhymes: nominal mining GDP peaked near $510 billion in 2022 Q2 while real output was still below its 2019 level. The 2026 rebound in dollars has now slightly topped that 2022 nominal peak; the real series has not. Anyone treating the Exxon and Chevron prints as proof that America is pumping a lot more oil is reading a price list as a production log.
Mining output: the dollar boom is prices, not extra barrels

View exact chart values
| quarter | mining_nom_bil | mining_real_bil | share_pct | index_nom_2019q4 | index_real_2019q4 | contrib_pp |
|---|---|---|---|---|---|---|
| 2018:Q1 | 300.9 | 270.1 | 1.48 | 106.7 | 86.7 | -0.18 |
| 2018:Q2 | 314.6 | 279.9 | 1.53 | 111.6 | 89.8 | 0.21 |
| 2018:Q3 | 322 | 276.5 | 1.55 | 114.2 | 88.7 | -0.05 |
| 2018:Q4 | 316.5 | 281.5 | 1.51 | 112.2 | 90.3 | 0.16 |
| 2019:Q1 | 302.5 | 303.4 | 1.43 | 107.3 | 97.4 | 0.54 |
| 2019:Q2 | 305.3 | 312 | 1.43 | 108.3 | 100.1 | 0.21 |
| 2019:Q3 | 286.3 | 322.8 | 1.32 | 101.5 | 103.6 | 0.2 |
| 2019:Q4 | 282 | 311.6 | 1.29 | 100 | 100 | -0.21 |
| 2020:Q1 | 242.9 | 325 | 1.12 | 86.1 | 104.3 | 0.13 |
| 2020:Q2 | 147.3 | 302.9 | 0.74 | 52.3 | 97.2 | -0.19 |
| 2020:Q3 | 196 | 300.3 | 0.9 | 69.5 | 96.4 | 0.08 |
| 2020:Q4 | 225.1 | 295.6 | 1.02 | 79.8 | 94.9 | 0.07 |
| 2021:Q1 | 283.6 | 297.5 | 1.25 | 100.6 | 95.5 | 0.25 |
| 2021:Q2 | 315.2 | 285.2 | 1.34 | 111.8 | 91.5 | -0.01 |
| 2021:Q3 | 345.6 | 280.8 | 1.44 | 122.5 | 90.1 | 0.09 |
| 2021:Q4 | 403.7 | 270.8 | 1.63 | 143.1 | 86.9 | -0.09 |
| 2022:Q1 | 418.3 | 246.7 | 1.66 | 148.3 | 79.2 | -0.54 |
| 2022:Q2 | 510.1 | 238.7 | 1.97 | 180.9 | 76.6 | -0.2 |
| 2022:Q3 | 496.3 | 257.9 | 1.88 | 176 | 82.8 | 0.58 |
| 2022:Q4 | 442.7 | 292.8 | 1.65 | 157 | 94 | 0.84 |
| 2023:Q1 | 415.7 | 324.3 | 1.53 | 147.4 | 104.1 | 0.55 |
| 2023:Q2 | 397.5 | 370.2 | 1.44 | 141 | 118.8 | 0.72 |
| 2023:Q3 | 437.5 | 388.1 | 1.56 | 155.1 | 124.5 | 0.26 |
| 2023:Q4 | 449.6 | 390.2 | 1.58 | 159.4 | 125.2 | 0.04 |
| 2024:Q1 | 419.1 | 375.2 | 1.46 | 148.6 | 120.4 | -0.2 |
| 2024:Q2 | 424.4 | 372.6 | 1.45 | 150.5 | 119.6 | -0.02 |
| 2024:Q3 | 405.9 | 376.3 | 1.37 | 143.9 | 120.7 | 0.05 |
| 2024:Q4 | 397.1 | 379.2 | 1.33 | 140.8 | 121.7 | 0.02 |
| 2025:Q1 | 427.3 | 373.4 | 1.42 | 151.5 | 119.8 | -0.13 |
| 2025:Q2 | 395.8 | 403.1 | 1.29 | 140.4 | 129.4 | 0.38 |
| 2025:Q3 | 392.2 | 403.3 | 1.26 | 139.1 | 129.4 | -0.02 |
| 2025:Q4 | 379.4 | 404 | 1.21 | 134.5 | 129.7 | 0 |
| 2026:Q1 | 455.6 | 397.4 | 1.43 | 161.5 | 127.5 | -0.09 |
| 2026:Q2 | 517.8 | 389.6 | 1.59 | 183.6 | 125 | -0.12 |
Alaska’s share, Texas’s pile
The national 1.59% share hides a very lumpy map. In 2026 Q2, mining accounted for 18.0% of Alaska’s current-dollar GDP, 17.0% of West Virginia’s, 16.2% of North Dakota’s, 15.0% of New Mexico’s and 14.0% of Wyoming’s. Oklahoma was at 11.1%. Texas, the giant, was only 8.2% — because Texas is a much bigger, more diversified economy — but it still booked $256.0 billion of mining GDP, about half the U.S. total. Colorado, a large energy state that is not an energy economy, was 3.8%. Every one of those states saw mining GDP jump 33% to 39% from 2025 Q4 to 2026 Q2. The price move was national. The exposure is not.
West Virginia’s ranking is a reminder not to read “mining” as a synonym for crude. The NAICS 21 sector includes coal. The dollar jump still tracks the oil-price shock in the oil states; it just is not a pure wellhead census. And chained-dollar industry totals are the wrong tool for these shares, which is why the chart uses current dollars. Adding up state mining GDP will not exactly equal the U.S. figure anyway: BEA warns that chained-dollar components do not add, and even current-dollar state sums can differ from the national account because of industry and residual treatments.
Where the fortune actually sits: mining’s share of state GDP

View exact chart values
| state | mining_bil | share_pct | chg_from_2025q4_pct |
|---|---|---|---|
| Colorado | 23.2 | 3.81 | 36.6 |
| Texas | 256 | 8.15 | 36.1 |
| Oklahoma | 32.6 | 11.09 | 36.5 |
| Wyoming | 7.9 | 13.95 | 39.2 |
| New Mexico | 24.3 | 15 | 37.9 |
| North Dakota | 14.2 | 16.18 | 36.1 |
| West Virginia | 20.5 | 17.04 | 33.9 |
| Alaska | 14.3 | 17.99 | 33.3 |
The payroll that did not boom
If the fortune were extra work, it would show up in oil-country employment. It barely does. Texas mining-and-logging jobs, a supersector that in Texas is overwhelmingly oil and gas, stood at 206,800 in February 2026, the month the war began, and 212,400 in August, according to the Bureau of Labor Statistics state payroll survey. That is a 2.7% gain over six months, against a 36.5% jump in national mining GDP in two quarters. The series is still well below 254,700 in January 2019. Wyoming’s much smaller mining-and-logging payroll went from 15,300 in February to 15,400 in August — a rounding error.
The employment snapshot ends in August 2026, so it does not capture whatever hiring, if any, arrived with the third-quarter earnings prints. It is still the right test of the “fortune” talk through the first six months of the war. Higher wellhead prices can fatten profits without adding shifts. That is what the books show so far: a price boom sitting on a workforce that never fully came back from 2020.
Texas mining payrolls barely budged after the war started

View exact chart values
| month | texas_thousands | wyoming_thousands |
|---|---|---|
| 2019-01 | 254.7 | 21.1 |
| 2020-01 | 233.7 | 19.3 |
| 2021-01 | 173.6 | 13.6 |
| 2022-01 | 189.6 | 14.9 |
| 2023-01 | 212.8 | 16.4 |
| 2024-01 | 218.7 | 16.4 |
| 2025-01 | 213.7 | 15.8 |
| 2026-01 | 208 | 14.9 |
| 2026-02 | 206.8 | 15.3 |
| 2026-03 | 208.1 | 15.2 |
| 2026-04 | 209.9 | 15.1 |
| 2026-05 | 213.8 | 15.4 |
| 2026-06 | 212.7 | 15.5 |
| 2026-07 | 211.9 | 15.4 |
| 2026-08 | 212.4 | 15.4 |
The gasoline bill the official books have not caught
Households do not buy mining GDP. They buy gasoline. The last complete state personal consumption accounts for that bill end in 2025 — before the Iran war. In that last pre-war year, Americans spent $418.8 billion on gasoline and other energy goods, or $1,225 a person. That was down from the 2022 peak of $514.6 billion, or $1,541 a person, when the last oil shock was already in the rear-view mirror of the annual accounts.
The lag matters. Trump’s “freaking fortune” line and the Exxon-Chevron prints are 2026 Q3 news. The mining GDP files already include two war quarters and show the producer side revaluing fast. The household gasoline files do not yet include those quarters at all. Anyone comparing Friday’s oil profits with “what families spend at the pump” using 2025 PCE is mixing a wartime price with a peacetime receipt. The honest statement is narrower, and more useful: before the war, the official gasoline bill had been easing for three years. After two quarters of war, the official mining bill was up more than a third in dollars and down in volume. The jobs did not boom. The next PCE vintage will show whether households got the rest of the invoice.
The last official gasoline bill was still shrinking

View exact chart values
| year | total_bil | per_capita |
|---|---|---|
| 2015 | 318.8 | 991 |
| 2016 | 287 | 885 |
| 2017 | 324 | 992 |
| 2018 | 366.7 | 1116 |
| 2019 | 352.5 | 1067 |
| 2020 | 258.5 | 779 |
| 2021 | 385.7 | 1162 |
| 2022 | 514.6 | 1541 |
| 2023 | 464.9 | 1381 |
| 2024 | 441.6 | 1299 |
| 2025 | 418.8 | 1225 |
Sources and methods
BEA quarterly state GDP (SQGDP2 current dollars, SQGDP9 chained 2017 dollars, SQGDP11 contributions) uses the pinned snapshot dated 2026-10-08, source release bea-regional-state-quarterly-2026-09-30. Values are seasonally adjusted annual rates, not realized quarterly totals. Mining is NAICS 21 (oil and gas, coal, ores, quarrying and support). Current-dollar shares are used because chained-dollar industry components are not additive. Louisiana mining GDP is suppressed ((D)) from 2025 Q1 through 2026 Q2 in this vintage and is omitted, not zeroed. Timing around the Iran war (began February 28, 2026) is descriptive; Q1 2026 mixes one pre-war month with two war months. No causal effect is inferred from the coincident rise in nominal mining GDP.
BEA state PCE for gasoline and other energy goods (SAPCE1 totals, SAPCE2 per capita) is annual through 2025, snapshot 2026-10-07, release bea-sapce-2026-09-30. That vintage closes before the Iran war and cannot measure 2026 pump prices. Per capita figures are dollars per person, not household averages.
BLS State and Area Employment mining-and-logging payrolls are statewide, seasonally adjusted, in thousands. The pinned snapshot is bls-sm-snapshot-2026-08-24, so the last month is August 2026. In Texas the supersector is overwhelmingly oil and gas; it still includes logging and non-oil mining. Wyoming’s series is a small mixed mining state and is cited only as a payroll check, not as a second oil-volume measure.
Corporate earnings cited in the article come from the edition’s stored news evidence, not from BEA. Mining GDP is not Exxon’s or Chevron’s profit.
Research completed 2026-10-31, for the October 30, 2026 news edition. The available source data may cover earlier periods; see the observation periods and source vintages above.