Research
The Flat Line Under Minnesota's Report Card
The scorecard
Minnesota released its spring test results on Wednesday, and the numbers landed with a familiar thud. Fewer than half of students met the state's standards: 48.6 percent in reading and 44.9 percent in math, the math figure down from 45.21 percent in 2025. The Minnesota Comprehensive Assessments were administered from March 2 to May 8 — a stretch when Operation Metro Surge was still echoing through classrooms. More than 80 percent of school leaders told a University of Minnesota survey that the immigration-enforcement surge hurt students' ability to learn, more than 1,000 students dropped out or unenrolled, and in Bloomington 16 percent of middle and high schoolers said enforcement had touched them or their families. Participation itself is soft: roughly 75 percent of high schoolers take the math test, and in some districts as many as 60 percent of students opt out entirely.
Education Commissioner Willie Jett framed the release with the sentence that should bother Minnesotans most: "We're asking more of our students and teachers." A state that says it is asking more is making a claim about inputs, too — and the most countable input a school system has is its payroll. So this analysis pulled the official books: federal State and Area Employment records for local-government education jobs, the category that covers school districts, back to 2000 and forward through the latest monthly readings, alongside the Bureau of Economic Analysis' household spending accounts through 2024. What the ledger shows is a system being asked to do more while, in headcount terms, doing more or less exactly what it did a quarter century ago.
A payroll that stopped moving
Start with the long view. Minnesota's local-government education employment averaged 138,000 jobs in 2000. In 2025 it averaged 144,200. That is growth of 4.5 percent across twenty-five years — about a sixth of a percent per year, a rounding error wearing a lanyard. The all-time high in the window came not last year but in 2018, at 144,500. The pandemic knocked the payroll down to 135,100 in 2020, and the recovery since has been just enough to claw back to roughly where things stood when flip phones were popular. Whatever else has changed in Minnesota schools since 2000 — standards, devices, the internet's takeover of childhood — the number of people employed to do the work has not.
The more telling number is the share. Each May, when school staffing peaks, Minnesota's local-government education workers have made up a shrinking slice of the state's job market: 5.45 percent of nonfarm employment in May 2010, 5.01 percent in May 2019, 4.96 percent in May 2026, with the low point — 4.86 percent — coming in 2023. It is not that schools shed jobs this decade; May staffing is actually up 1.5 percent since May 2019, from 150,500 to 152,700. It is that everything else grew faster. Total nonfarm employment rose 2.4 percent over the same stretch. Minnesota still employs one person in twenty in its public schools at peak season. It employs a smaller one-in-twenty every year.
Minnesota's school payroll has been flat for a quarter century

View exact chart values
| year | jobs_thousands |
|---|---|
| 2000 | 138 |
| 2001 | 134 |
| 2002 | 135.4 |
| 2003 | 134.8 |
| 2004 | 134 |
| 2005 | 135.5 |
| 2006 | 134.6 |
| 2007 | 135 |
| 2008 | 136 |
| 2009 | 136.4 |
| 2010 | 135 |
| 2011 | 134.3 |
| 2012 | 134.6 |
| 2013 | 135.9 |
| 2014 | 139.1 |
| 2015 | 140.9 |
| 2016 | 143 |
| 2017 | 144.3 |
| 2018 | 144.5 |
| 2019 | 143.9 |
| 2020 | 135.1 |
| 2021 | 135.5 |
| 2022 | 138.1 |
| 2023 | 140 |
| 2024 | 143 |
| 2025 | 144.2 |
Schools' slice of the Minnesota job market keeps shrinking

View exact chart values
| year | share_pct |
|---|---|
| 2010 | 5.45 |
| 2011 | 5.32 |
| 2012 | 5.28 |
| 2013 | 5.24 |
| 2014 | 5.19 |
| 2015 | 5.16 |
| 2016 | 5.14 |
| 2017 | 5.06 |
| 2018 | 5.07 |
| 2019 | 5.01 |
| 2020 | 5.12 |
| 2021 | 4.89 |
| 2022 | 4.87 |
| 2023 | 4.86 |
| 2024 | 4.92 |
| 2025 | 4.89 |
| 2026 | 4.96 |
Mid-pack among neighbors
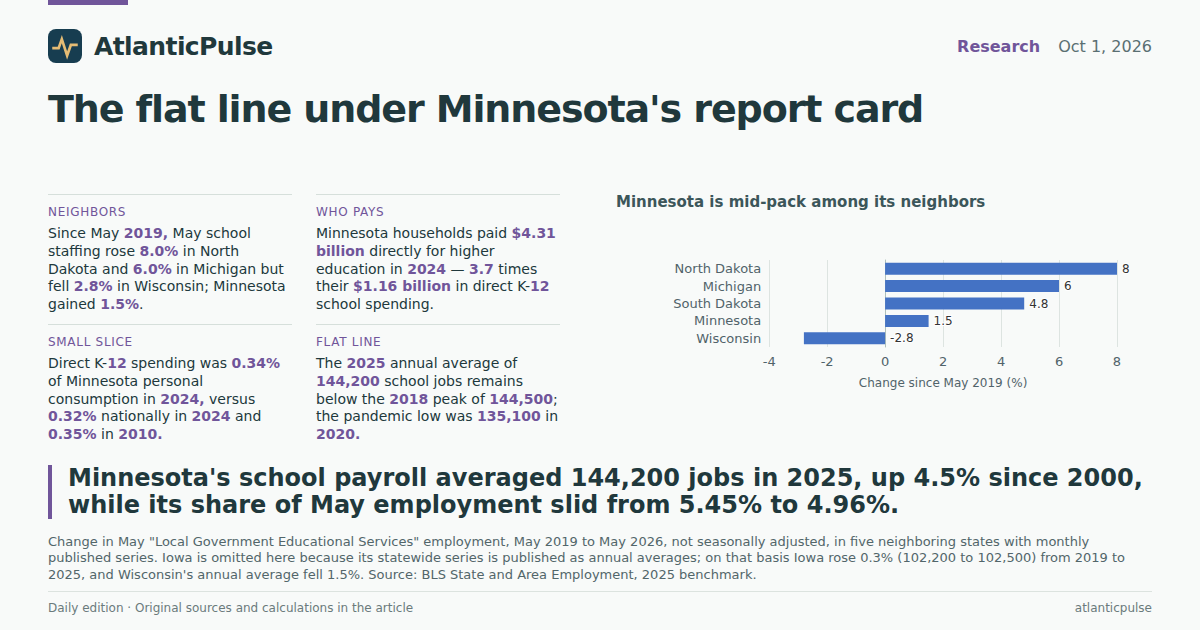
Context matters, because Minnesota's flatness looks different depending on the neighbor. From May 2019 to May 2026, May school staffing rose 4.8 percent in South Dakota, 6.0 percent in Michigan and 8.0 percent in North Dakota, while falling 2.8 percent in Wisconsin — the only decline in the five states with monthly published data. Minnesota's 1.5 percent gain puts it in the middle: it kept its schools roughly whole while Wisconsin trimmed and the Dakotas and Michigan added. On annual averages, where Iowa's series is published, Iowa's school payroll rose 0.3 percent from 2019 to 2025 and Wisconsin's fell 1.5 percent. None of this says anything about why the test scores look the way they do — a headcount cannot carry that weight, and the reporting itself flags opt-outs, a redesigned reading test and the Metro Surge spring as reasons to read this year's numbers carefully. But it does establish the baseline fact that the debate keeps skipping past: Minnesota is not expanding the system it is asking more of, and it is not cutting it either. It is holding it perfectly still.
Minnesota is mid-pack among its neighbors

View exact chart values
| state | may2019_thousands | may2026_thousands | pct_change |
|---|---|---|---|
| Wisconsin | 159 | 154.6 | -2.8 |
| Minnesota | 150.5 | 152.7 | 1.5 |
| South Dakota | 27.3 | 28.6 | 4.8 |
| Michigan | 196.7 | 208.6 | 6 |
| North Dakota | 26.1 | 28.2 | 8 |
Who actually pays for K-12
The household-spending books explain why this fight happens at the ballot box rather than the checkout line. In 2024, Minnesota families paid $4.31 billion directly for higher education — tuition, fees, the whole college bill — and $1.16 billion directly for nursery, elementary and secondary schools. The college number is 3.7 times the K-12 number. That asymmetry is the design: K-12 is paid for through taxes before the money ever reaches a household ledger, so it barely appears in consumer spending. College arrives as an invoice; public school arrives as a property-tax statement and a school board election.
The shares confirm how small the private slice is everywhere. Direct K-12 school spending was 0.34 percent of Minnesota's total personal consumption in 2024, up slightly from 0.32 percent in 2010 — making Minnesota the only one of the four areas examined where the share rose at all. The United States went the other way, from 0.35 percent to 0.32 percent, Wisconsin from 0.37 to 0.32 percent, while Iowa held at 0.36 percent. Between three and four tenths of one percent: in every state, what families directly hand over for K-12 is a rounding error next to what they hand over for almost anything else. Minnesota's public-school system is not primarily a product parents buy — it is infrastructure they fund collectively, which is precisely why arguments about its size are arguments about taxes, levies and the state budget, and why the payroll numbers above are the closest thing to a price tag most residents will ever see.
College bills dwarf what Minnesota families pay for K-12 directly

View exact chart values
| year | k12_millions | higher_ed_millions | edu_total_millions |
|---|---|---|---|
| 1997 | 415 | 1544.5 | 2402.4 |
| 1998 | 430.2 | 1749.8 | 2725.9 |
| 1999 | 444.3 | 2022.1 | 3087.5 |
| 2000 | 464.5 | 2342.1 | 3451.4 |
| 2001 | 485.4 | 2466.7 | 3628.4 |
| 2002 | 493.2 | 2528.9 | 3760.1 |
| 2003 | 506 | 2727.2 | 3975.1 |
| 2004 | 510.8 | 2906.3 | 4126.2 |
| 2005 | 509.9 | 2972.8 | 4187.8 |
| 2006 | 529.5 | 3032.1 | 4256.6 |
| 2007 | 548.5 | 3162.7 | 4368.2 |
| 2008 | 575 | 3251.5 | 4492.6 |
| 2009 | 594.9 | 3411.2 | 4710.7 |
| 2010 | 607.1 | 3605.6 | 4954.4 |
| 2011 | 640 | 3645.6 | 5052.6 |
| 2012 | 659 | 3566.9 | 4970.7 |
| 2013 | 696.7 | 3584.7 | 5031.6 |
| 2014 | 719.7 | 3533.9 | 5049.1 |
| 2015 | 768.4 | 3578.7 | 5185.3 |
| 2016 | 832.7 | 3702.9 | 5450 |
| 2017 | 873 | 3772 | 5619.9 |
| 2018 | 917.7 | 3832 | 5774.1 |
| 2019 | 946.8 | 3906.9 | 5963.7 |
| 2020 | 936.2 | 3927.4 | 5868 |
| 2021 | 1022.1 | 3985.7 | 6117.3 |
| 2022 | 1077.6 | 4123.7 | 6356.9 |
| 2023 | 1121.4 | 4236.8 | 6625.5 |
| 2024 | 1164.4 | 4312.3 | 6845.7 |
Direct K-12 spending barely registers in any state's consumer ledger

View exact chart values
| area | share_2010_pct | share_2024_pct |
|---|---|---|
| Minnesota | 0.32 | 0.34 |
| Wisconsin | 0.37 | 0.32 |
| Iowa | 0.35 | 0.36 |
| United States | 0.35 | 0.32 |
What the ledger can and cannot say
The limits deserve their own paragraph, because they are the difference between a ledger and an argument. Headcount is not quality: nothing here measures pay, hours, class sizes or teaching, and none of these descriptive comparisons supports a causal claim about test scores. The monthly comparisons use May values, the seasonal peak of the school year, on not-seasonally-adjusted data; Iowa appears only on its annual-average convention, which is how its series is published. Local-government education employment excludes private schools and state-run universities, so it is a proxy for the district system specifically. The vintages differ: the federal payroll data run through July 2026 on a 2025 benchmark, while the household-spending accounts end in 2024. And this year's MCA scores carry the caveats from the state's own reporting — a redesigned reading test that cannot be compared to prior years, high opt-out rates, and a testing window that overlapped the immigration-enforcement surge.
What remains is a clean baseline. Minnesota's school workforce — about 144,000 people at the annual average, about 153,000 at the May peak — has been essentially the same size since 2000, holds a shrinking share of a growing state economy, sits mid-pack among its neighbors, and is financed almost entirely by taxes because families pay almost nothing for it directly. A state task force is due to recommend changes to the testing system by March 2027, and the November election will sort out the funding politics. Whatever Minnesotans decide, they will be deciding over a system that has, in the one input everyone can count, stood perfectly still for a generation while the ask kept rising. That flat line is the report card under the report card.
Sources and methods
Employment: BLS State and Area Employment series SMU27000009093161101 (Minnesota, Local Government Educational Services, all employees, thousands, not seasonally adjusted), retrieved from the pinned snapshot of Aug. 24, 2026 (2025 benchmark, data through July 2026). Annual figures are official annual averages; May values are used for seasonal school-year peaks and cross-state comparisons. Neighboring states use their published monthly series; Iowa's statewide series is published only as annual averages and is compared on that basis (2019 vs 2025), which is disclosed wherever Iowa appears.
Minnesota total nonfarm employment is the matching not-seasonally-adjusted statewide series; the May share calculation divides May school employment by May total nonfarm employment in the same year, so both sides use the same seasonal convention.
Household spending: BEA Personal Consumption Expenditures by State (SAPCE4), release of Sept. 26, 2025, data through 2024, current dollars. 'Nursery, elementary, and secondary schools' captures direct household spending only and excludes tax-funded public-school operations; shares are computed against total personal consumption in the same area and year.
Scope limits: local-government education employment excludes private schools and state-run higher education. All comparisons are descriptive; no causal relationship between staffing, spending and test outcomes is claimed. The 2026 MCA figures, opt-out rates, Metro Surge context and the March 2027 task-force timeline come from the cited reporting and are not independently verified here.
All chart values derive from the saved reproducible calculation mn-school-books-calc-v3 over the saved bounded extracts; duplicate-observation checks found none (zero collisions across all 19 extracts).
Research completed 2026-10-02, for the October 1, 2026 news edition. The available source data may cover earlier periods; see the observation periods and source vintages above.