Research
The FEMA cut was 11,000 jobs. The federal payroll already lost 327,000.
A 50 percent cut, on a payroll that is already smaller
A federal judge in San Francisco ruled Friday that the Department of Homeland Security broke the law when it ordered the Federal Emergency Management Agency cut from 23,000 employees to fewer than 12,000. Judge Susan Illston called the 50 percent target a number that “appears as if pulled from thin air,” and said the plan collided with Post-Katrina rules that keep staffing control at FEMA rather than at DHS (UPI; Associated Press). The 50 percent cut was never fully carried out. Some workers later came back. That still leaves a useful question the court file cannot answer: how large is 11,000 federal jobs once you put them on the books the government already publishes every month?
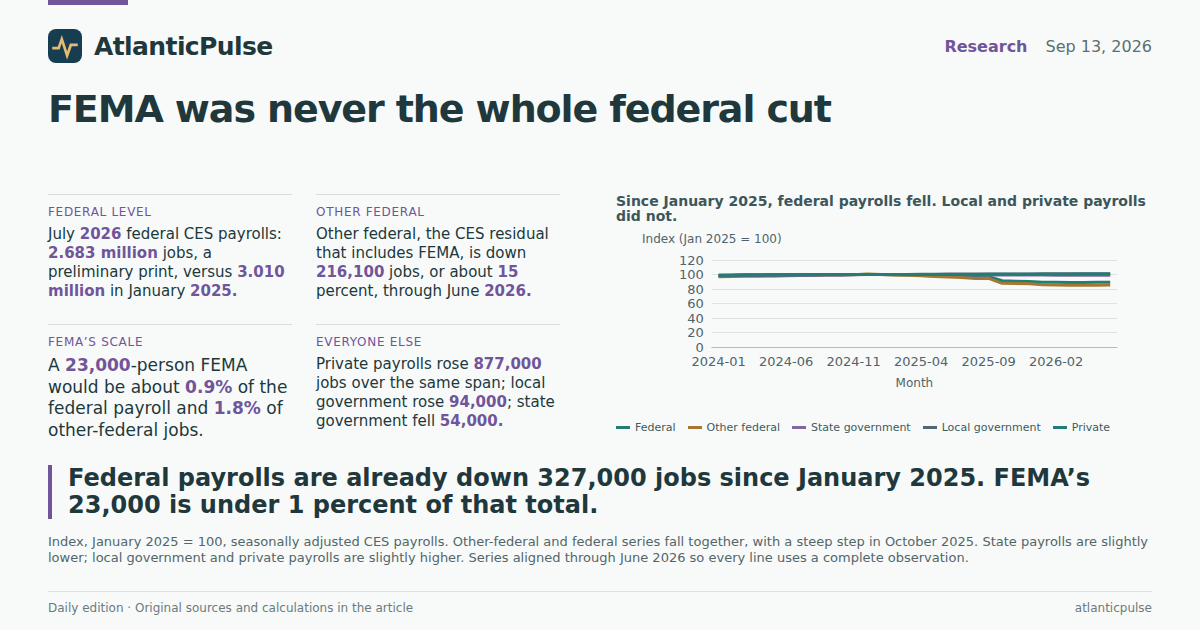
The Current Employment Statistics survey does not isolate FEMA. It does isolate the civilian federal payroll FEMA sits inside. In July 2026, that federal total was 2.683 million jobs, seasonally adjusted, in a preliminary CES print. In January 2025 it was 3.010 million. The difference is 327,000 jobs, or about 11 percent. The CES residual labeled “other federal government” — civilian agencies other than the Postal Service and federal hospitals, the bucket that includes FEMA — was 1.256 million in June 2026, the last complete month, down 216,100 from January 2025. A 23,000-person FEMA, if the court figure is right, is about 0.9 percent of the federal payroll and about 1.8 percent of that other-federal residual. Halving it would be a crisis for disaster response. On the federal employment ledger, it is a rounding error next to what has already happened.
None of that CES movement should be read as a count of FEMA firings. CES is a survey of payroll jobs, not an agency roster, and the October 2025 step-down in particular is large enough that census temps, other agencies, and survey noise all have to stay in the picture. The point is simpler. Washington spent the weekend arguing about whether DHS could legally take a knife to one disaster agency. The official payroll had already taken a much larger knife to the federal total.
Federal payrolls have already fallen well below their 2024 peak

View exact chart values
| month | federal_thousands | other_federal_thousands | usps_thousands |
|---|---|---|---|
| 2015-01 | 2745 | 1300.8 | 595.3 |
| 2015-02 | 2747 | 1300.6 | 595.6 |
| 2015-03 | 2748 | 1302.4 | 594.7 |
| 2015-04 | 2763 | 1302.7 | 606.7 |
| 2015-05 | 2753 | 1304.3 | 594.8 |
| 2015-06 | 2754 | 1304.8 | 595 |
| 2015-07 | 2756 | 1305.8 | 595.1 |
| 2015-08 | 2760 | 1307.2 | 596.1 |
| 2015-09 | 2759 | 1303.8 | 595.8 |
| 2015-10 | 2759 | 1300.9 | 596.7 |
| 2015-11 | 2766 | 1305.9 | 598.3 |
| 2015-12 | 2776 | 1309.8 | 604.9 |
| 2016-01 | 2771 | 1307.5 | 598.8 |
| 2016-02 | 2778 | 1308.3 | 604.9 |
| 2016-03 | 2783 | 1310.9 | 606.1 |
| 2016-04 | 2785 | 1312 | 605.6 |
| 2016-05 | 2792 | 1315 | 609.1 |
| 2016-06 | 2797 | 1318.7 | 610.4 |
| 2016-07 | 2800 | 1321.3 | 609.2 |
| 2016-08 | 2803 | 1321.7 | 613 |
| 2016-09 | 2806 | 1323.4 | 613.3 |
| 2016-10 | 2804 | 1322.7 | 611.9 |
| 2016-11 | 2798 | 1323.4 | 608.7 |
| 2016-12 | 2815 | 1326.6 | 618.7 |
| 2017-01 | 2813 | 1326.3 | 613.7 |
| 2017-02 | 2812 | 1325 | 615.2 |
| 2017-03 | 2810 | 1321.8 | 617.6 |
| 2017-04 | 2798 | 1316.2 | 612.7 |
| 2017-05 | 2808 | 1320 | 618 |
| 2017-06 | 2805 | 1318.5 | 617 |
| 2017-07 | 2806 | 1318.1 | 618.2 |
| 2017-08 | 2802 | 1317.5 | 613.5 |
| 2017-09 | 2799 | 1316.6 | 612.7 |
| 2017-10 | 2802 | 1317.2 | 616.3 |
| 2017-11 | 2791 | 1312.6 | 608.9 |
| 2017-12 | 2794 | 1310.7 | 611.4 |
| 2018-01 | 2794 | 1312.7 | 612.3 |
| 2018-02 | 2790 | 1312.1 | 608.4 |
| 2018-03 | 2792 | 1313.2 | 607.1 |
| 2018-04 | 2800 | 1315.2 | 608.2 |
| 2018-05 | 2793 | 1306.5 | 606.3 |
| 2018-06 | 2798 | 1315.3 | 606.9 |
| 2018-07 | 2799 | 1312.2 | 606.2 |
| 2018-08 | 2801 | 1310.8 | 607.3 |
| 2018-09 | 2805 | 1311.8 | 608.8 |
| 2018-10 | 2805 | 1313.1 | 606.6 |
| 2018-11 | 2809 | 1310.7 | 610.8 |
| 2018-12 | 2808 | 1309.8 | 609.3 |
| 2019-01 | 2808 | 1312.6 | 605.4 |
| 2019-02 | 2810 | 1313.2 | 605.7 |
| 2019-03 | 2811 | 1312.7 | 606.9 |
| 2019-04 | 2827 | 1328.2 | 604.1 |
| 2019-05 | 2829 | 1324.3 | 608 |
| 2019-06 | 2833 | 1324.1 | 608.7 |
| 2019-07 | 2829 | 1321.8 | 607.3 |
| 2019-08 | 2854 | 1346.4 | 607.8 |
| 2019-09 | 2852 | 1342.5 | 607 |
| 2019-10 | 2837 | 1324.5 | 608.7 |
| 2019-11 | 2842 | 1323.4 | 607.3 |
| 2019-12 | 2837 | 1324.8 | 603.5 |
| 2020-01 | 2855 | 1338 | 606.6 |
| 2020-02 | 2857 | 1345 | 597.7 |
| 2020-03 | 2876 | 1364.2 | 597.3 |
| 2020-04 | 2875 | 1370 | 596.1 |
| 2020-05 | 2876 | 1358.5 | 603.7 |
| 2020-06 | 2883 | 1360.7 | 607.1 |
| 2020-07 | 2908 | 1392.1 | 597.1 |
| 2020-08 | 3156 | 1630.7 | 604.8 |
| 2020-09 | 3123 | 1593.7 | 605.6 |
| 2020-10 | 2981 | 1449.5 | 605.9 |
| 2020-11 | 2892 | 1358.1 | 607 |
| 2020-12 | 2897 | 1357.3 | 609.2 |
| 2021-01 | 2884 | 1348.4 | 605.5 |
| 2021-02 | 2883 | 1347.9 | 608.5 |
| 2021-03 | 2885 | 1349.9 | 606.2 |
| 2021-04 | 2894 | 1353.7 | 614.2 |
| 2021-05 | 2886 | 1355.9 | 603.1 |
| 2021-06 | 2887 | 1357.3 | 601.6 |
| 2021-07 | 2892 | 1357.7 | 607.6 |
| 2021-08 | 2888 | 1358 | 604.8 |
| 2021-09 | 2887 | 1355.9 | 607 |
| 2021-10 | 2878 | 1355 | 599.3 |
| 2021-11 | 2889 | 1354.1 | 612 |
| 2021-12 | 2882 | 1354.3 | 609.2 |
| 2022-01 | 2879 | 1353.5 | 611.4 |
| 2022-02 | 2874 | 1352.5 | 609.7 |
| 2022-03 | 2867 | 1350.1 | 607.9 |
| 2022-04 | 2866 | 1350.4 | 606.1 |
| 2022-05 | 2862 | 1352.3 | 601.2 |
| 2022-06 | 2853 | 1347.5 | 598.6 |
| 2022-07 | 2862 | 1353.6 | 601.2 |
| 2022-08 | 2861 | 1354.7 | 597.7 |
| 2022-09 | 2865 | 1357.2 | 597.6 |
| 2022-10 | 2870 | 1360.9 | 598.7 |
| 2022-11 | 2877 | 1364.2 | 597.9 |
| 2022-12 | 2874 | 1363.1 | 597.1 |
| 2023-01 | 2880 | 1369.7 | 599 |
| 2023-02 | 2887 | 1374 | 602.5 |
| 2023-03 | 2893 | 1377.1 | 603.7 |
| 2023-04 | 2904 | 1382.3 | 606.1 |
| 2023-05 | 2915 | 1388.1 | 607 |
| 2023-06 | 2925 | 1396.4 | 607.4 |
| 2023-07 | 2930 | 1402 | 601.2 |
| 2023-08 | 2946 | 1408.4 | 607.2 |
| 2023-09 | 2951 | 1414.1 | 604.9 |
| 2023-10 | 2956 | 1415.2 | 605.8 |
| 2023-11 | 2960 | 1418.6 | 603.6 |
| 2023-12 | 2964 | 1424.3 | 603.8 |
| 2024-01 | 2971 | 1426.7 | 605.3 |
| 2024-02 | 2980 | 1432.6 | 606.2 |
| 2024-03 | 2989 | 1440 | 608 |
| 2024-04 | 2992 | 1443.1 | 606.3 |
| 2024-05 | 3001 | 1448.7 | 608.9 |
| 2024-06 | 3005 | 1451.2 | 608.6 |
| 2024-07 | 3007 | 1456.1 | 605.2 |
| 2024-08 | 3011 | 1458.2 | 606 |
| 2024-09 | 3012 | 1460.9 | 605.7 |
| 2024-10 | 3013 | 1463.8 | 604.6 |
| 2024-11 | 3009 | 1465.1 | 601.7 |
| 2024-12 | 3009 | 1479.4 | 598.6 |
| 2025-01 | 3010 | 1472.2 | 604.1 |
| 2025-02 | 2997 | 1463.7 | 599.8 |
| 2025-03 | 2988 | 1455.7 | 598.3 |
| 2025-04 | 2976 | 1446 | 598.7 |
| 2025-05 | 2952 | 1432.6 | 592.2 |
| 2025-06 | 2944 | 1423 | 592.9 |
| 2025-07 | 2935 | 1411.9 | 595.5 |
| 2025-08 | 2916 | 1393 | 592.5 |
| 2025-09 | 2914 | 1394 | 592.7 |
| 2025-10 | 2748 | 1293.4 | 591.2 |
| 2025-11 | 2733 | 1286.4 | 592.6 |
| 2025-12 | 2722 | 1283.6 | 594.2 |
| 2026-01 | 2685 | 1265.3 | 594.6 |
| 2026-02 | 2689 | 1259.1 | 599.7 |
| 2026-03 | 2682 | 1255.5 | 599 |
| 2026-04 | 2681 | 1254.6 | 598.4 |
| 2026-05 | 2685 | 1253.8 | 601.9 |
| 2026-06 | 2686 | 1256.1 | 603 |
Halving FEMA would be large for FEMA and tiny on the federal books

View exact chart values
| label | jobs_thousands |
|---|---|
| All government | 23270 |
| Local government | 15116 |
| State government | 5471 |
| Federal government | 2683 |
| Other federal (includes FEMA) | 1256.1 |
| FEMA in the court record | 23 |
The drop is federal. It is not the whole government.
Index the same series at January 2025 and the split is obvious. By June 2026, the federal payroll was about 11 percent below that starting point; other federal was about 15 percent below. State government was down about 1 percent. Local government was up about 1 percent. Private payrolls were also up, by about 0.6 percent. The federal line does not drift. It steps down through 2025, then falls hard between September and October — from 2.914 million federal jobs to 2.748 million — and keeps grinding lower into 2026. Other federal follows the same path, from 1.394 million in September 2025 to 1.293 million in October.
That October print is a CES fact, not a courtroom finding. CES federal employment also jumped in August 2020, when temporary census hiring bloated the same series, then faded. A one-month collapse can be a real cut, a survey artifact, the end of a temporary program, or some mix. What the survey can say without guessing is the level after the dust: federal employment in July 2026, at 2.683 million, was a little below where it stood in January 2015 (2.745 million) and well below the late-2024 peak near 3.01 million. The Postal Service barely moved. Federal hospitals, through June, were down about 19,500 jobs from January 2025. Almost the entire federal loss is in the non-postal civilian residual.
State and local government are a different country. Local education alone employed about 8.14 million people in July 2026. Local government excluding education employed another 6.97 million. State government employed 5.47 million. Stack those next to 2.68 million federal jobs, of which 603,000 are Postal Service, and FEMA’s 23,000 is not even a visible bar. The government that actually staffs schools, cops, water systems and county emergency managers is not the government Illston was asked to referee.
Since January 2025, federal payrolls fell. Local and private payrolls did not.

View exact chart values
| month | federal_index | other_federal_index | state_index | local_index | private_index |
|---|---|---|---|---|---|
| 2024-01 | 98.7 | 96.91 | 97.52 | 98.4 | 99.39 |
| 2024-02 | 99 | 97.31 | 97.83 | 98.7 | 99.49 |
| 2024-03 | 99.3 | 97.81 | 97.97 | 99.15 | 99.6 |
| 2024-04 | 99.4 | 98.02 | 98.12 | 99.08 | 99.65 |
| 2024-05 | 99.7 | 98.4 | 98.1 | 99.25 | 99.68 |
| 2024-06 | 99.83 | 98.57 | 98.15 | 99.26 | 99.74 |
| 2024-07 | 99.9 | 98.91 | 98.52 | 99.52 | 99.73 |
| 2024-08 | 100.03 | 99.05 | 98.97 | 99.57 | 99.71 |
| 2024-09 | 100.07 | 99.23 | 99.17 | 99.57 | 99.82 |
| 2024-10 | 100.1 | 99.43 | 99.4 | 99.73 | 99.81 |
| 2024-11 | 99.97 | 99.52 | 99.58 | 99.81 | 99.9 |
| 2024-12 | 99.97 | 100.49 | 99.82 | 99.89 | 100.06 |
| 2025-01 | 100 | 100 | 100 | 100 | 100 |
| 2025-02 | 99.57 | 99.42 | 100 | 100.1 | 100.03 |
| 2025-03 | 99.27 | 98.88 | 99.96 | 100.17 | 100.08 |
| 2025-04 | 98.87 | 98.22 | 99.95 | 100.32 | 100.15 |
| 2025-05 | 98.07 | 97.31 | 99.82 | 100.48 | 100.17 |
| 2025-06 | 97.81 | 96.66 | 99.84 | 100.69 | 100.13 |
| 2025-07 | 97.51 | 95.9 | 99.62 | 100.83 | 100.18 |
| 2025-08 | 96.88 | 94.62 | 99.31 | 100.73 | 100.17 |
| 2025-09 | 96.81 | 94.69 | 99.49 | 100.73 | 100.22 |
| 2025-10 | 91.3 | 87.85 | 99.42 | 100.85 | 100.23 |
| 2025-11 | 90.8 | 87.38 | 99.2 | 100.82 | 100.28 |
| 2025-12 | 90.43 | 87.19 | 99.11 | 100.86 | 100.28 |
| 2026-01 | 89.2 | 85.95 | 99.17 | 100.95 | 100.41 |
| 2026-02 | 89.34 | 85.53 | 99.06 | 100.91 | 100.3 |
| 2026-03 | 89.1 | 85.28 | 98.99 | 101.07 | 100.45 |
| 2026-04 | 89.07 | 85.22 | 98.99 | 101.06 | 100.56 |
| 2026-05 | 89.2 | 85.17 | 98.95 | 101.06 | 100.61 |
| 2026-06 | 89.24 | 85.32 | 98.9 | 101.01 | 100.63 |
Most government jobs are local. FEMA sits inside a thin federal slice.

View exact chart values
| category | jobs_thousands |
|---|---|
| Local education | 8142.2 |
| Local, excluding education | 6973.3 |
| State government | 5471 |
| Other federal | 1256.1 |
| U.S. Postal Service | 603.1 |
| Federal hospitals | 351.4 |
Private payrolls absorbed the federal loss, and then some
From January 2025 to the latest CES month, private payrolls rose by 877,000 jobs. Local government added 94,000. State government lost 54,000. Federal government lost 327,000. Total nonfarm employment still rose by 590,000, to 158.9 million in July 2026, because the private gain more than offset the federal hole. Federal jobs were 1.7 percent of nonfarm employment in that month. All government, including schools, was 14.7 percent.
That arithmetic is easy to misuse. It does not mean the FEMA lawsuit is small, and it does not mean a thinner federal payroll is “good for the economy” just because private hiring continued. Disaster response, aviation safety, veterans’ hospitals and tax processing are not items you can swap one-for-one with warehouse jobs. Illston’s opinion was about whether DHS could ignore a statute written after Hurricane Katrina. A GAO report cited in the same coverage said more than 4,300 FEMA employees, about 17 percent of that agency, left in fiscal 2025. Those are FEMA numbers, not CES numbers. They sit comfortably inside the much larger other-federal decline without explaining it.
The honest scale check is still worth making. A 50 percent FEMA cut from 23,000 to 11,500 would be half an agency and about 11,500 jobs. Other federal employment has already declined by 216,100 jobs since January 2025. The blocked FEMA cut is about 5 percent of that already-recorded other-federal loss, and about 4 percent of the 327,000-job drop in the full federal payroll. If the political argument is that Washington cannot afford to keep FEMA whole, the survey is not cooperating. The federal workforce got smaller first. The part a judge just put back on the table was the small end of the stick.
The federal payroll lost hundreds of thousands of jobs. Private payrolls added more.

View exact chart values
| group | change_jobs |
|---|---|
| Federal | -327000 |
| Federal except USPS | -326000 |
| Other federal | -216100 |
| State government | -54000 |
| Local government | 94000 |
| Private payrolls | 877000 |
Sources and methods
Payroll figures are U.S. Bureau of Labor Statistics Current Employment Statistics (CES) national series, seasonally adjusted, in thousands of jobs, from a pinned snapshot dated 2026-08-24 (release id bls-ce-snapshot-2026-08-24). Observation dates are not CES publication dates. July 2026 federal, Postal Service, state, local, private and total-nonfarm prints carry a preliminary footnote in the extract; other-federal and federal-hospital series are complete only through June 2026, so those comparisons stop there rather than treating a missing July value as zero.
CES federal employment is a survey estimate of payroll jobs, not an agency headcount. It includes the Postal Service and federal hospitals; the “other federal government” residual is the closest published CES industry that would contain FEMA, but it also contains many other civilian agencies. The 23,000 FEMA figure and the ordered cut to fewer than 12,000 come from Friday’s court reporting, not from CES. Those court numbers are used only as a scale comparison and are labeled as such.
No duplicate CES periods were found in the extracts. Null observations were skipped, not filled. Indexed series use January 2025 = 100 and run through the last month in which federal, other-federal, state, local and private values are all present (June 2026). The August 2020 bulge in federal payrolls is the familiar census-temporary spike; the September-to-October 2025 drop is reported as a CES movement only. This article does not infer that the DHS FEMA plan, the lawsuit, or any named political program caused the 327,000-job federal decline.
Provider lag is normal. These are not current-day observations for 13 September 2026. Household averages cannot be read from aggregate payrolls. Military active-duty personnel are outside CES nonfarm payrolls.
Research completed 2026-09-14, for the September 13, 2026 news edition. The available source data may cover earlier periods; see the observation periods and source vintages above.