Research
The empty apartments were never built for the poorest
The mismatch the vacancy rate cannot explain
On 8 September 2026 the Associated Press described a cruel piece of urban arithmetic. In Austin, more than 4,500 apartments classed as affordable — nearly 16 percent of that stock — sat empty, while Mathew Davis, living in a shelter and donating plasma, could not stretch to a $450 tiny home without running water. The same pattern showed up in Denver and Portland: units financed for households earning 50 to 80 percent of area median income competing with market-rate buildings, while homes set aside for extremely low-income renters remain scarce. Nationally, the coalition that tracks the shortage counts about 11 million extremely low-income renter households and only about 4 million affordable units within their reach.
That is not a story the national accounts can tell household by household. The Bureau of Economic Analysis does not publish a vacancy rate for tax-credit apartments, and it does not split renters by income. What it does record, in current dollars, is how large tenant rent is next to the housing America books for homeowners — and, through regional price parities, how expensive housing already is in the states and metros named in that reporting. The official books will not prove why a 60-percent-of-median unit sits empty. They will show whether the country is, in the aggregate, an owner-occupied housing market that treats cash rent as a rounding error.
Owner America, renter footnote
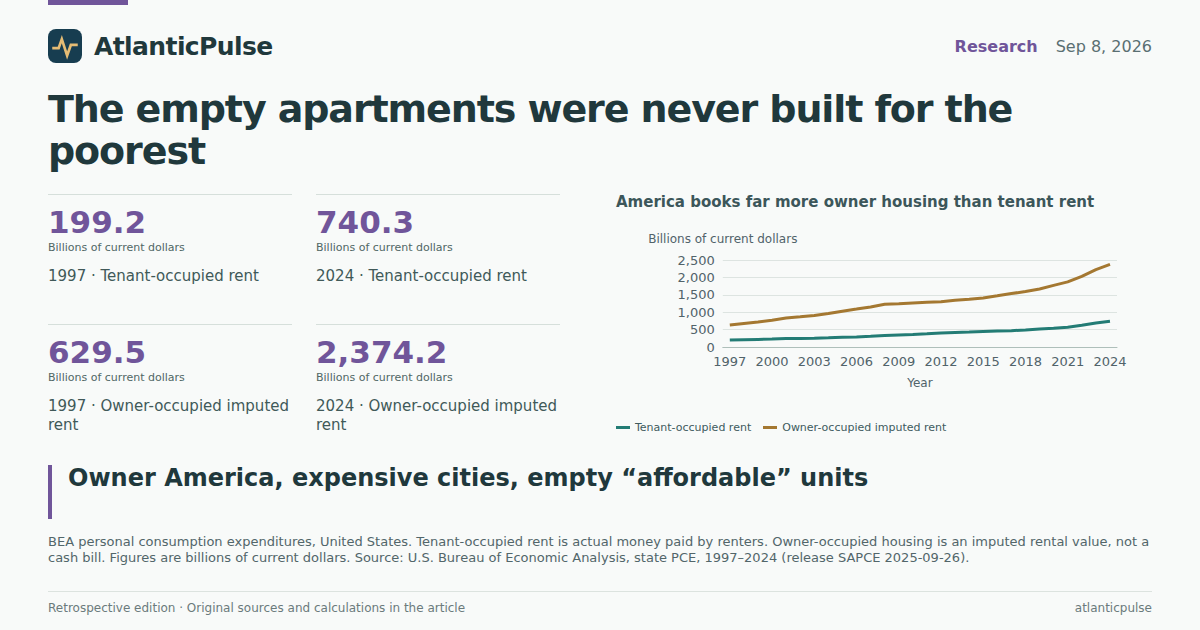
In 2024, Americans as a group spent $740.3 billion on tenant-occupied nonfarm rent and $2.37 trillion on the imputed rental value of owner-occupied homes, according to BEA state consumption accounts. Owner-occupied housing in those books was 3.2 times tenant rent. Both series are current-dollar aggregates, not what any one household paid. The owner figure is an imputed rent — the income a homeowner could have received by letting the house — not a cash bill. It is still the number that dominates the housing line.
Add goods and services and 2024 personal consumption was $19.90 trillion. Tenant rent was 3.72 percent of that total. Owner-occupied imputed rent was 11.93 percent. Together they were 15.65 percent of spending. In 1997 the shares were 3.60 and 11.37 percent. Cash rent’s slice of the national pie has barely moved in a generation. The dollar amounts have: tenant rent rose from $199.2 billion to $740.3 billion, owner-occupied imputed rent from $629.5 billion to $2.37 trillion. A country can look “housing-heavy” in the accounts while the people who actually write rent checks remain a small line.
America books far more owner housing than tenant rent

View exact chart values
| year | tenant_rent_billion | owner_imputed_billion |
|---|---|---|
| 1997 | 199.2 | 629.5 |
| 1998 | 209 | 674.3 |
| 1999 | 218.2 | 718.9 |
| 2000 | 227.9 | 768.9 |
| 2001 | 242.3 | 829.2 |
| 2002 | 248.2 | 867.1 |
| 2003 | 251.8 | 908.2 |
| 2004 | 264.1 | 959.3 |
| 2005 | 281.7 | 1029.1 |
| 2006 | 291.5 | 1089.2 |
| 2007 | 308.8 | 1153.1 |
| 2008 | 330.1 | 1226.9 |
| 2009 | 346.3 | 1244.1 |
| 2010 | 361.1 | 1267.6 |
| 2011 | 378.3 | 1284 |
| 2012 | 399.5 | 1301.7 |
| 2013 | 413.4 | 1343.9 |
| 2014 | 429.5 | 1372.2 |
| 2015 | 445.5 | 1411.2 |
| 2016 | 460.7 | 1470.7 |
| 2017 | 467.1 | 1533.2 |
| 2018 | 490.4 | 1593.6 |
| 2019 | 520.9 | 1665.4 |
| 2020 | 536.8 | 1770.6 |
| 2021 | 569.6 | 1869.4 |
| 2022 | 622.4 | 2028.7 |
| 2023 | 688.9 | 2221.4 |
| 2024 | 740.3 | 2374.2 |
Cash rent is a sliver of national spending. Imputed owner housing is not.

View exact chart values
| year | tenant_share_pct | owner_share_pct | housing_two_share_pct | total_pce_billion |
|---|---|---|---|---|
| 1997 | 3.6 | 11.37 | 14.97 | 5536.8 |
| 1998 | 3.56 | 11.47 | 15.03 | 5877.2 |
| 1999 | 3.47 | 11.44 | 14.91 | 6283.8 |
| 2000 | 3.37 | 11.36 | 14.73 | 6767.2 |
| 2001 | 3.42 | 11.72 | 15.15 | 7073.8 |
| 2002 | 3.38 | 11.8 | 15.18 | 7348.9 |
| 2003 | 3.25 | 11.73 | 14.98 | 7740.7 |
| 2004 | 3.21 | 11.65 | 14.86 | 8232 |
| 2005 | 3.21 | 11.74 | 14.95 | 8769.1 |
| 2006 | 3.14 | 11.74 | 14.88 | 9277.2 |
| 2007 | 3.17 | 11.83 | 15 | 9746.6 |
| 2008 | 3.28 | 12.21 | 15.49 | 10050.1 |
| 2009 | 3.5 | 12.58 | 16.08 | 9891.2 |
| 2010 | 3.52 | 12.35 | 15.87 | 10260.3 |
| 2011 | 3.54 | 12 | 15.54 | 10698.9 |
| 2012 | 3.62 | 11.78 | 15.4 | 11047.4 |
| 2013 | 3.63 | 11.8 | 15.43 | 11388.2 |
| 2014 | 3.62 | 11.56 | 15.17 | 11874.5 |
| 2015 | 3.62 | 11.48 | 15.1 | 12297.4 |
| 2016 | 3.62 | 11.56 | 15.18 | 12726.8 |
| 2017 | 3.51 | 11.54 | 15.05 | 13290.6 |
| 2018 | 3.52 | 11.44 | 14.96 | 13934.4 |
| 2019 | 3.61 | 11.54 | 15.14 | 14437.5 |
| 2020 | 3.77 | 12.44 | 16.21 | 14231.4 |
| 2021 | 3.53 | 11.6 | 15.13 | 16119.7 |
| 2022 | 3.52 | 11.47 | 14.99 | 17690 |
| 2023 | 3.66 | 11.8 | 15.45 | 18833.1 |
| 2024 | 3.72 | 11.93 | 15.65 | 19896 |
Texas is not Austin
BEA housing price parities compare local housing prices with a U.S. average near 100. Those housing levels are estimated from tenant-occupied units, which makes them the right official yardstick for a renter story — and the wrong one if someone treats the index as a mortgage payment. In 2024 Mississippi’s housing RPP was 56.5. Texas was 96.5, just under the U.S. 100.6. Oregon was 108.6, New York 122.2, Hawaii 125.3, Colorado 127.4, California 154.3, and the District of Columbia 155.0.
The state average is a poor guide to the cities in the AP dispatch. Austin-Round Rock’s housing RPP was 120.4 in 2024 — about 20 percent above the national housing price level, and far above Texas as a whole. Denver-Aurora was 146.9. Portland-Vancouver was 125.1. Austin’s index has been above 120 for most years since 2016; it peaked at 126.4 in 2023 before easing. Denver has been in the mid-140s to low 150s since 2016. Portland climbed from 112.5 in 2008 to 125.1 in 2024. A statewide “Texas is cheap” headline and an Austin waiting list can both be true.
Housing prices, not the national average, are the local story

View exact chart values
| place | housing_rpp |
|---|---|
| Mississippi | 56.5 |
| Texas | 96.5 |
| United States | 100.6 |
| Oregon | 108.6 |
| New York | 122.2 |
| Hawaii | 125.3 |
| Colorado | 127.4 |
| California | 154.3 |
| District of Columbia | 155 |
Austin, Denver and Portland all price housing above the U.S.

View exact chart values
| year | austin | denver | portland |
|---|---|---|---|
| 2008 | 110 | 122.8 | 112.5 |
| 2009 | 111.7 | 120 | 114 |
| 2010 | 108.1 | 123.1 | 112.9 |
| 2011 | 110.3 | 131.1 | 113.4 |
| 2012 | 115.2 | 127.5 | 116.9 |
| 2013 | 114.7 | 128.7 | 116.1 |
| 2014 | 117.7 | 134.3 | 118.4 |
| 2015 | 119.2 | 141.6 | 123.1 |
| 2016 | 122.7 | 147.2 | 123.9 |
| 2017 | 124.9 | 148.2 | 129.7 |
| 2018 | 121.9 | 148.3 | 132.1 |
| 2019 | 121.5 | 147.3 | 131.2 |
| 2020 | 124.5 | 152.6 | 129.3 |
| 2021 | 122.5 | 146.2 | 127.8 |
| 2022 | 126.3 | 145.6 | 128.4 |
| 2023 | 126.4 | 146.1 | 124.8 |
| 2024 | 120.4 | 146.9 | 125.1 |
Incomes rose. Denver’s housing index rose faster
Real per capita personal income — personal income adjusted by regional prices, in 2017 dollars — is not a renter’s paycheck. It is the closest official income path in this catalogue for the same states. From 2008 to 2024 it rose 29.2 percent in the United States, to $59,195. Texas rose 26.4 percent, to $58,219, with a housing RPP still below the national index. Oregon rose 31.1 percent, to $55,451, with housing 8.6 percent above the U.S. Colorado rose 39.8 percent, to $65,223 — and still faced a 2024 housing RPP of 127.4.
Over the same span Austin’s housing RPP rose 9.4 percent, Portland’s 11.2 percent, Denver’s 19.6 percent. Those are price-level comparisons, not rents on a lease. They do not measure the $450 tiny home Davis cannot afford. They do show that the metros named for empty “affordable” units are not cheap-housing outliers. They are expensive-housing metros inside states whose averages hide the city.
The apartment crews are still a rounding error
If the shortage is in units the poorest can rent, the construction payroll is a blunt instrument: it counts jobs, not bedroom counts or rent ceilings. New multifamily housing construction employed 28,300 people in December 2000 and 46,800 at the December 2023 peak, then 41,700 in December 2025 and 42,100 in July 2026, seasonally adjusted. New single-family construction employed 505,600 in December 2000 and 365,900 in July 2026. Multifamily payrolls grew. They remain about one-ninth the single-family crew.
That is not proof that builders “chose” the wrong tenants. CES does not say who will live in the building. It does show that the industry most able to add rental supply is still small next to the detached-house machine, even after a 2020s multifamily hiring wave. A Low-Income Housing Tax Credit unit at 60 percent of median income can sit empty beside a shelter bed for the same reason the national accounts barely notice cash rent: the housing the country produces, books, and staffs is not aimed at the bottom of the income distribution.
Multifamily crews grew. They are still a rounding error next to single-family.

View exact chart values
| year | multifamily_thousands | single_family_thousands |
|---|---|---|
| 2000 | 28.3 | 505.6 |
| 2001 | 28.1 | 497.8 |
| 2002 | 29.1 | 508.8 |
| 2003 | 29.3 | 543.6 |
| 2004 | 28.2 | 583.2 |
| 2005 | 32.6 | 623.3 |
| 2006 | 32.4 | 593.8 |
| 2007 | 30.3 | 525.9 |
| 2008 | 26.9 | 408.7 |
| 2009 | 22.5 | 313 |
| 2010 | 21 | 280.2 |
| 2011 | 21.8 | 281.8 |
| 2012 | 23.2 | 288.5 |
| 2013 | 25.9 | 302.2 |
| 2014 | 28.8 | 328.3 |
| 2015 | 30.8 | 336.6 |
| 2016 | 32.3 | 347.2 |
| 2017 | 33.8 | 355 |
| 2018 | 36.4 | 366.7 |
| 2019 | 36.6 | 363.6 |
| 2020 | 39.9 | 365.3 |
| 2021 | 40.8 | 381.4 |
| 2022 | 44.5 | 392.8 |
| 2023 | 46.8 | 373.5 |
| 2024 | 46.5 | 376.4 |
| 2025 | 41.7 | 368.4 |
| 2026 | 42.1 | 365.9 |
What the books will not do
None of these series can count vacant tax-credit units in Austin, or say how many of those vacancies would fill if rents fell $200. Aggregate tenant rent is not a household average; a $740 billion national rent bill can coexist with millions of people who cannot clear a credit check. Housing RPPs are tenant-based price levels, not asking rents. Real per capita income averages across owners, renters, and children. Construction jobs are not housing starts.
The payoff is narrower and still useful. America’s consumption accounts are an owner-occupied housing story. Cash rent is 4 percent of spending. The cities in this week’s empty-apartment reporting already price housing 20 to 47 percent above the national level, even when their states do not. And the payroll that builds apartments, after a modest boom, is still a thin line beside the one that builds houses. The poorest are not missing from the vacancy rate by accident. They were barely in the building programme, the price index, or the national accounts to begin with.
Sources and methods
This article is retrospective enrichment for AtlanticPulse’s 8 September 2026 National edition. Calculations were run on 11 September 2026 against pinned, read-only snapshots; they are not a reconstruction of what was knowable on edition day. Later releases may revise the figures.
Personal consumption: BEA state PCE (SAPCE), snapshot created 31 August 2026, source release bea-sapce-2025-09-26. Tenant-occupied nonfarm rent and imputed owner-occupied nonfarm rent are millions of current dollars, annual, 1997–2024. Total PCE is goods plus services from the major-type table, also millions of current dollars. Shares divide those housing lines by that total. These are national aggregates, not household averages, and owner-occupied housing is imputed, not a cash outlay.
Prices and real income: BEA regional price parities and real personal income, snapshot 31 August 2026, source release bea-rpp-2026-02-19. Housing RPPs are annual indexes; BEA estimates housing price levels from tenant-occupied housing. State RPPs shown for 2024; metro RPPs for Austin-Round Rock-San Marcos, Denver-Aurora-Centennial, and Portland-Vancouver-Hillsboro, 2008–2024. Real per capita personal income is in constant 2017 dollars, 2008–2024. A state RPP is not a metro rent, and real per capita income is not a renter wage.
Construction jobs: BLS Current Employment Statistics, snapshot 24 August 2026, seasonally adjusted thousands, monthly. New multifamily housing construction (except for-sale builders) and new single-family housing construction (except for-sale builders). Annual points are December of each year through 2025 and July 2026, the last month in the extract window. Jobs are not housing completions or rent-restricted units.
Null observations were not treated as zero. No series used here had a null in the plotted window. No causal claim is drawn from the descriptive comparisons. The catalogue does not contain LIHTC unit counts, vacancy rates, or income-quintile rent burdens; those figures in the prose come only from the 8 September 2026 reporting cited there.
Research completed 2026-09-11, for the September 8, 2026 news edition. This is retrospective analysis, not a reconstruction of information available that day.