Research
The diesel ban’s farm-state politics, measured on the books
A ban sold as farm relief
On Tuesday, Iowa Senator Chuck Grassley posted that high diesel prices were “KILLING FARMERS INCOME.” By Wednesday, people familiar with White House talks told Politico the administration was preparing a 90-day freeze on diesel exports — the first curb on U.S. energy shipments since the 2015 repeal of the crude-export ban — even as Energy Secretary Chris Wright told a Climate Week panel that “the blunt tool of banning diesel exports definitely doesn’t work.” Time put the national diesel average around $6.53 a gallon, at least 90 cents above the prior month and a leap from about $3.75 just before the Iran war. The politics are not subtle. Farm-state Republicans want cheaper fuel before November. Gulf Coast refiners and Wright’s own department warn that trapping diesel at home eventually slows whole plants, which also make gasoline and jet fuel.
That argument is a claim about two different books. One is farm income: whether the people who grow corn, soybeans and cattle in the states shouting loudest have already seen their proprietors’ receipts collapse. The other is the household fuel bill: whether the same states already spend more, per person, on gasoline and other energy goods than the coastal markets analysts say could get the backwash if Midwest tanks fill up and coastal cargoes do not. Neither book measures farm diesel as an input cost. The Bureau of Economic Analysis farm-proprietors series is the net income of sole proprietorships and partnerships that operate farms, at a seasonally adjusted annual rate, and it excludes corporate farms. The state PCE tables count what households spent on motor fuels, lubricants, fluids and fuel oils. Those are still the ledgers Washington is waving around.
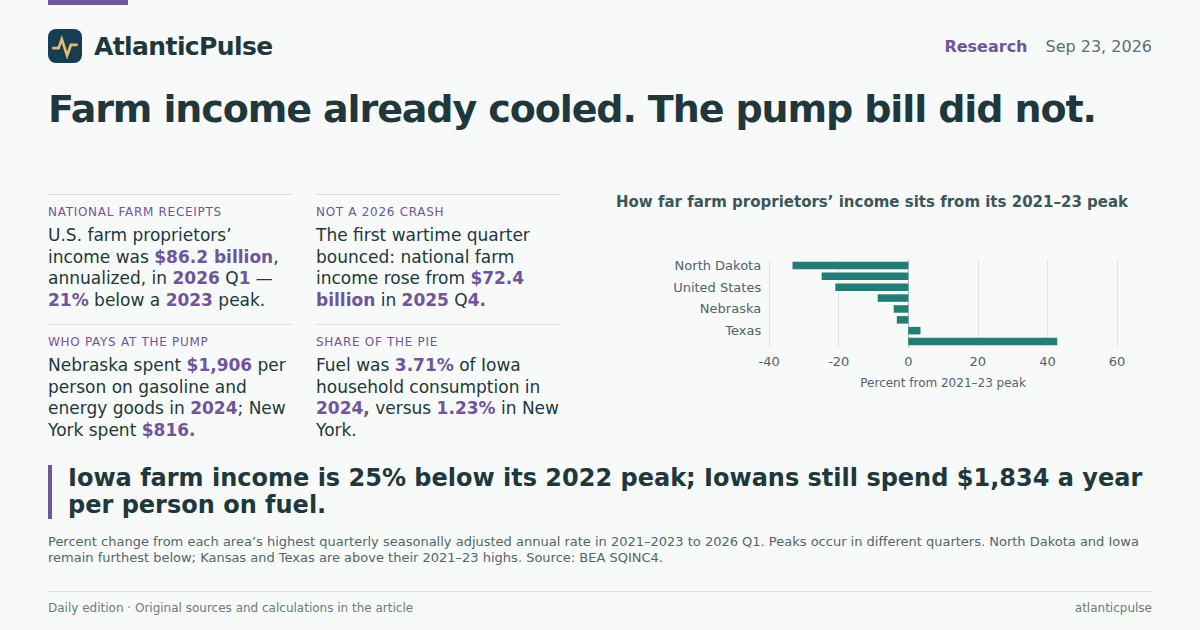
The first surprise is timing. The Iran war began in February 2026. The latest official farm-income quarter, 2026 Q1, mixes one pre-war month with two wartime ones, and it is not a crash. U.S. farm proprietors’ income ran at an $86.2 billion seasonally adjusted annual rate in that quarter — down 21 percent from a $109.1 billion peak in 2023 Q1, but up from $72.4 billion in 2025 Q4. Iowa, Grassley’s state, was at $8.1 billion, 25 percent below its $10.8 billion peak in 2022 Q3, and still higher than in late 2025. The squeeze that emptied the 2022 boom happened in 2023 and 2024, on the official clock, before diesel set this year’s records. That does not prove diesel is harmless. It does mean a 90-day export freeze is being sold as emergency surgery on an income series that had already receded, then bounced.
Farm proprietors’ income in ban-backing states

View exact chart values
| period | period_start | United_States | Plains | Iowa | Nebraska | South_Dakota | Texas |
|---|---|---|---|---|---|---|---|
| 2019 Q1 | 2019-01-01 | 36646.9 | 7971.3 | 1795.8 | 2227.5 | 1284.2 | 872.2 |
| 2019 Q2 | 2019-04-01 | 26977 | 3056.9 | 771.2 | 1516.2 | 692.7 | 1092.2 |
| 2019 Q3 | 2019-07-01 | 47874.6 | 12103.8 | 2902.8 | 2936.4 | 1474.7 | 2588.8 |
| 2019 Q4 | 2019-10-01 | 49813.5 | 12527.5 | 2962 | 3102.9 | 1548.3 | 2793.3 |
| 2020 Q1 | 2020-01-01 | 48987.7 | 13352.1 | 1016.6 | 2850.8 | 1897.6 | 3424.9 |
| 2020 Q2 | 2020-04-01 | 32641.3 | 10406.4 | 314.6 | 2294.5 | 2068.5 | 836.4 |
| 2020 Q3 | 2020-07-01 | 54690.9 | 15787.6 | 1398.6 | 3380.2 | 2445.7 | 2900.7 |
| 2020 Q4 | 2020-10-01 | 90896.1 | 30696.2 | 4881.7 | 6008.1 | 3985.1 | 4388.5 |
| 2021 Q1 | 2021-01-01 | 55101.8 | 15904.6 | 3923.2 | 3218.8 | 2418.6 | 2894.9 |
| 2021 Q2 | 2021-04-01 | 100263.5 | 37315.5 | 9154.3 | 7059.9 | 4547.1 | 4702.2 |
| 2021 Q3 | 2021-07-01 | 93126.9 | 33593.6 | 8465.1 | 6437.6 | 4113.4 | 4217.7 |
| 2021 Q4 | 2021-10-01 | 70407.9 | 18274.6 | 4645.3 | 3682.5 | 2604.7 | 3174.3 |
| 2022 Q1 | 2022-01-01 | 94783.2 | 31722 | 9297.5 | 3838.9 | 4123 | 6843.3 |
| 2022 Q2 | 2022-04-01 | 107488.3 | 36673.8 | 10779 | 4147.1 | 4717.7 | 6599.2 |
| 2022 Q3 | 2022-07-01 | 105217.3 | 36631.6 | 10832.9 | 4304.7 | 4657.8 | 6721.1 |
| 2022 Q4 | 2022-10-01 | 105815.2 | 32085.2 | 9602.6 | 3547.5 | 4152.9 | 6938.4 |
| 2023 Q1 | 2023-01-01 | 109111.2 | 35183.3 | 7732.1 | 6734.6 | 5116.8 | 10027 |
| 2023 Q2 | 2023-04-01 | 86288.1 | 29864.6 | 6363.9 | 6138.6 | 4554.2 | 8793.7 |
| 2023 Q3 | 2023-07-01 | 71414.6 | 27655.9 | 5811.7 | 6076 | 4309.3 | 8395.7 |
| 2023 Q4 | 2023-10-01 | 53654.1 | 20278.3 | 3988.7 | 4642.1 | 3635.2 | 7561.6 |
| 2024 Q1 | 2024-01-01 | 57875 | 18395.3 | 5271.3 | 3286 | 2726.4 | 5603.4 |
| 2024 Q2 | 2024-04-01 | 60224.4 | 17555.9 | 4941.4 | 3344 | 2642.9 | 6401.2 |
| 2024 Q3 | 2024-07-01 | 66315.9 | 14726 | 4384.2 | 2555.6 | 2350.8 | 7484.8 |
| 2024 Q4 | 2024-10-01 | 83888.7 | 17716.5 | 5103 | 3137 | 2572.9 | 8513.3 |
| 2025 Q1 | 2025-01-01 | 97047.2 | 23182.9 | 6603.4 | 3574.9 | 3221.6 | 9029 |
| 2025 Q2 | 2025-04-01 | 91033.8 | 27517.5 | 6433.3 | 5046 | 3517.6 | 10451.8 |
| 2025 Q3 | 2025-07-01 | 94017.1 | 33105.4 | 7879.4 | 6128.3 | 4024 | 10776.1 |
| 2025 Q4 | 2025-10-01 | 72443.7 | 22735.2 | 5823.3 | 4954.3 | 3014.8 | 8495.1 |
| 2026 Q1 | 2026-01-01 | 86217.6 | 36085.1 | 8132.7 | 6761.7 | 4665.4 | 10381.3 |
How far farm proprietors’ income sits from its 2021–23 peak

View exact chart values
| state | peak_period | peak_saar_millions | latest_period | latest_saar_millions | pct_from_peak |
|---|---|---|---|---|---|
| North Dakota | 2022 Q2 | 5133.1 | 2026 Q1 | 3425.3 | -33.3 |
| Iowa | 2022 Q3 | 10832.9 | 2026 Q1 | 8132.7 | -24.9 |
| United States | 2023 Q1 | 109111.2 | 2026 Q1 | 86217.6 | -21 |
| South Dakota | 2023 Q1 | 5116.8 | 2026 Q1 | 4665.4 | -8.8 |
| Nebraska | 2021 Q2 | 7059.9 | 2026 Q1 | 6761.7 | -4.2 |
| Plains | 2021 Q2 | 37315.5 | 2026 Q1 | 36085.1 | -3.3 |
| Texas | 2023 Q1 | 10027 | 2026 Q1 | 10381.3 | 3.5 |
| Kansas | 2021 Q2 | 4483 | 2026 Q1 | 6403.6 | 42.8 |
The 2022 boom is over. 2026 Q1 is not a wipeout.
Trace the line and the commodity boom is obvious. U.S. farm proprietors’ income jumped from about $37 billion, annualized, in early 2019 to more than $100 billion in 2021–22. Iowa’s series went from under $2 billion to $10.8 billion. Then it gave the money back. By late 2023 the national rate had halved from its peak. Iowa’s 2023 Q4 reading, $4.0 billion, was closer to a pre-boom year than to 2022. The 2025 recovery — Iowa back to $7.9 billion in 2025 Q3 — is what a 90-day diesel freeze is now being asked to protect. 2026 Q1 looks like another bounce, not a new cliff.
The geography of the hangover is uneven, which is why a single “farm income is dying” slogan is a poor brief. From each area’s own 2021–23 high to 2026 Q1, North Dakota is still down 33 percent and Iowa 25 percent. The Plains region as a whole is only 3 percent below its 2021 Q2 peak. Texas is 3.5 percent above its 2023 Q1 high. Kansas is 43 percent above a 2021 Q2 peak that was not its strongest recent year. Different crops, different peaks, same national talking point. None of those gaps can be blamed on a war that was two months old when the quarter closed. They can, however, explain why Grassley is shouting and why a Texas oil-state senator called the same ban a “gimmick.”
Farm income is also a thin slice of the whole paycheck, even in Iowa. In 2026 Q1 it was 3.6 percent of Iowa personal income and 2.2 percent of the Plains total, against 0.32 percent nationally. At the 2022 peak Iowa’s share briefly topped 5 percent. That is real money in towns where the co-op and the John Deere dealer set the mood. It is not the state’s economy. A diesel freeze that shaved farm diesel costs would still be a policy aimed at a few percent of income — and at a series that excludes the corporate farms that buy a lot of the diesel. If the White House wants to say it is rescuing rural America, the books say it is rescuing a volatile minority of rural receipts.
The household fuel bill was already fatter where the ban has fans
The consumer half of the pitch is easier to map, and less convenient for anyone who thinks a Midwest export freeze is a free lunch for coastal drivers. In 2024, the last full year on the BEA consumption accounts, Americans spent $1,295 per person on gasoline and other energy goods. Iowans spent $1,834 — 42 percent above the national figure. Nebraskans spent $1,906, the highest in this set. New Yorkers spent $816, 37 percent below the U.S. average. Californians, whose stranded diesel cargoes are supposed to be the cautionary tale, spent $1,217, a bit under the national line. Texas, which both farms and refines, sat near the middle at $1,367.
Share of the whole household budget tells the same story with less sympathy for Manhattan. Gasoline and other energy goods were 3.71 percent of Iowa’s per capita consumption in 2024, 2.53 percent in Texas, 2.21 percent nationally, 1.80 percent in California and 1.23 percent in New York. Put differently, the states lobbying hardest for a diesel export freeze already devote two to three times as much of household spending to pump-adjacent fuels as the coastal states that import the diesel those states want to keep home. That is not because Iowa has no buses. It is because people drive farther, own more pickups, and heat some of the same gallons in a category that also includes fuel oil.
The 2022 price spike was not a farm-state special. Indexed to 2019, U.S. per capita gasoline-and-energy-goods spending peaked at 144 in 2022 and was still 121 in 2024. Iowa’s index peaked at 140 and sat at 117. California’s 2024 index, 125, was a hair hotter than Iowa’s. Everyone got the bill. Not everyone spends as much of the paycheck on it. Analysts at the Atlantic Council, cited in the Time reporting, warned that trapping diesel in the Gulf and Midwest could cheapen fuel there and raise it on the coasts if inland barrels cannot move fast enough. The 2024 ledger cannot test that forecast. It can say who already lives with a fatter fuel line: Iowa and Nebraska, not New York.
Household gasoline and energy-goods bills, 2024

View exact chart values
| state | dollars_per_capita_2024 | dollars_per_capita_2019 | dollars_per_capita_2022 | index_vs_us_2024 |
|---|---|---|---|---|
| Nebraska | 1906 | 1516 | 2181 | 147.2 |
| Iowa | 1834 | 1569 | 2201 | 141.6 |
| Texas | 1367 | 1161 | 1680 | 105.6 |
| United States | 1295 | 1067 | 1541 | 100 |
| Kansas | 1268 | 1077 | 1510 | 97.9 |
| California | 1217 | 977 | 1447 | 94 |
| South Dakota | 1191 | 946 | 1356 | 92 |
| Washington | 1053 | 918 | 1275 | 81.3 |
| North Dakota | 1000 | 977 | 1268 | 77.2 |
| Alaska | 972 | 891 | 1145 | 75.1 |
| New York | 816 | 668 | 957 | 63 |
Gasoline bills after 2019, indexed

View exact chart values
| year | US | Iowa | Texas | California | New_York |
|---|---|---|---|---|---|
| 2015 | 92.9 | 96.5 | 95 | 81.9 | 92.2 |
| 2016 | 82.9 | 86 | 83.3 | 76.5 | 80.8 |
| 2017 | 93 | 95 | 91.7 | 89.3 | 91.5 |
| 2018 | 104.6 | 105.4 | 103.5 | 101.4 | 103.6 |
| 2019 | 100 | 100 | 100 | 100 | 100 |
| 2020 | 73 | 73.2 | 73.3 | 73.5 | 71.3 |
| 2021 | 108.9 | 108.3 | 107.6 | 112.1 | 104.8 |
| 2022 | 144.4 | 140.3 | 144.7 | 148.1 | 143.3 |
| 2023 | 129.3 | 126.3 | 127.5 | 133.6 | 129.5 |
| 2024 | 121.4 | 116.9 | 117.7 | 124.6 | 122.2 |
Fuel’s slice of the household spending pie, 2024

View exact chart values
| state | gas_dollars | total_pce_dollars | gas_share_pct |
|---|---|---|---|
| Iowa | 1834 | 49473 | 3.71 |
| Texas | 1367 | 54060 | 2.53 |
| United States | 1295 | 58499 | 2.21 |
| California | 1217 | 67565 | 1.8 |
| Alaska | 972 | 66356 | 1.46 |
| New York | 816 | 66426 | 1.23 |
What a 90-day freeze cannot see
Two caveats belong next to the findings, not in a footnote. First, farm proprietors’ income is not a diesel invoice. It moves with crop prices, livestock receipts, government payments, depreciation and the weather. A 2026 Q1 bounce while diesel was setting records is a reminder that net farm income can rise even when a major input is expensive, if output prices or other receipts move more. Second, household PCE on “gasoline and other energy goods” is not the farm diesel Grassley is talking about, and 2024 is not 2026. The official consumption year ends before this autumn’s $6.50 diesel. If the White House wants to know what record distillate is doing to farmers this month, it needs weekly fuel tickets, not last year’s state PCE.
Those limits still leave a usable brief. The income series farm-state Republicans are invoking had its crash in 2023–24, recovered through 2025, and was not collapsing in the first wartime quarter. The household fuel series they are less eager to quote shows why a Midwest-first export freeze is popular in Des Moines: Iowans already spend about $1,800 a year per person at the pump-and-fuel-oil counter, and New Yorkers about $800. A policy that cheapens diesel in the heartland and risks raising it on the coasts would be transferring relief toward the places that already spend more — which, for a midterm, is the point. Wright’s warning still stands. The same barrel that becomes diesel in a U.S. refinery is attached to gasoline and jet fuel. The books cannot tell you whether a 90-day freeze “works.” They can tell you whose income already fell from the boom, and whose gasoline line was already the fat one.
Sources and methods
Farm proprietors’ income is BEA SQINC4, seasonally adjusted annual rate, millions of current dollars, through 2026 Q1, from the 25 June 2026 quarterly state personal-income release. It is the net income of farm sole proprietorships and partnerships and excludes corporate farms. Percent-from-peak uses each geography’s highest quarter in 2021–2023, so peaks are not simultaneous.
Household fuel spending is BEA SAPCE2 per capita PCE on gasoline and other energy goods (motor vehicle fuels, lubricants, fluids, and fuel oils) and total per capita PCE, annual, through 2024, from the 26 September 2025 SAPCE release. These are household consumption outlays, not farm diesel input costs, and they do not include 2025–26 pump prices.
Personal-income shares divide farm proprietors’ income by total personal income in the same quarter and geography. Missing observations were not treated as zero. No causal effect of diesel prices, the Iran war, or an export ban is inferred from these descriptive comparisons. Observation dates are not release dates; 2026 Q1 mixes January with the first two months of the war.
Research completed 2026-09-24, for the September 23, 2026 news edition. The available source data may cover earlier periods; see the observation periods and source vintages above.