Research
The computers overtook the houses. The payrolls did not.
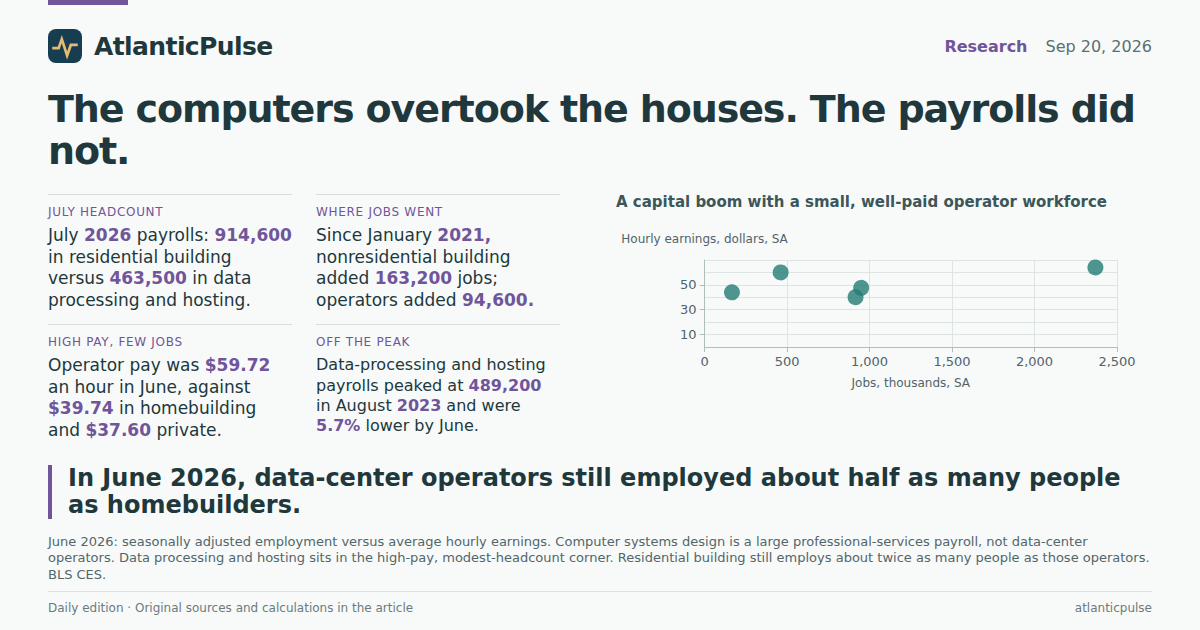
A capital story that still looks like a housing payroll
A San Francisco Fed note, amplified in Fortune, said something that sounds like a regime change: inflation-adjusted spending on information-processing equipment, including data centers and computer hardware, edged past private residential investment in the second quarter of 2026. That is a statement about capital. It is not a statement about jobs. The Current Employment Statistics survey, the government's monthly payroll count, is the place to ask whether the people on those sites followed the money.
They did not, at least not if the question is who clocks in to run the machines. In July 2026, the last month in this CES snapshot, residential building construction still employed 914,600 people on a seasonally adjusted basis. Computing infrastructure providers, data processing, web hosting and related services — the industry closest to hyperscale operators — employed 463,500. Homebuilders still had about twice as many jobs as the operator workforce, even after a year in which everyone with a 401(k) learned to pronounce "gigawatt." Nonresidential building construction, which includes factories, warehouses and some of the shells that hold the servers, employed 953,300, slightly more than homebuilding and more than twice the operator payroll.
That comparison is easy to abuse, so the caveats belong next to it. CES counts payroll jobs, not the contractors who show up for a pour and leave. Data-processing and hosting is not a pure "data center" series; it includes web hosts and related computing infrastructure. Residential building construction is not the entire housing workforce — specialty trades, real-estate offices and lumberyards sit elsewhere. None of this measures the $752 billion versus $748 billion investment split in the national accounts. It answers a blunter question: if the boom is already bigger than housing in the capital accounts, is it bigger on the shop floor?
Housing still employs more people than data-center operators

View exact chart values
| month | residential_building | nonresidential_building | industrial_building | data_processing_hosting | computer_systems_design | software_publishers | utility_system_construction | construction_total |
|---|---|---|---|---|---|---|---|---|
| 2019-01 | 815.3 | 836.3 | 165.5 | 330.9 | 2153.6 | 440.9 | 567.2 | 7425 |
| 2019-02 | 812.9 | 836.2 | 165.6 | 333.9 | 2156.9 | 443.6 | 558.9 | 7395 |
| 2019-03 | 816.5 | 837.4 | 165.1 | 336.1 | 2168.7 | 447.9 | 565.7 | 7425 |
| 2019-04 | 811.9 | 837.4 | 163.1 | 336.9 | 2180.7 | 453 | 571.4 | 7468 |
| 2019-05 | 813.2 | 837.9 | 160.8 | 338 | 2189.4 | 459.4 | 567.2 | 7478 |
| 2019-06 | 817.1 | 839.4 | 160.2 | 340.4 | 2199.7 | 465.8 | 570.5 | 7502 |
| 2019-07 | 818.9 | 843.5 | 160.9 | 345.1 | 2208.2 | 469.8 | 568.2 | 7526 |
| 2019-08 | 826.4 | 843.6 | 161 | 347.9 | 2216.4 | 473.5 | 572.1 | 7530 |
| 2019-09 | 827.1 | 843 | 160.6 | 349.1 | 2214.1 | 478.8 | 574.5 | 7547 |
| 2019-10 | 828.6 | 844.4 | 160.9 | 351 | 2213.8 | 482.6 | 577.4 | 7553 |
| 2019-11 | 830.4 | 841.7 | 158.9 | 353 | 2218.9 | 485.7 | 579.3 | 7541 |
| 2019-12 | 827 | 846.9 | 160.9 | 355.8 | 2213.6 | 488.3 | 578.3 | 7527 |
| 2020-01 | 827.6 | 850.2 | 160.8 | 364.1 | 2228.5 | 493.6 | 581.2 | 7575 |
| 2020-02 | 835.5 | 851.4 | 159.7 | 363.8 | 2234.1 | 503 | 580.3 | 7610 |
| 2020-03 | 831.9 | 843.3 | 156.9 | 364.9 | 2219.8 | 505.3 | 574.3 | 7541 |
| 2020-04 | 708.4 | 744.2 | 129 | 360.1 | 2165.8 | 499.6 | 521.2 | 6522 |
| 2020-05 | 772.1 | 778.2 | 132.6 | 356.6 | 2166.1 | 498.6 | 534.3 | 7004 |
| 2020-06 | 794.3 | 783.4 | 133.5 | 364.2 | 2167.7 | 497.2 | 531.2 | 7159 |
| 2020-07 | 803.7 | 782.5 | 131.6 | 365.7 | 2167.2 | 498.2 | 535.4 | 7196 |
| 2020-08 | 811.4 | 785.8 | 132.5 | 355.4 | 2180.6 | 501.9 | 533.9 | 7226 |
| 2020-09 | 820.3 | 785.9 | 134.6 | 357.5 | 2191.3 | 507.4 | 528.1 | 7253 |
| 2020-10 | 827.3 | 792.4 | 139 | 365 | 2202.5 | 511.4 | 531 | 7301 |
| 2020-11 | 828.7 | 789.6 | 137.1 | 365.9 | 2208.3 | 515.1 | 537.5 | 7321 |
| 2020-12 | 836.2 | 786.8 | 136.9 | 367.6 | 2222.1 | 522.8 | 539.2 | 7357 |
| 2021-01 | 841.8 | 785.9 | 135.9 | 366.5 | 2232.6 | 529.5 | 536.9 | 7362 |
| 2021-02 | 844 | 778.4 | 132.9 | 372.1 | 2249 | 532.9 | 530.8 | 7278 |
| 2021-03 | 856 | 786.3 | 134.4 | 375.1 | 2260.5 | 537.9 | 540.8 | 7399 |
| 2021-04 | 853.1 | 788.8 | 136.7 | 386.5 | 2272.3 | 542.4 | 542.5 | 7400 |
| 2021-05 | 854.8 | 791.6 | 138.5 | 387.7 | 2279.1 | 552.9 | 541 | 7391 |
| 2021-06 | 859.3 | 790.8 | 138.9 | 399.6 | 2296.9 | 557.3 | 540.4 | 7393 |
| 2021-07 | 868.3 | 796.4 | 140.7 | 405.9 | 2319.6 | 563.5 | 539.3 | 7425 |
| 2021-08 | 875.9 | 790.7 | 141.2 | 412.8 | 2332 | 567.6 | 540.2 | 7432 |
| 2021-09 | 882.5 | 802.4 | 141.8 | 420.4 | 2348.9 | 569.4 | 542.5 | 7484 |
| 2021-10 | 883.3 | 801.3 | 141.8 | 427 | 2361.2 | 578.3 | 547.6 | 7518 |
| 2021-11 | 890.3 | 807.5 | 143 | 431.9 | 2377.8 | 586.9 | 546.8 | 7562 |
| 2021-12 | 895.5 | 809.6 | 143.3 | 433.8 | 2389.5 | 594.1 | 551 | 7595 |
| 2022-01 | 901.4 | 812.7 | 142.4 | 441 | 2406.9 | 604.1 | 551.6 | 7595 |
| 2022-02 | 907.7 | 817.4 | 143 | 445.6 | 2413.6 | 611.1 | 551.4 | 7651 |
| 2022-03 | 910.9 | 826.2 | 146.2 | 448.6 | 2436.5 | 621 | 555 | 7692 |
| 2022-04 | 916.3 | 829.4 | 148.1 | 455.1 | 2441.6 | 626.9 | 557.7 | 7698 |
| 2022-05 | 923.7 | 830.6 | 147.6 | 461 | 2453.3 | 633.1 | 560.3 | 7738 |
| 2022-06 | 921.8 | 831.1 | 145.8 | 464.4 | 2458.3 | 641.9 | 562 | 7761 |
| 2022-07 | 926.4 | 831.8 | 145.6 | 468.8 | 2457.1 | 648.9 | 563.1 | 7792 |
| 2022-08 | 926.1 | 833.6 | 145.9 | 473.7 | 2462 | 653.7 | 563.9 | 7801 |
| 2022-09 | 925.1 | 840.1 | 145.9 | 479.1 | 2469.3 | 659.1 | 566.5 | 7832 |
| 2022-10 | 927.4 | 844.1 | 145.1 | 481.7 | 2479 | 657.4 | 568.7 | 7847 |
| 2022-11 | 927.8 | 852.2 | 146.4 | 483 | 2482.9 | 664.3 | 570.5 | 7863 |
| 2022-12 | 930.4 | 857.6 | 144.8 | 485.8 | 2483 | 660.2 | 571.8 | 7885 |
| 2023-01 | 931.3 | 870.8 | 151.1 | 484.8 | 2478.6 | 655.7 | 573.8 | 7932 |
| 2023-02 | 927.6 | 872.6 | 151.4 | 483.6 | 2481.3 | 658.9 | 576.5 | 7943 |
| 2023-03 | 924.5 | 871.2 | 151.9 | 483.3 | 2483.5 | 657.3 | 580.4 | 7926 |
| 2023-04 | 920.7 | 870.8 | 152.6 | 485.2 | 2482.4 | 658.3 | 575.5 | 7955 |
| 2023-05 | 921.3 | 872.5 | 153.8 | 484.9 | 2478.2 | 655.1 | 572.8 | 7965 |
| 2023-06 | 928.1 | 876.3 | 156.2 | 485.5 | 2472.9 | 657.2 | 579.8 | 8006 |
| 2023-07 | 918.6 | 880.4 | 156.1 | 488.6 | 2470.7 | 651.4 | 585.3 | 8016 |
| 2023-08 | 921.2 | 884.2 | 156.4 | 489.2 | 2467 | 651.3 | 588.3 | 8042 |
| 2023-09 | 926.4 | 886.6 | 156.4 | 485.3 | 2456.5 | 661.2 | 588.7 | 8053 |
| 2023-10 | 928.9 | 891.4 | 158.3 | 484.1 | 2454 | 645.1 | 588.3 | 8080 |
| 2023-11 | 926.9 | 893.7 | 159.9 | 483.8 | 2451.1 | 642.7 | 590.6 | 8088 |
| 2023-12 | 928.6 | 895.8 | 159.4 | 484.2 | 2449.8 | 643.6 | 592.5 | 8100 |
| 2024-01 | 930.3 | 899.1 | 160.8 | 483.5 | 2446.9 | 641.9 | 597.9 | 8123 |
| 2024-02 | 930.1 | 903 | 162.7 | 482.6 | 2444.6 | 639.8 | 596.8 | 8132 |
| 2024-03 | 939.4 | 905.1 | 162.7 | 482.6 | 2439.8 | 642 | 596.8 | 8164 |
| 2024-04 | 938.1 | 907.1 | 161.8 | 483.2 | 2441 | 643.9 | 597.6 | 8170 |
| 2024-05 | 937.1 | 904.6 | 161.9 | 481.7 | 2440.6 | 643.5 | 596.1 | 8176 |
| 2024-06 | 937.3 | 914.8 | 163.7 | 481.8 | 2444.7 | 644.2 | 597.8 | 8196 |
| 2024-07 | 934 | 916.6 | 164.3 | 480.3 | 2442.6 | 643.4 | 594.1 | 8208 |
| 2024-08 | 937.9 | 918.2 | 165.3 | 481.3 | 2437.2 | 641.7 | 600.8 | 8236 |
| 2024-09 | 939.5 | 916.9 | 167.6 | 481.5 | 2437.6 | 641.9 | 604 | 8254 |
| 2024-10 | 939.3 | 919.6 | 168.7 | 478.6 | 2433.4 | 646.9 | 605 | 8262 |
| 2024-11 | 937.4 | 920.9 | 167.7 | 478.6 | 2429.2 | 647.5 | 608.1 | 8267 |
| 2024-12 | 937.7 | 921.6 | 169.4 | 480.9 | 2431.4 | 651.4 | 610.6 | 8276 |
| 2025-01 | 937.3 | 922.4 | 169.3 | 481.3 | 2426.3 | 650.1 | 610.4 | 8264 |
| 2025-02 | 934.1 | 923.2 | 168.6 | 482.4 | 2416.7 | 652.2 | 613.6 | 8267 |
| 2025-03 | 935.5 | 924.6 | 167 | 482.9 | 2408.9 | 651.6 | 615.2 | 8273 |
| 2025-04 | 933.6 | 925.2 | 165.5 | 481.3 | 2411.3 | 650.6 | 616.3 | 8271 |
| 2025-05 | 932.9 | 926 | 165.1 | 481.2 | 2410.3 | 653.1 | 621 | 8269 |
| 2025-06 | 930.6 | 926.7 | 163.9 | 481.4 | 2399.9 | 652.7 | 616.1 | 8267 |
| 2025-07 | 928.1 | 925.5 | 164.5 | 480 | 2395.7 | 654.4 | 619.7 | 8261 |
| 2025-08 | 922.8 | 921.3 | 162.2 | 479.4 | 2394 | 656.3 | 620.8 | 8239 |
| 2025-09 | 926.7 | 919.7 | 159.9 | 476.3 | 2387.6 | 661.4 | 620.7 | 8255 |
| 2025-10 | 925.3 | 918.3 | 158.2 | 480.7 | 2379.7 | 657.6 | 623 | 8243 |
| 2025-11 | 928.4 | 925.6 | 160.3 | 479.6 | 2381.5 | 654.8 | 624.8 | 8279 |
| 2025-12 | 925.1 | 928.1 | 159.3 | 472.9 | 2380.6 | 656.8 | 627.4 | 8272 |
| 2026-01 | 926.6 | 932.9 | 161.6 | 467.5 | 2374.2 | 657.9 | 630.2 | 8317 |
| 2026-02 | 926.8 | 936.2 | 163 | 463.8 | 2379.1 | 656.6 | 629.6 | 8296 |
| 2026-03 | 927 | 937.9 | 164.5 | 464 | 2369.6 | 659.4 | 632.7 | 8311 |
| 2026-04 | 924.7 | 943.2 | 166.5 | 462.3 | 2369.5 | 659.8 | 637.3 | 8314 |
| 2026-05 | 918.9 | 945.1 | 166.6 | 465.7 | 2370 | 659.6 | 635.7 | 8316 |
| 2026-06 | 915.1 | 949.1 | 165.9 | 461.1 | 2369.2 | 659.7 | 637.6 | 8321 |
| 2026-07 | 914.6 | 953.3 | — | 463.5 | 2366.4 | — | — | 8343 |
Faster growth, smaller base
Indexed to January 2019, the operator series did outrun homebuilding. Data-processing and hosting payrolls were 40.1 percent above that starting point by July 2026. Residential building was up 12.2 percent. Nonresidential building was up 14.0 percent. Computer systems design and related services, a much larger professional-services industry that writes and installs systems rather than running server halls, was up 9.9 percent. Software publishers, observed through June, were up 49.6 percent from January 2019 — the steepest of this set — and then spent years oscillating near a late-2022 peak.
Growth rates flatter a small denominator. From January 2021, as the housing market froze and the AI buildout became a national argument, data-processing and hosting added 94,600 jobs through June 2026, a 25.8 percent increase. Residential building added 73,300 jobs, or 8.7 percent. Nonresidential building added 163,200, more than the operator industry and homebuilding combined. Utility system construction, the crews who string power lines and bury conduit, added 100,700. The operator boom is real. It is not where most of the new hard hats went.
The operator series also stopped compounding. Payrolls in data processing and hosting peaked at 489,200 in August 2023 and by June 2026 were 5.7 percent below that high. Residential building peaked later, at 939,500 in September 2024, and had eased 2.6 percent by June. Nonresidential building was still making new highs into July. If the investment accounts have crossed, the operator headcount crossed earlier, then sat down.
Operator payrolls grew faster than homebuilding — from a much smaller base

View exact chart values
| month | residential_building | nonresidential_building | industrial_building | data_processing_hosting | computer_systems_design | software_publishers | utility_system_construction |
|---|---|---|---|---|---|---|---|
| 2019-01 | 100 | 100 | 100 | 100 | 100 | 100 | 100 |
| 2019-02 | 99.7 | 100 | 100.1 | 100.9 | 100.2 | 100.6 | 98.5 |
| 2019-03 | 100.1 | 100.1 | 99.8 | 101.6 | 100.7 | 101.6 | 99.7 |
| 2019-04 | 99.6 | 100.1 | 98.5 | 101.8 | 101.3 | 102.7 | 100.7 |
| 2019-05 | 99.7 | 100.2 | 97.2 | 102.1 | 101.7 | 104.2 | 100 |
| 2019-06 | 100.2 | 100.4 | 96.8 | 102.9 | 102.1 | 105.6 | 100.6 |
| 2019-07 | 100.4 | 100.9 | 97.2 | 104.3 | 102.5 | 106.6 | 100.2 |
| 2019-08 | 101.4 | 100.9 | 97.3 | 105.1 | 102.9 | 107.4 | 100.9 |
| 2019-09 | 101.4 | 100.8 | 97 | 105.5 | 102.8 | 108.6 | 101.3 |
| 2019-10 | 101.6 | 101 | 97.2 | 106.1 | 102.8 | 109.5 | 101.8 |
| 2019-11 | 101.9 | 100.6 | 96 | 106.7 | 103 | 110.2 | 102.1 |
| 2019-12 | 101.4 | 101.3 | 97.2 | 107.5 | 102.8 | 110.8 | 102 |
| 2020-01 | 101.5 | 101.7 | 97.2 | 110 | 103.5 | 112 | 102.5 |
| 2020-02 | 102.5 | 101.8 | 96.5 | 109.9 | 103.7 | 114.1 | 102.3 |
| 2020-03 | 102 | 100.8 | 94.8 | 110.3 | 103.1 | 114.6 | 101.3 |
| 2020-04 | 86.9 | 89 | 77.9 | 108.8 | 100.6 | 113.3 | 91.9 |
| 2020-05 | 94.7 | 93.1 | 80.1 | 107.8 | 100.6 | 113.1 | 94.2 |
| 2020-06 | 97.4 | 93.7 | 80.7 | 110.1 | 100.7 | 112.8 | 93.7 |
| 2020-07 | 98.6 | 93.6 | 79.5 | 110.5 | 100.6 | 113 | 94.4 |
| 2020-08 | 99.5 | 94 | 80.1 | 107.4 | 101.3 | 113.8 | 94.1 |
| 2020-09 | 100.6 | 94 | 81.3 | 108 | 101.8 | 115.1 | 93.1 |
| 2020-10 | 101.5 | 94.8 | 84 | 110.3 | 102.3 | 116 | 93.6 |
| 2020-11 | 101.6 | 94.4 | 82.8 | 110.6 | 102.5 | 116.8 | 94.8 |
| 2020-12 | 102.6 | 94.1 | 82.7 | 111.1 | 103.2 | 118.6 | 95.1 |
| 2021-01 | 103.3 | 94 | 82.1 | 110.8 | 103.7 | 120.1 | 94.7 |
| 2021-02 | 103.5 | 93.1 | 80.3 | 112.5 | 104.4 | 120.9 | 93.6 |
| 2021-03 | 105 | 94 | 81.2 | 113.4 | 105 | 122 | 95.3 |
| 2021-04 | 104.6 | 94.3 | 82.6 | 116.8 | 105.5 | 123 | 95.6 |
| 2021-05 | 104.8 | 94.7 | 83.7 | 117.2 | 105.8 | 125.4 | 95.4 |
| 2021-06 | 105.4 | 94.6 | 83.9 | 120.8 | 106.7 | 126.4 | 95.3 |
| 2021-07 | 106.5 | 95.2 | 85 | 122.7 | 107.7 | 127.8 | 95.1 |
| 2021-08 | 107.4 | 94.5 | 85.3 | 124.8 | 108.3 | 128.7 | 95.2 |
| 2021-09 | 108.2 | 95.9 | 85.7 | 127 | 109.1 | 129.1 | 95.6 |
| 2021-10 | 108.3 | 95.8 | 85.7 | 129 | 109.6 | 131.2 | 96.5 |
| 2021-11 | 109.2 | 96.6 | 86.4 | 130.5 | 110.4 | 133.1 | 96.4 |
| 2021-12 | 109.8 | 96.8 | 86.6 | 131.1 | 111 | 134.7 | 97.1 |
| 2022-01 | 110.6 | 97.2 | 86 | 133.3 | 111.8 | 137 | 97.2 |
| 2022-02 | 111.3 | 97.7 | 86.4 | 134.7 | 112.1 | 138.6 | 97.2 |
| 2022-03 | 111.7 | 98.8 | 88.3 | 135.6 | 113.1 | 140.8 | 97.8 |
| 2022-04 | 112.4 | 99.2 | 89.5 | 137.5 | 113.4 | 142.2 | 98.3 |
| 2022-05 | 113.3 | 99.3 | 89.2 | 139.3 | 113.9 | 143.6 | 98.8 |
| 2022-06 | 113.1 | 99.4 | 88.1 | 140.3 | 114.1 | 145.6 | 99.1 |
| 2022-07 | 113.6 | 99.5 | 88 | 141.7 | 114.1 | 147.2 | 99.3 |
| 2022-08 | 113.6 | 99.7 | 88.2 | 143.2 | 114.3 | 148.3 | 99.4 |
| 2022-09 | 113.5 | 100.5 | 88.2 | 144.8 | 114.7 | 149.5 | 99.9 |
| 2022-10 | 113.7 | 100.9 | 87.7 | 145.6 | 115.1 | 149.1 | 100.3 |
| 2022-11 | 113.8 | 101.9 | 88.5 | 146 | 115.3 | 150.7 | 100.6 |
| 2022-12 | 114.1 | 102.5 | 87.5 | 146.8 | 115.3 | 149.7 | 100.8 |
| 2023-01 | 114.2 | 104.1 | 91.3 | 146.5 | 115.1 | 148.7 | 101.2 |
| 2023-02 | 113.8 | 104.3 | 91.5 | 146.1 | 115.2 | 149.4 | 101.6 |
| 2023-03 | 113.4 | 104.2 | 91.8 | 146.1 | 115.3 | 149.1 | 102.3 |
| 2023-04 | 112.9 | 104.1 | 92.2 | 146.6 | 115.3 | 149.3 | 101.5 |
| 2023-05 | 113 | 104.3 | 92.9 | 146.5 | 115.1 | 148.6 | 101 |
| 2023-06 | 113.8 | 104.8 | 94.4 | 146.7 | 114.8 | 149.1 | 102.2 |
| 2023-07 | 112.7 | 105.3 | 94.3 | 147.7 | 114.7 | 147.7 | 103.2 |
| 2023-08 | 113 | 105.7 | 94.5 | 147.8 | 114.6 | 147.7 | 103.7 |
| 2023-09 | 113.6 | 106 | 94.5 | 146.7 | 114.1 | 150 | 103.8 |
| 2023-10 | 113.9 | 106.6 | 95.6 | 146.3 | 113.9 | 146.3 | 103.7 |
| 2023-11 | 113.7 | 106.9 | 96.6 | 146.2 | 113.8 | 145.8 | 104.1 |
| 2023-12 | 113.9 | 107.1 | 96.3 | 146.3 | 113.8 | 146 | 104.5 |
| 2024-01 | 114.1 | 107.5 | 97.2 | 146.1 | 113.6 | 145.6 | 105.4 |
| 2024-02 | 114.1 | 108 | 98.3 | 145.8 | 113.5 | 145.1 | 105.2 |
| 2024-03 | 115.2 | 108.2 | 98.3 | 145.8 | 113.3 | 145.6 | 105.2 |
| 2024-04 | 115.1 | 108.5 | 97.8 | 146 | 113.3 | 146 | 105.4 |
| 2024-05 | 114.9 | 108.2 | 97.8 | 145.6 | 113.3 | 146 | 105.1 |
| 2024-06 | 115 | 109.4 | 98.9 | 145.6 | 113.5 | 146.1 | 105.4 |
| 2024-07 | 114.6 | 109.6 | 99.3 | 145.1 | 113.4 | 145.9 | 104.7 |
| 2024-08 | 115 | 109.8 | 99.9 | 145.5 | 113.2 | 145.5 | 105.9 |
| 2024-09 | 115.2 | 109.6 | 101.3 | 145.5 | 113.2 | 145.6 | 106.5 |
| 2024-10 | 115.2 | 110 | 101.9 | 144.6 | 113 | 146.7 | 106.7 |
| 2024-11 | 115 | 110.1 | 101.3 | 144.6 | 112.8 | 146.9 | 107.2 |
| 2024-12 | 115 | 110.2 | 102.4 | 145.3 | 112.9 | 147.7 | 107.7 |
| 2025-01 | 115 | 110.3 | 102.3 | 145.5 | 112.7 | 147.4 | 107.6 |
| 2025-02 | 114.6 | 110.4 | 101.9 | 145.8 | 112.2 | 147.9 | 108.2 |
| 2025-03 | 114.7 | 110.6 | 100.9 | 145.9 | 111.9 | 147.8 | 108.5 |
| 2025-04 | 114.5 | 110.6 | 100 | 145.5 | 112 | 147.6 | 108.7 |
| 2025-05 | 114.4 | 110.7 | 99.8 | 145.4 | 111.9 | 148.1 | 109.5 |
| 2025-06 | 114.1 | 110.8 | 99 | 145.5 | 111.4 | 148 | 108.6 |
| 2025-07 | 113.8 | 110.7 | 99.4 | 145.1 | 111.2 | 148.4 | 109.3 |
| 2025-08 | 113.2 | 110.2 | 98 | 144.9 | 111.2 | 148.9 | 109.4 |
| 2025-09 | 113.7 | 110 | 96.6 | 143.9 | 110.9 | 150 | 109.4 |
| 2025-10 | 113.5 | 109.8 | 95.6 | 145.3 | 110.5 | 149.1 | 109.8 |
| 2025-11 | 113.9 | 110.7 | 96.9 | 144.9 | 110.6 | 148.5 | 110.2 |
| 2025-12 | 113.5 | 111 | 96.3 | 142.9 | 110.5 | 149 | 110.6 |
| 2026-01 | 113.7 | 111.6 | 97.6 | 141.3 | 110.2 | 149.2 | 111.1 |
| 2026-02 | 113.7 | 111.9 | 98.5 | 140.2 | 110.5 | 148.9 | 111 |
| 2026-03 | 113.7 | 112.1 | 99.4 | 140.2 | 110 | 149.6 | 111.5 |
| 2026-04 | 113.4 | 112.8 | 100.6 | 139.7 | 110 | 149.6 | 112.4 |
| 2026-05 | 112.7 | 113 | 100.7 | 140.7 | 110 | 149.6 | 112.1 |
| 2026-06 | 112.2 | 113.5 | 100.2 | 139.3 | 110 | 149.6 | 112.4 |
| 2026-07 | 112.2 | 114 | — | 140.1 | 109.9 | — | — |
Since 2021, nonresidential building added more jobs than data-center operators

View exact chart values
| industry | jan2021_thousands | june2026_thousands | change_thousands | pct_change |
|---|---|---|---|---|
| Computer systems design and related | 2232.6 | 2369.2 | 136.6 | 6.1 |
| Residential building construction | 841.8 | 915.1 | 73.3 | 8.7 |
| Construction (all) | 7362 | 8321 | 959 | 13 |
| Utility system construction | 536.9 | 637.6 | 100.7 | 18.8 |
| Nonresidential building construction | 785.9 | 949.1 | 163.2 | 20.8 |
| Industrial building construction | 135.9 | 165.9 | 30 | 22.1 |
| Software publishers | 529.5 | 659.7 | 130.2 | 24.6 |
| Data processing, hosting and related | 366.5 | 461.1 | 94.6 | 25.8 |
Do not confuse operators with the rest of "tech"
Computer systems design is the industry that makes the operator comparison look ridiculous if you mash the labels together. In June 2026 it employed 2.369 million people, about 2.6 times the residential building payroll and more than five times data-processing and hosting. It is professional and business services: consultants, programmers, systems analysts. Some of those people work on AI. They are not, as a group, sitting in a windowless hall in northern Virginia watching coolant temperatures. Treating that payroll as "data center jobs" is how a capital boom gets talked about as a mass employer.
The construction supersector is the other way to oversell the boom. All construction employed 8.321 million in June and 8.343 million in July, a reminder that framers, electricians, highway crews and plumbers still dwarf the server-hall staff. Industrial building construction, a slice of nonresidential building and not an extra pile of jobs to add on top, employed 165,900 in June — smaller than the operator industry, and only 22.1 percent above January 2021. The slabs are being poured. The pouring is not a new mass-employment program on the scale of the housing industry it supposedly replaced.
June is the last month when every series in this comparison is observed. July figures exist for homebuilding, nonresidential building, operators, computer systems design, construction and the private sector; they do not yet exist here for software publishers, industrial building or utility construction. Missing is not zero. The July operator count, 463,500, is a rounding error above June. The story does not turn on the extra month.
A capital boom with a small, well-paid operator workforce

View exact chart values
| industry | jobs_thousands | hourly_dollars |
|---|---|---|
| Residential building | 915.1 | 39.74 |
| Nonresidential building | 949.1 | 47.25 |
| Industrial building | 165.9 | 43.67 |
| Data processing / hosting | 461.1 | 59.72 |
| Computer systems design | 2369.2 | 63.69 |
The pay is high. The headcount is not.
Where the operator jobs exist, they pay. In June 2026, average hourly earnings of all employees in data-processing and hosting were $59.72, seasonally adjusted. Computer systems design paid $63.69. Residential building construction paid $39.74. The private-sector average was $37.60. That is not a household budget, and it is not take-home pay after benefits; it is the CES hourly average. It still means the operator job pays about 1.5 times the homebuilding job and about 1.6 times the private average.
Those premiums have widened a little, not exploded. Since January 2019, operator hourly earnings are up 42.9 percent, against 32.9 percent in residential building, 32.2 percent in computer systems design and 36.3 percent for the private sector. The people inside the fence got a raise. There are still only about 461,000 of them on the operator payroll, 0.34 percent of private employment. Residential building, for all the talk of a frozen housing market, is 0.68 percent. An NBC News poll cited in the same investment-crossover reporting found 64 percent of registered voters less likely to back a candidate who wants a data center in the community. The politics are easier to understand once the job count is in view: a lot of power demand, a lot of capital, and a workforce that does not show up like a mill.
The operator jobs pay more. There are not many of them.

View exact chart values
| industry | hourly_dollars |
|---|---|
| Total private | 37.6 |
| Residential building construction | 39.74 |
| Industrial building construction | 43.67 |
| Nonresidential building construction | 47.25 |
| Data processing, hosting and related | 59.72 |
| Computer systems design and related | 63.69 |
What readers can take from the crossover
Put the pieces on one scatter and the shape is almost insultingly clear. Computer systems design sits far to the right: more than two million jobs, top-end pay. Data processing and hosting sits up and left: high pay, modest headcount. Residential and nonresidential building sit in the middle of the job axis with lower hourly earnings. Industrial building is a small construction niche, not a substitute for either housing or hyperscale. None of these points is a prediction that investment will fail, or that AI will not change the economy. They are a map of who is on a payroll now.
The useful distinction is between capital and employment, and between operators and everyone else who gets called "tech." The national accounts can put computers ahead of houses because a handful of firms will spend through higher interest rates, as Treasury Secretary Scott Bessent has noted. CES can still show homebuilders employing nearly twice as many people as the operator industry, nonresidential builders adding more jobs since 2021 than the operators did, and the operator series off its 2023 peak. If the political question is whether the AI buildout has already replaced housing as a job machine, the payroll survey's answer through mid-2026 is no. It replaced housing as a place to park money. That is a different machine.
Sources and methods
Payroll figures are U.S. Bureau of Labor Statistics Current Employment Statistics (CES) national series, seasonally adjusted, in thousands of jobs unless noted. Average hourly earnings are for all employees, in current dollars, seasonally adjusted, and are industry averages rather than household income or weekly pay.
The CES snapshot used here is the official all-history extract pinned in this catalogue (release identifier bls-ce-snapshot-2026-08-24). Observations run through July 2026 for residential building, nonresidential building, data processing and hosting, computer systems design, construction, and total private employment. Software publishers, industrial building construction, utility system construction, and the earnings series used in pay comparisons are last observed in June 2026. Comparisons that need every industry use June 2026. Missing months are omitted; they are not treated as zero.
Computing infrastructure providers, data processing, web hosting and related services is the closest CES industry to hyperscale data-center operators. It is not a dedicated data-center count. Computer systems design and related services is professional and business services, not operator staff. Industrial building construction is a subset of nonresidential building construction and is never added to it. Residential building construction is not the entire housing workforce.
Duplicate period keys, if any, kept the first non-null observation. No series in the extracts used here had duplicates. Percent changes and ratios are calculated from the published levels. These are descriptive payroll comparisons, not estimates of causal effects from AI investment, interest rates, or housing policy, and they are not a reconstruction of Bureau of Economic Analysis fixed-investment accounts.
Routine production lag applies: the figures are the latest observations in the pinned snapshot, not same-day counts for 20 September 2026.
Research completed 2026-09-21, for the September 20, 2026 news edition. The available source data may cover earlier periods; see the observation periods and source vintages above.