Research
The clinic still outspends the pump, even in Texas
Two invoices, one election
Cindy Banda of McAllen, Texas, voted for Donald Trump three times. After a year of breast-cancer treatment left her more than $25,000 in medical debt even with job-based insurance, she cast her first Democratic ballot, the Associated Press reported. At a Georgia rally the same weekend, Trump said American oil and gas firms were “making a freaking fortune” while AAA put regular gasoline at $4.29 a gallon. Those are two different receipts. The question for readers walking into a midterm is which one is actually the larger item on the country’s official spending books — and whether Texas, of all places, is an exception.
The Bureau of Economic Analysis publishes annual personal consumption expenditures by state through calendar year 2025. That is last year’s closed books, not this week’s pump. Per-person figures are not household averages, and they are in current dollars, so inflation is inside the rise. Even with those caveats, the pattern is blunt. In 2025, Americans spent $10,442 per person on health-care services — outpatient visits, hospitals and nursing homes — and $1,225 on gasoline and other energy goods, which bundle motor fuels with fuel oil. That is $8.52 of clinic for every $1 of pump, and 17.1 percent of total per capita spending versus 2.0 percent.
U.S. health-care services have pulled far ahead of the pump

View exact chart values
| year | health_pc | gas_pc | total_pc | health_share_pct | gas_share_pct | health_to_gas | broad_health_pc | motor_fuels_pc | broad_to_fuels | hospitals_pc | hospitals_bil | pharma_pc | pharma_bil | health_fn_bil | ins_bil | broad_bil | motor_fuels_bil | total_pce_bil |
|---|---|---|---|---|---|---|---|---|---|---|---|---|---|---|---|---|---|---|
| 2000 | 3255 | 654 | 23983 | 13.6 | 2.7 | 4.98 | 4267 | 598 | 7.14 | 1396 | 393.9 | 557 | 157.1 | 1109.6 | 94.4 | 1204 | 168.6 | 6767.2 |
| 2001 | 3497 | 625 | 24823 | 14.1 | 2.5 | 5.6 | 4599 | 570 | 8.07 | 1499 | 427.1 | 628 | 178.9 | 1209.4 | 101.1 | 1310.5 | 162.5 | 7073.8 |
| 2002 | 3765 | 584 | 25550 | 14.7 | 2.3 | 6.45 | 4949 | 534 | 9.27 | 1632 | 469.5 | 688 | 198 | 1317.1 | 106.5 | 1423.6 | 153.6 | 7348.9 |
| 2003 | 3978 | 677 | 26682 | 14.9 | 2.5 | 5.88 | 5265 | 617 | 8.53 | 1718 | 498.4 | 751 | 217.8 | 1410.7 | 116.7 | 1527.4 | 179 | 7740.7 |
| 2004 | 4231 | 795 | 28114 | 15 | 2.8 | 5.32 | 5572 | 729 | 7.65 | 1837 | 537.9 | 798 | 233.6 | 1514.9 | 116.5 | 1631.5 | 213.4 | 8232 |
| 2005 | 4469 | 960 | 29674 | 15.1 | 3.2 | 4.66 | 5894 | 885 | 6.66 | 1953 | 577.2 | 831 | 245.5 | 1612.3 | 129.4 | 1741.6 | 261.4 | 8769.1 |
| 2006 | 4665 | 1071 | 31092 | 15 | 3.4 | 4.36 | 6186 | 992 | 6.24 | 2068 | 617 | 914 | 272.8 | 1715 | 130.6 | 1845.7 | 295.9 | 9277.2 |
| 2007 | 4907 | 1147 | 32356 | 15.2 | 3.5 | 4.28 | 6488 | 1062 | 6.11 | 2185 | 658.1 | 961 | 289.6 | 1823.2 | 131.3 | 1954.5 | 319.9 | 9746.6 |
| 2008 | 5115 | 1286 | 33049 | 15.5 | 3.9 | 3.98 | 6703 | 1187 | 5.65 | 2268 | 689.8 | 983 | 298.9 | 1909.3 | 129.1 | 2038.3 | 361 | 10050.1 |
| 2009 | 5322 | 936 | 32243 | 16.5 | 2.9 | 5.69 | 6916 | 860 | 8.04 | 2400 | 736.3 | 1017 | 312.1 | 1999.3 | 122.4 | 2121.7 | 263.8 | 9891.2 |
| 2010 | 5493 | 1088 | 33164 | 16.6 | 3.3 | 5.05 | 7179 | 1009 | 7.12 | 2488 | 769.9 | 1041 | 322.1 | 2078.1 | 143 | 2221.1 | 312.1 | 10260.3 |
| 2011 | 5635 | 1327 | 34309 | 16.4 | 3.9 | 4.25 | 7397 | 1240 | 5.96 | 2556 | 797 | 1083 | 337.6 | 2153.2 | 153.3 | 2306.5 | 386.8 | 10698.9 |
| 2012 | 5794 | 1342 | 35145 | 16.5 | 3.8 | 4.32 | 7561 | 1266 | 5.97 | 2642 | 830.3 | 1113 | 349.9 | 2230.7 | 145.8 | 2376.6 | 397.8 | 11047.4 |
| 2013 | 5884 | 1331 | 35956 | 16.4 | 3.7 | 4.42 | 7702 | 1249 | 6.17 | 2708 | 857.7 | 1139 | 360.8 | 2285.2 | 154.1 | 2439.3 | 395.7 | 11388.2 |
| 2014 | 6094 | 1287 | 37194 | 16.4 | 3.5 | 4.74 | 8057 | 1200 | 6.71 | 2802 | 894.6 | 1215 | 387.9 | 2395.1 | 177 | 2572.2 | 383.1 | 11874.5 |
| 2015 | 6400 | 991 | 38213 | 16.7 | 2.6 | 6.46 | 8463 | 924 | 9.16 | 2950 | 949.5 | 1283 | 413 | 2536.3 | 187.1 | 2723.4 | 297.4 | 12297.4 |
| 2016 | 6674 | 885 | 39238 | 17 | 2.3 | 7.54 | 8794 | 828 | 10.62 | 3060 | 992.6 | 1304 | 423 | 2652.1 | 200.1 | 2852.2 | 268.6 | 12726.8 |
| 2017 | 6875 | 992 | 40693 | 16.9 | 2.4 | 6.93 | 9065 | 926 | 9.79 | 3131 | 1022.7 | 1332 | 435.1 | 2745.5 | 215.2 | 2960.7 | 302.5 | 13290.6 |
| 2018 | 7137 | 1116 | 42415 | 16.8 | 2.6 | 6.4 | 9485 | 1040 | 9.12 | 3264 | 1072.2 | 1381 | 453.8 | 2867 | 248.9 | 3116 | 341.7 | 13934.4 |
| 2019 | 7487 | 1067 | 43720 | 17.1 | 2.4 | 7.02 | 9873 | 995 | 9.92 | 3451 | 1139.6 | 1463 | 483.2 | 3028.3 | 232 | 3260.3 | 328.7 | 14437.5 |
| 2020 | 7100 | 779 | 42920 | 16.5 | 1.8 | 9.11 | 9600 | 719 | 13.35 | 3280 | 1087.5 | 1560 | 517.2 | 2944.5 | 238.7 | 3183.2 | 238.4 | 14231.4 |
| 2021 | 7956 | 1162 | 48524 | 16.4 | 2.4 | 6.85 | 10538 | 1087 | 9.69 | 3720 | 1235.5 | 1583 | 525.8 | 3254.9 | 244.8 | 3499.6 | 361.1 | 16114.8 |
| 2022 | 8438 | 1541 | 52907 | 15.9 | 2.9 | 5.48 | 11165 | 1442 | 7.74 | 3895 | 1300.9 | 1699 | 567.5 | 3479.1 | 249.8 | 3729 | 481.7 | 17670.8 |
| 2023 | 9098 | 1381 | 55746 | 16.3 | 2.5 | 6.59 | 12013 | 1297 | 9.26 | 4157 | 1400 | 1858 | 625.8 | 3788.8 | 256.8 | 4045.6 | 436.9 | 18772.6 |
| 2024 | 9786 | 1299 | 58301 | 16.8 | 2.2 | 7.53 | 12855 | 1222 | 10.52 | 4429 | 1505.8 | 1967 | 668.9 | 4100.3 | 270.3 | 4370.6 | 415.4 | 19822.5 |
| 2025 | 10442 | 1225 | 61062 | 17.1 | 2 | 8.52 | 13695 | 1141 | 12.01 | 4716 | 1612 | 2105 | 719.6 | 4396.8 | 283.8 | 4680.6 | 389.8 | 20870.2 |
The 2022 spike at the pump did not rewrite the ledger
Gasoline is loud because it is posted on a sign. Health care is quiet until the explanation of benefits arrives. Indexed to 2019, U.S. per capita health-care services spending stood at 139.5 in 2025, up 39.5 percent in six years. Gasoline and other energy goods peaked with 2022 prices — 144.4 on the same index — then eased to 114.8, a 14.8 percent rise from 2019. Total per capita consumption, for comparison, landed at 139.7. The war-year pump spike was real. It was also temporary on these books. The clinic bill kept climbing.
Go back further and the gap is older than this campaign. In 2000, health-care services were already $3,255 per person against $654 of gasoline and other energy goods, a 5-to-1 ratio. The ratio compressed when fuel prices surged in 2008 and 2011–12, then widened again. By 2025 it was 8.5-to-1. None of that says $4.29 gasoline does not hurt a driver in McAllen. It says the average American’s annual health-care services tab would still cover several years of that gasoline line.
Since 2019, the clinic bill rose faster than the pump

View exact chart values
| year | health_index | gas_index | total_index |
|---|---|---|---|
| 2015 | 85.5 | 92.9 | 87.4 |
| 2016 | 89.1 | 82.9 | 89.7 |
| 2017 | 91.8 | 93 | 93.1 |
| 2018 | 95.3 | 104.6 | 97 |
| 2019 | 100 | 100 | 100 |
| 2020 | 94.8 | 73 | 98.2 |
| 2021 | 106.3 | 108.9 | 111 |
| 2022 | 112.7 | 144.4 | 121 |
| 2023 | 121.5 | 129.4 | 127.5 |
| 2024 | 130.7 | 121.7 | 133.4 |
| 2025 | 139.5 | 114.8 | 139.7 |
Texas is not the expensive clinic. It is the cheap one
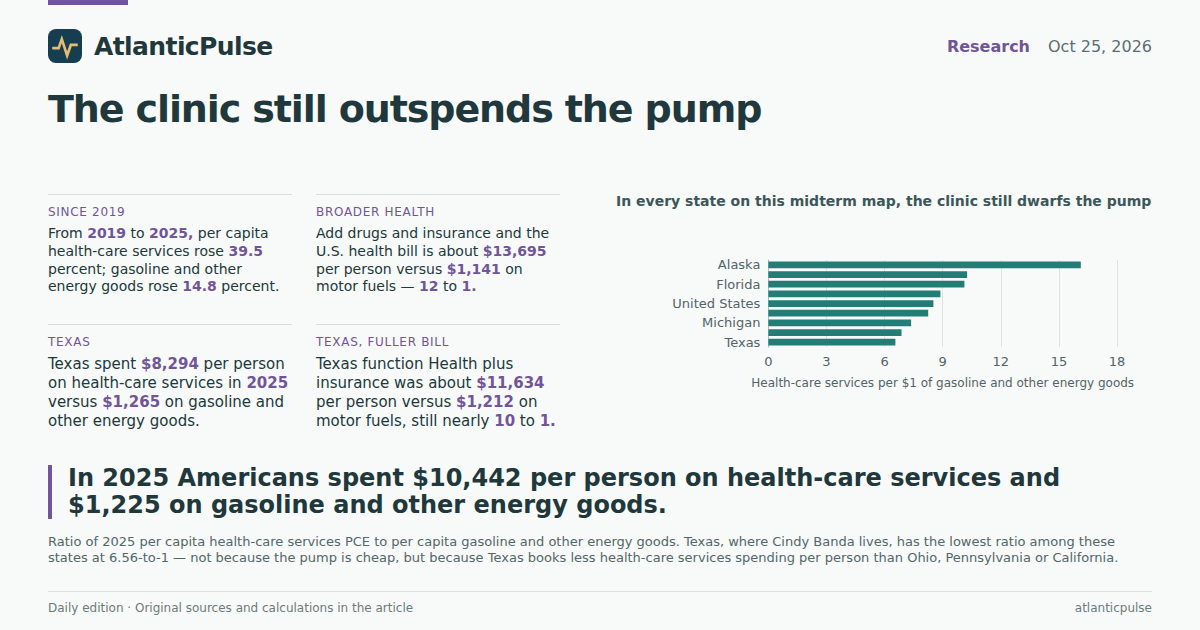
If Banda’s story were just Texas being uniquely medicalized, the state books would show it. They show the opposite. In 2025 Texas spent $8,294 per person on health-care services, the lowest among the midterm states compared here, and $1,265 on gasoline and other energy goods — close to the national $1,225. The ratio is 6.56-to-1, still the clinic, but the lowest multiple on this list. Georgia (6.87) and Michigan (7.37) sit nearby. Ohio (8.88) and Pennsylvania (8.25) spend more on care. Florida’s services bill is $10,574 against only $1,045 at the energy-goods line, a 10-to-1 gap. California is $11,681 versus $1,139.
Alaska, whose Senate certification is in court this week, is the outlier in the other direction: $15,425 per person on health-care services and $956 on gasoline and other energy goods, more than 16-to-1. That is not a claim that Alaskans are sicker, or that Texas is healthier. It is a statement about what got booked. From 2019 to 2025, Texas health-care services spending per person rose 34.5 percent; its gasoline-and-energy-goods line rose 9 percent. Georgia’s health-care services line jumped 47.2 percent. In every one of these states, the clinic still outspent the pump on the last full official year.
Texas is not a high-health outlier. It is a low-clinic one

View exact chart values
| state | health_pc | gas_pc | health_to_gas |
|---|---|---|---|
| Alaska | 15425 | 956 | 16.13 |
| California | 11681 | 1139 | 10.26 |
| Pennsylvania | 10919 | 1323 | 8.25 |
| Ohio | 10900 | 1228 | 8.88 |
| Florida | 10574 | 1045 | 10.12 |
| United States | 10442 | 1225 | 8.52 |
| Michigan | 9725 | 1320 | 7.37 |
| Georgia | 9367 | 1363 | 6.87 |
| Texas | 8294 | 1265 | 6.56 |
In every state on this midterm map, the clinic still dwarfs the pump

View exact chart values
| state | year | health_pc | gas_pc | health_to_gas | health_chg_2019_pct | gas_chg_2019_pct | health_minus_gas |
|---|---|---|---|---|---|---|---|
| Alaska | 2025 | 15425 | 956 | 16.13 | 43.1 | 7.3 | 14469 |
| California | 2025 | 11681 | 1139 | 10.26 | 42.1 | 16.6 | 10542 |
| Florida | 2025 | 10574 | 1045 | 10.12 | 46.5 | 22.7 | 9529 |
| Ohio | 2025 | 10900 | 1228 | 8.88 | 33.6 | 11.3 | 9672 |
| United States | 2025 | 10442 | 1225 | 8.52 | 39.5 | 14.8 | 9217 |
| Pennsylvania | 2025 | 10919 | 1323 | 8.25 | 31.4 | 9.4 | 9596 |
| Michigan | 2025 | 9725 | 1320 | 7.37 | 33.7 | 14.7 | 8405 |
| Georgia | 2025 | 9367 | 1363 | 6.87 | 47.2 | 24 | 8004 |
| Texas | 2025 | 8294 | 1265 | 6.56 | 34.5 | 9 | 7029 |
Add the pills and the premium, and the pump looks smaller still
The services line understates the health bill Banda actually faces. BEA’s broader “Health” function folds in pharmaceuticals and medical equipment; net health insurance sits in a separate insurance category. Add those two and do not double-count. Nationally in 2025, function Health plus net health insurance was about $4.68 trillion, or $13,695 per person. Motor vehicle fuels, lubricants and fluids — the cleaner pump comparison, without heating oil — were $390 billion, or $1,141 per person. That is a 12-to-1 gap. Hospitals alone, $1.61 trillion, were more than four times the motor-fuel line. Prescription drugs, $720 billion, were still nearly double it.
Texas looks the same once the missing pieces are put back. Function Health plus insurance was about $369 billion in 2025, or $11,634 per person; motor vehicle fuels were $38 billion, or $1,212. That is 9.6-to-1, and 20.8 percent of Texas consumption versus 2.2 percent. Banda’s $25,000 in medical debt is a single household’s catastrophe, not an average. The state total says the average Texan was already booking more than $11,000 a year in health-function spending plus insurance before anyone met a $7,500 deductible. The motor-fuel line, even in a driving state, was about a tenth of that.
Add drugs and insurance, and Texas health still outruns motor fuel almost 10-to-1

View exact chart values
| year | health_svc_pc | gas_energy_pc | broad_health_pc | motor_fuels_pc | svc_to_gas | broad_to_fuels | health_fn_bil | ins_bil | broad_bil | motor_fuels_bil | total_pce_bil | broad_share_pct | fuels_share_pct |
|---|---|---|---|---|---|---|---|---|---|---|---|---|---|
| 2015 | 5549 | 1103 | 7514 | 1071 | 5.03 | 7.02 | 190.8 | 15 | 205.8 | 29.3 | 987.5 | 20.8 | 3 |
| 2016 | 5695 | 967 | 7730 | 940 | 5.89 | 8.23 | 198.6 | 16.5 | 215.1 | 26.1 | 1022.7 | 21 | 2.6 |
| 2017 | 5789 | 1065 | 7911 | 1033 | 5.44 | 7.66 | 205.1 | 17.9 | 223 | 29.1 | 1073.2 | 20.8 | 2.7 |
| 2018 | 5896 | 1202 | 8156 | 1164 | 4.91 | 7.01 | 211.9 | 20.6 | 232.5 | 33.2 | 1124.8 | 20.7 | 3 |
| 2019 | 6166 | 1161 | 8460 | 1121 | 5.31 | 7.55 | 225.1 | 19 | 244.1 | 32.4 | 1170.2 | 20.9 | 2.8 |
| 2020 | 5813 | 851 | 8238 | 818 | 6.83 | 10.08 | 221.1 | 19.7 | 240.9 | 23.9 | 1177.6 | 20.5 | 2 |
| 2021 | 6547 | 1248 | 9040 | 1205 | 5.25 | 7.5 | 247.6 | 19.7 | 267.3 | 35.6 | 1348.7 | 19.8 | 2.6 |
| 2022 | 6875 | 1681 | 9514 | 1618 | 4.09 | 5.88 | 265.2 | 21.3 | 286.5 | 48.7 | 1492.2 | 19.2 | 3.3 |
| 2023 | 7375 | 1480 | 10211 | 1428 | 4.98 | 7.15 | 291.1 | 22.6 | 313.7 | 43.9 | 1593.5 | 19.7 | 2.8 |
| 2024 | 7819 | 1368 | 10841 | 1319 | 5.72 | 8.22 | 314.7 | 24.8 | 339.5 | 41.3 | 1679.7 | 20.2 | 2.5 |
| 2025 | 8294 | 1265 | 11634 | 1212 | 6.56 | 9.6 | 341.2 | 27.7 | 368.9 | 38.4 | 1771.8 | 20.8 | 2.2 |
What the books cannot tell you, and what they can
These are annual, current-dollar consumption estimates, not prices at the pump this week and not Cindy Banda’s invoice. Per capita is not a household. Employer-paid premiums sit inside insurance and health spending in ways a patient never sees as a bill. The 2025 PCE year closed before this October’s $4.29 gasoline reading; if the Iran war keeps crude elevated, 2026’s motor-fuel line will be higher. None of that reverses the ranking. Even in 2022, when gasoline and other energy goods hit $1,541 per person nationally, health-care services were $8,438 — still more than five times the pump.
The political temptation is to treat the louder price as the bigger one. Trump’s “freaking fortune” line and Banda’s first Democratic ballot are both about costs. The official ledger says Americans, including Texans, already devote a much larger slice of spending to staying alive than to filling the tank. A midterm that is decided at the pump will still leave the larger bill on the kitchen table.
Sources and methods
Observation period: BEA annual personal consumption expenditures by state, calendar years 2000–2025 for U.S. totals and 2015–2025 for state comparisons. The latest year is 2025, the last published annual PCE year in this snapshot — not a current-day gasoline price and not 2026 year-to-date spending.
Source vintage: BEA SAPCE release bea-sapce-2026-09-30, snapshot created 2026-10-07. Provider lag is normal. Figures are current-dollar consumption, so price and volume changes are mixed.
Health-care services (SAPCE2 line) are outpatient, hospital and nursing-home services only. They exclude pharmaceuticals and net health insurance. “Gasoline and other energy goods” includes motor fuels plus fuel oil and other fuels. Where a cleaner pump comparison is used, the series is motor vehicle fuels, lubricants and fluids.
The broader health total is BEA function Health (care, drugs, equipment) plus net health insurance. Those categories do not overlap. Per-person broader figures divide category millions of dollars by implied population (total PCE in millions of dollars divided by per capita total PCE in dollars). That is not a household average.
State ratios use the same per capita services and energy-goods series. Dictionary presence of a state is not extra coverage; each extract returned 11 annual observations for 2015–2025. Missing values were not treated as zero. No causal claim is made about voting, tariffs or the Iran war.
Research completed 2026-10-26, for the October 25, 2026 news edition. The available source data may cover earlier periods; see the observation periods and source vintages above.