Research
The Canada fight is over industries that already shrank
A fight over factories that already lost a generation of jobs
Prime Minister Mark Carney said Canada had been attacked. U.S. Trade Representative Jamieson Greer said Ottawa walked back a deal that would have cut tariffs on steel, aluminum, autos and lumber. The 50 percent U.S. duties that landed at midnight Saturday cover about $20 billion of Canadian goods, a slice Carney vowed to match dollar for dollar. The argument is about factories. The factories, on the American side, are not what they were.
The Bureau of Labor Statistics still counts those industries, month by month. Add the four sectors Canada was bargaining over to the five it has now flagged for retaliation and you get about 3.35 million seasonally adjusted U.S. jobs as of June or July 2026, depending on the series. That is a real payroll. It is also a smaller one than the same list supported in January 2000. The four 'talks' industries alone — motor vehicles and parts, iron and steel mills, alumina and other nonferrous metals, and wood products — employed about 2.29 million people then. They employ about 1.56 million now.
That is not a forecast of what the new tariffs will do. The latest payroll readings predate Saturday's duties. It is a map of the battlefield Carney and Greer are arguing over: U.S. plants that have already spent a quarter-century getting leaner, in an economy thirteen times the size of Canada's.
U.S. payrolls in the industries named in the Canada fight

View exact chart values
| industry | jobs_thousands | as_of | role |
|---|---|---|---|
| Household appliances | 56.5 | 2026-06 | Retaliation: appliances |
| Iron and steel mills | 84.8 | 2026-06 | Talks: steel |
| Alumina and other nonferrous | 121.3 | 2026-06 | Talks: aluminum |
| Dairy products | 171 | 2026-06 | Retaliation: dairy |
| Ag, construction, mining machinery | 201.8 | 2026-06 | Retaliation: farm equipment |
| Paper | 357.5 | 2026-07 | Retaliation: pulp and paper |
| Wood products | 393 | 2026-07 | Talks: lumber |
| Motor vehicles and parts | 964.5 | 2026-07 | Talks: autos |
| Computer and electronic products | 998 | 2026-07 | Retaliation: electronics |
Autos and electronics still dwarf steel
If you picture the Canada fight as a steel drama, the payrolls will surprise you. Iron and steel mills employed 84,800 people in June 2026. Alumina, aluminum and other nonferrous processing employed 121,300. Household appliance plants, a retaliation target, employed 56,500. Those are not rounding errors, but they are not the bulk of the list.
Motor vehicles and parts employed 964,500 in July. Computer and electronic product manufacturing employed 998,000. Wood products, the lumber file, employed 393,000. Paper manufacturing employed 357,500. Agriculture, construction and mining machinery — the closest official stand-in for the 'farm equipment' Canada named — employed 201,800. Dairy product manufacturing, the one industry on the list that has grown, employed 171,000.
Two caveats belong next to those numbers. First, a payroll is not a trade flow. The catalogue does not contain bilateral U.S.–Canada shipments, so these figures cannot say how much of an auto plant's output crosses the Detroit River or how much Canadian lumber a U.S. mill competes with. Second, several series are broader than the talking points. 'Aluminum' here includes other nonferrous metals. 'Machinery' includes construction and mining equipment, not just tractors. 'Electronics' is the whole computer-and-electronic-product sector, not a carton of toasters. The point of the chart is scale, not a customs schedule.
The long shrink in autos, lumber, paper and electronics

View exact chart values
| year | autos | steel | wood | electronics | paper | partial_year |
|---|---|---|---|---|---|---|
| 2000 | 1313.4 | 135 | 615.5 | 1820 | 604.8 | 0 |
| 2001 | 1212.9 | 121.5 | 576.4 | 1748.8 | 577.7 | 0 |
| 2002 | 1151.2 | 107.2 | 557.1 | 1507.4 | 546.6 | 0 |
| 2003 | 1125.3 | 102.3 | 539.4 | 1355.2 | 516.3 | 0 |
| 2004 | 1112.7 | 95.4 | 551.8 | 1322.5 | 495.5 | 0 |
| 2005 | 1096.6 | 95.8 | 561.2 | 1314.7 | 484.2 | 0 |
| 2006 | 1069.9 | 96.6 | 560.7 | 1303.6 | 470.5 | 0 |
| 2007 | 994.2 | 100.2 | 517 | 1266 | 458.1 | 0 |
| 2008 | 875.5 | 99.1 | 457.8 | 1235 | 444.9 | 0 |
| 2009 | 664.2 | 85.4 | 360.4 | 1125 | 406.9 | 0 |
| 2010 | 678.3 | 86.5 | 341.9 | 1080.1 | 394.5 | 0 |
| 2011 | 717.9 | 92.2 | 336.8 | 1086.4 | 387.2 | 0 |
| 2012 | 777.3 | 92.6 | 339.1 | 1069.5 | 380 | 0 |
| 2013 | 824.9 | 90.8 | 353.2 | 1043.5 | 378 | 0 |
| 2014 | 872 | 90.9 | 371.7 | 1024.1 | 373.5 | 0 |
| 2015 | 913.6 | 88.4 | 382.5 | 1025.7 | 372.6 | 0 |
| 2016 | 944.2 | 82.6 | 392.6 | 1018.5 | 370.6 | 0 |
| 2017 | 963.4 | 81.9 | 397.3 | 1006.9 | 366.1 | 0 |
| 2018 | 998.4 | 83.6 | 406 | 1019.2 | 365.4 | 0 |
| 2019 | 993.4 | 87.2 | 408.9 | 1037.8 | 365.2 | 0 |
| 2020 | 887.3 | 81.7 | 396 | 1022.8 | 354.7 | 0 |
| 2021 | 959.8 | 79.5 | 409.9 | 1017.2 | 349.7 | 0 |
| 2022 | 1005.5 | 82.4 | 427.4 | 1044.8 | 363 | 0 |
| 2023 | 1024.7 | 84.9 | 418.8 | 1053.5 | 358.5 | 0 |
| 2024 | 1010.2 | 85.1 | 414.8 | 1026.1 | 354.4 | 0 |
| 2025 | 967.4 | 84.8 | 403.9 | 997.7 | 355 | 0 |
| 2026 | 957.2 | 84.7 | 392.7 | 992.2 | 356.5 | 1 |
The 2000s did more damage than the last 18 months
Plot the annual averages and the story is a long decline, not a 2026 cliff. Electronics payrolls averaged about 1.82 million in 2000 and about 998,000 in July 2026, a 44 percent drop from January 2000. Paper is down 41 percent. Steel mills and the aluminum-and-nonferrous group are each down about 38 percent. Wood products are down 37 percent. Autos are down 27 percent. Household appliances have lost nearly half their 2000 jobs.
Dairy is the exception. Product manufacturing there is up 26 percent since January 2000, to 171,000 jobs. If Canada puts tariffs on American cheese, it is aiming at a sector that has been hiring, not one that has been hollowing out. That does not make dairy 'safe.' It does mean the retaliation list is not a set of identical patients.
Since January 2025 — the window that covers the second Trump term up to the latest payroll month — the moves have been smaller. Wood products are down 3.9 percent. Appliances are down 2.9 percent. Autos and electronics are each down about 1 percent. Steel, paper and the aluminum group are slightly up. Dairy is up 2.7 percent. Those are descriptive changes. They are not an estimate of Saturday's tariffs, which had not yet taken effect when these jobs were counted. Anyone who tells you the new duties have already shown up in the employment report is reading a calendar that has not happened.
January 2000 versus now: dairy is the outlier

View exact chart values
| industry | jobs_2000_thousands | jobs_now_thousands | change_pct | role |
|---|---|---|---|---|
| Motor vehicles and parts | 1328.1 | 964.5 | -27.4 | Talks: autos |
| Iron and steel mills | 137.7 | 84.8 | -38.4 | Talks: steel |
| Alumina and other nonferrous | 196.9 | 121.3 | -38.4 | Talks: aluminum |
| Wood products | 625.1 | 393 | -37.1 | Talks: lumber |
| Dairy products | 135.6 | 171 | 26.1 | Retaliation: dairy |
| Paper | 608.8 | 357.5 | -41.3 | Retaliation: pulp and paper |
| Household appliances | 109 | 56.5 | -48.2 | Retaliation: appliances |
| Ag, construction, mining machinery | 221.4 | 201.8 | -8.9 | Retaliation: farm equipment |
| Computer and electronic products | 1782.5 | 998 | -44 | Retaliation: electronics |
Since January 2025, lumber and appliances have slipped; dairy has not

View exact chart values
| industry | pct_change | jobs_thousands |
|---|---|---|
| Wood products | -3.9 | 393 |
| Household appliances | -2.9 | 56.5 |
| Motor vehicles and parts | -1.1 | 964.5 |
| Computer and electronic products | -1 | 998 |
| Ag, construction, mining machinery | -0.5 | 201.8 |
| Iron and steel mills | 1 | 84.8 |
| Paper | 1 | 357.5 |
| Alumina and other nonferrous | 1.4 | 121.3 |
| Dairy products | 2.7 | 171 |
Carney called it a war. The IMF still calls Canada 8 percent of America.
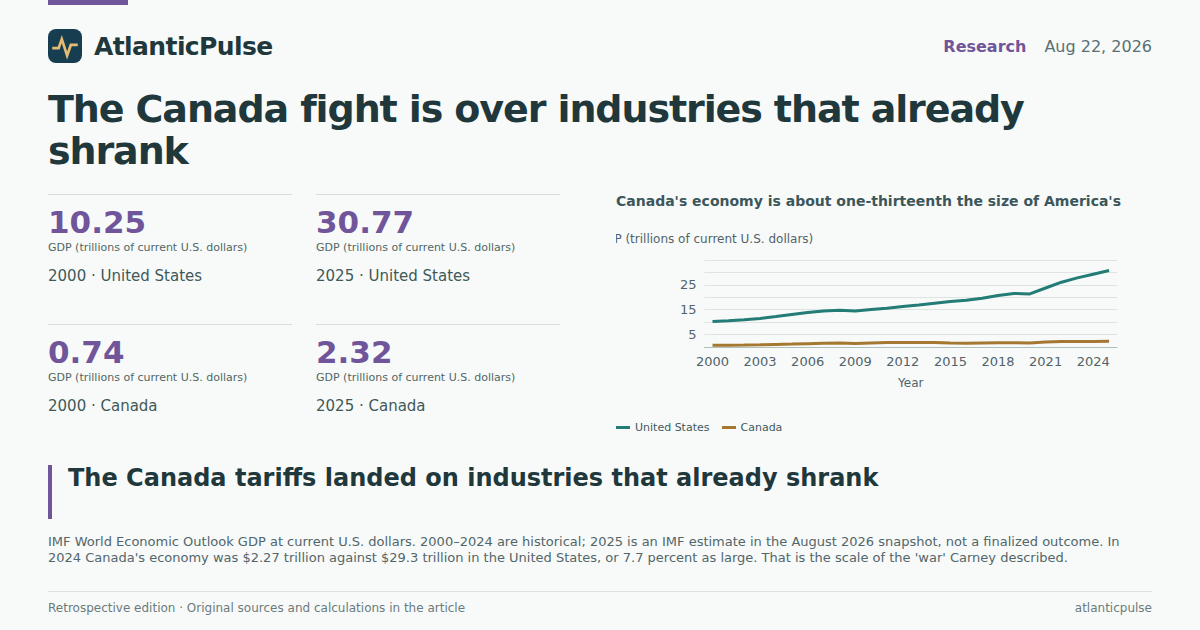
The other half of the question is how mismatched the two economies are. The IMF World Economic Outlook puts 2024 GDP at $29.3 trillion for the United States and $2.27 trillion for Canada, in current dollars. Canada was 7.7 percent as large. An IMF estimate for 2025, which should not be read as a closed book, is in the same neighborhood: $30.8 trillion against $2.32 trillion, or 7.5 percent. At the 2011 peak of the commodity boom, Canada reached 11.5 percent of U.S. GDP. It has not been back.
The current-account picture is lopsided in a different way. In 2024 the United States ran a current-account deficit of 4.05 percent of GDP. Canada ran a deficit of 0.48 percent of GDP — a gap, not a mirror. Canada's goods-export volumes grew 0.34 percent that year; America's grew 2.04 percent. An IMF estimate for 2025 has Canadian goods-export volumes falling 2.02 percent. That estimate is not a measurement of the August tariffs. It is a reminder that Canada's export machine was already the more fragile of the two before Carney recalled his negotiators.
None of this settles who 'won' the midnight breakdown. It does settle the proportions. The United States is putting 50 percent duties on a slice of Canadian goods in industries whose American payrolls have, with the exception of dairy, been shrinking for decades. Canada is promising to hit back at a country whose economy is more than twelve times larger, and whose trade gap with the world is already wide. The factories on both sides of the border will feel it. The official U.S. job count says many of those factories have been feeling something else, quietly, for a long time.
Canada's economy is about one-thirteenth the size of America's

View exact chart values
| year | usa_gdp_trillion | canada_gdp_trillion | canada_share_pct | status |
|---|---|---|---|---|
| 2000 | 10.25 | 0.74 | 7.3 | historical |
| 2001 | 10.58 | 0.74 | 7 | historical |
| 2002 | 10.93 | 0.76 | 7 | historical |
| 2003 | 11.46 | 0.9 | 7.8 | historical |
| 2004 | 12.22 | 1.03 | 8.4 | historical |
| 2005 | 13.04 | 1.17 | 9 | historical |
| 2006 | 13.82 | 1.32 | 9.5 | historical |
| 2007 | 14.47 | 1.47 | 10.1 | historical |
| 2008 | 14.77 | 1.55 | 10.5 | historical |
| 2009 | 14.48 | 1.38 | 9.5 | historical |
| 2010 | 15.05 | 1.62 | 10.7 | historical |
| 2011 | 15.6 | 1.79 | 11.5 | historical |
| 2012 | 16.25 | 1.83 | 11.2 | historical |
| 2013 | 16.88 | 1.85 | 10.9 | historical |
| 2014 | 17.61 | 1.81 | 10.3 | historical |
| 2015 | 18.3 | 1.56 | 8.5 | historical |
| 2016 | 18.8 | 1.53 | 8.1 | historical |
| 2017 | 19.61 | 1.65 | 8.4 | historical |
| 2018 | 20.66 | 1.73 | 8.4 | historical |
| 2019 | 21.54 | 1.74 | 8.1 | historical |
| 2020 | 21.38 | 1.66 | 7.7 | historical |
| 2021 | 23.73 | 2.02 | 8.5 | historical |
| 2022 | 26.05 | 2.2 | 8.4 | historical |
| 2023 | 27.81 | 2.2 | 7.9 | historical |
| 2024 | 29.3 | 2.27 | 7.7 | historical |
| 2025 | 30.77 | 2.32 | 7.5 | estimate |
Sources and methods
This is retrospective enrichment using pinned catalogue snapshots, not a reconstruction of what was knowable on the edition date of 22 August 2026. Research was compiled on 11 September 2026 from stored extracts.
U.S. payrolls are seasonally adjusted all-employee counts from the Bureau of Labor Statistics Current Employment Statistics national series, snapshot bls-ce-snapshot-2026-08-24 (normalized run 2026-08-24T10-07-20Z). Coverage requested was January 2000 through July 2026. Autos, wood products, paper and electronics run through July 2026 (319 monthly observations). Steel mills, alumina and other nonferrous, dairy, household appliances, and agriculture-construction-mining machinery run through June 2026 (318 observations). Missing values were skipped and not treated as zero. The first observation of each period was kept if duplicates appeared; none of the used series showed conflicting duplicate values in the extracts.
CES units are thousands of employees. Job counts in the prose multiply those thousands by 1,000 and round. Percent changes compare the latest month with January 2000, January 2020 or January 2025. Annual history lines are simple averages of available months in each calendar year; 2026 is a partial year (six or seven months) and is labeled as such.
Industry series are official NAICS payrolls, not customs categories. 'Alumina, aluminum, and other nonferrous metal production and processing' is broader than aluminum smelting. 'Agriculture, construction, and mining machinery manufacturing' is broader than farm equipment. 'Computer and electronic product manufacturing' is broader than consumer electronics. These series cannot be added to a total-manufacturing figure here because a national manufacturing total was not extracted. They also cannot be read as U.S.–Canada trade volumes: bilateral goods trade is not in the indexed catalogue.
GDP, current-account balances and related IMF series come from the World Economic Outlook snapshot 20260824T140954Z (raw run 20260810). Values for 2000–2024 are treated as historical WEO observations. 2025 is treated as an IMF estimate, not a finalized outcome. GDP is in current U.S. dollars. Canada's share of U.S. GDP is a ratio of those current-dollar totals, not a purchasing-power-parity comparison. Current-account figures are percent of GDP, not bilateral balances with one another.
No causal effect of the August 2026 tariffs is estimated. Payrolls predate those duties. Descriptive comparisons are not treatment effects.
Research completed 2026-09-11, for the August 22, 2026 news edition. This is retrospective analysis, not a reconstruction of information available that day.