Research
The books still said growth. The surveys said otherwise.
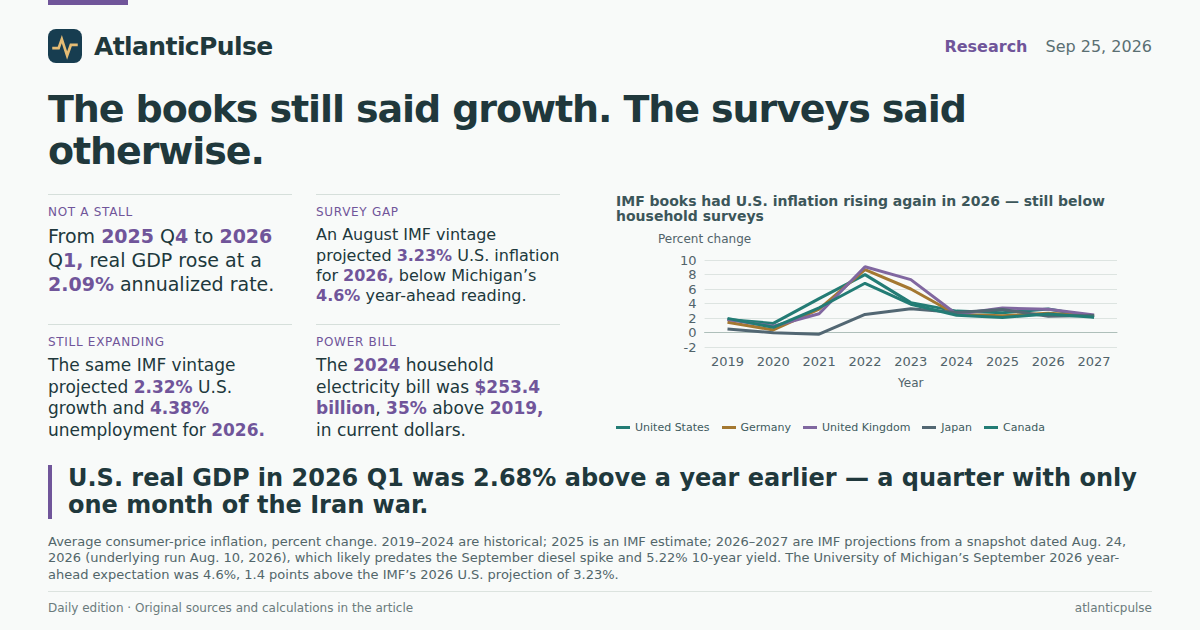
The survey is screaming. The output ledger is not.
On Friday the University of Michigan’s final September reading put consumer sentiment at 48.1, a four-month low, with year-ahead inflation expectations at 4.6 percent. Markets, after a 19-year high of 5.22 percent on the 10-year Treasury, priced a 71 percent chance of a quarter-point Federal Reserve hike on 27–28 October. Diesel averaged $6.52 a gallon. That is a household story about prices, not a GDP story about collapse — and the distinction matters, because the last complete official output quarter still looks like an expansion.
The Bureau of Economic Analysis’s June 25, 2026, state GDP release puts inflation-adjusted U.S. output at $24.18 trillion in 2026 Q1, chained 2017 dollars, seasonally adjusted at an annual rate. That is 2.68 percent above 2025 Q1 and 2.09 percent at an annualized rate from 2025 Q4. Those are not boom numbers. They are also not a recession. Year-over-year growth had dipped to 1.99 percent in 2025 Q4, then firmed. The Iran war began on February 28, 2026, so 2026 Q1 contains only March as a wartime month. Anyone using this print as a verdict on six months of Hormuz politics is asking a quarterly ledger to do a job it has not been given.
U.S. real GDP was still expanding in early 2026

View exact chart values
| quarter | year | q | gdp_chained2017_billions | yoy_pct | qoq_annualized_pct |
|---|---|---|---|---|---|
| 2019 Q1 | 2019 | Q1 | 20431.6 | — | — |
| 2019 Q2 | 2019 | Q2 | 20602.3 | — | 3.38 |
| 2019 Q3 | 2019 | Q3 | 20843.3 | — | 4.76 |
| 2019 Q4 | 2019 | Q4 | 20985.4 | — | 2.76 |
| 2020 Q1 | 2020 | Q1 | 20709.2 | 1.36 | -5.16 |
| 2020 Q2 | 2020 | Q2 | 19078 | -7.4 | -27.98 |
| 2020 Q3 | 2020 | Q3 | 20558.9 | -1.36 | 34.86 |
| 2020 Q4 | 2020 | Q4 | 20791.9 | -0.92 | 4.61 |
| 2021 Q1 | 2021 | Q1 | 21082.1 | 1.8 | 5.7 |
| 2021 Q2 | 2021 | Q2 | 21440.9 | 12.39 | 6.98 |
| 2021 Q3 | 2021 | Q3 | 21617.8 | 5.15 | 3.34 |
| 2021 Q4 | 2021 | Q4 | 21988.7 | 5.76 | 7.04 |
| 2022 Q1 | 2022 | Q1 | 21932.7 | 4.03 | -1.02 |
| 2022 Q2 | 2022 | Q2 | 21967 | 2.45 | 0.63 |
| 2022 Q3 | 2022 | Q3 | 22125.6 | 2.35 | 2.92 |
| 2022 Q4 | 2022 | Q4 | 22278.3 | 1.32 | 2.79 |
| 2023 Q1 | 2023 | Q1 | 22439.6 | 2.31 | 2.93 |
| 2023 Q2 | 2023 | Q2 | 22580.5 | 2.79 | 2.54 |
| 2023 Q3 | 2023 | Q3 | 22841 | 3.23 | 4.69 |
| 2023 Q4 | 2023 | Q4 | 23033.8 | 3.39 | 3.42 |
| 2024 Q1 | 2024 | Q1 | 23082.1 | 2.86 | 0.84 |
| 2024 Q2 | 2024 | Q2 | 23286.5 | 3.13 | 3.59 |
| 2024 Q3 | 2024 | Q3 | 23478.6 | 2.79 | 3.34 |
| 2024 Q4 | 2024 | Q4 | 23586.5 | 2.4 | 1.85 |
| 2025 Q1 | 2025 | Q1 | 23548.2 | 2.02 | -0.65 |
| 2025 Q2 | 2025 | Q2 | 23771 | 2.08 | 3.84 |
| 2025 Q3 | 2025 | Q3 | 24026.8 | 2.34 | 4.38 |
| 2025 Q4 | 2025 | Q4 | 24055.7 | 1.99 | 0.48 |
| 2026 Q1 | 2026 | Q1 | 24180.4 | 2.68 | 2.09 |
The large states did not sneak into contraction either
The same BEA table, sliced by state, does not offer a hidden slump in the places that dominate national output. Among the six large states checked here, every one was still larger in real terms in 2026 Q1 than a year earlier. Florida’s 2.39 percent was the slowest of the group. California’s 3.32 percent was the fastest, with Texas at 3.27 percent. New York, Ohio and Pennsylvania sat between 2.5 and 3.0 percent. The United States as a whole, on this measure, was 2.68 percent.
That is not a claim that every county felt fine, or that diesel at harvest time is a rounding error in Ohio. It is a claim about the official real-output print: as of a release dated June 25, 2026, the big state economies had not rolled over. If September’s bond-market tantrum and the 4.6 percent inflation expectation are leading indicators, they are leading a quarter the books have not published yet.
Large states were still growing in 2026 Q1, before the war had a full quarter

View exact chart values
| state | q1_2025_billions | q1_2026_billions | yoy_pct |
|---|---|---|---|
| Florida | 1378.4 | 1411.4 | 2.39 |
| New York | 1869 | 1916.5 | 2.54 |
| United States | 23548.2 | 24180.4 | 2.68 |
| Ohio | 724.4 | 744.4 | 2.76 |
| Pennsylvania | 806.8 | 830.9 | 2.99 |
| Texas | 2235.9 | 2309.1 | 3.27 |
| California | 3341.9 | 3452.8 | 3.32 |
Households are forecasting more inflation than the IMF wrote down
The International Monetary Fund’s World Economic Outlook vintage in this catalogue — snapshot created August 24, 2026, from a run dated August 10 — put U.S. average consumer-price inflation at 2.95 percent in 2024, an estimated 2.73 percent in 2025, and a projected 3.23 percent in 2026. That 2026 figure is 1.37 percentage points below the Michigan year-ahead reading. The IMF then has inflation easing to 2.14 percent in 2027. Those later years are projections, not observations, and the vintage almost certainly does not digest September’s diesel print or a 5.22 percent 10-year yield.
Among large peers in the same vintage, the United States is not an outlier on the way up. The IMF’s 2026 projections cluster: Germany 2.65 percent, Canada 2.54, Japan 2.24, the United Kingdom 3.20. The 2022 spike is still the mountain on the chart — 7.99 percent in the United States, 9.07 in the United Kingdom, 8.67 in Germany. What households are doing in 2026 is refusing to treat the descent as finished. A 4.6 percent survey reading against a 3.2 percent staff projection is not a rounding difference. It is the gap between a model that had not yet seen $6.52 diesel and a family that has.
IMF books had U.S. inflation rising again in 2026 — still below household surveys

View exact chart values
| year | United_States | Germany | United_Kingdom | Japan | Canada | vintage |
|---|---|---|---|---|---|---|
| 2019 | 1.81 | 1.4 | 1.79 | 0.47 | 1.95 | historical |
| 2020 | 1.25 | 0.36 | 0.85 | -0.03 | 0.72 | historical |
| 2021 | 4.68 | 3.22 | 2.59 | -0.24 | 3.4 | historical |
| 2022 | 7.99 | 8.67 | 9.07 | 2.5 | 6.78 | historical |
| 2023 | 4.13 | 6 | 7.3 | 3.27 | 3.9 | historical |
| 2024 | 2.95 | 2.48 | 2.53 | 2.74 | 2.38 | historical |
| 2025 | 2.73 | 2.3 | 3.37 | 3.17 | 2.08 | IMF estimate |
| 2026 | 3.23 | 2.65 | 3.2 | 2.24 | 2.54 | IMF projection |
| 2027 | 2.14 | 2.3 | 2.42 | 2.34 | 2.09 | IMF projection |
Growth on the IMF’s page, with unemployment only a little higher
The same IMF vintage does not describe an economy that has already stalled. It estimates 2025 U.S. real growth at 2.12 percent and projects 2.32 percent for 2026 and 2.10 percent for 2027. Unemployment is estimated at 4.28 percent in 2025 and projected at 4.38 percent in 2026 — higher than the 3.6 percent trough of 2022–23, not a labor-market break. Pair that with BEA’s 2.68 percent year-over-year real GDP in 2026 Q1 and you get a consistent official story: slower than the post-pandemic rebound, still positive, not yet the crash implied by a 48.1 sentiment index.
Treat the 2026–27 IMF cells as what they are. A World Economic Outlook file snapshotted in August cannot know how a seven-day Hormuz proposal, a threatened diesel-export ban, or an October FOMC meeting will land. If the Fed does hike into that mix, it will be hiking into an inflation rate households already put above the Fund’s projection, not into a GDP print that has gone negative. The output gap, on these books, is not the emergency. The price of diesel, and the rate needed to borrow against a house, might be.
The IMF still had the U.S. growing, with unemployment only a little higher

View exact chart values
| year | inflation_pct | gdp_growth_pct | unemployment_pct | vintage |
|---|---|---|---|---|
| 2015 | 0.12 | 2.95 | 5.28 | historical |
| 2016 | 1.27 | 1.82 | 4.88 | historical |
| 2017 | 2.13 | 2.46 | 4.36 | historical |
| 2018 | 2.44 | 2.97 | 3.89 | historical |
| 2019 | 1.81 | 2.58 | 3.67 | historical |
| 2020 | 1.25 | -2.08 | 8.1 | historical |
| 2021 | 4.68 | 6.15 | 5.35 | historical |
| 2022 | 7.99 | 2.52 | 3.65 | historical |
| 2023 | 4.13 | 2.93 | 3.62 | historical |
| 2024 | 2.95 | 2.79 | 4.03 | historical |
| 2025 | 2.73 | 2.12 | 4.28 | IMF estimate |
| 2026 | 3.23 | 2.32 | 4.38 | IMF projection |
| 2027 | 2.14 | 2.1 | 4.25 | IMF projection |
The power bill was already a 2024 problem
One reason surveys can sour while GDP holds up is that households do not consume GDP. They consume electricity, groceries and miles. The Energy Department’s $2 billion grid package is sold as a way to squeeze 23 gigawatts from existing lines and, officials said, lower bills. The last complete annual household electricity number on the BEA’s state PCE accounts is 2024: $253.4 billion, up 35.3 percent from $187.3 billion in 2019, in current dollars, not adjusted for inflation or kilowatt-hours. That is the bill that was already fatter before this year’s AI-driven data-center fight and before this week’s grant announcement.
Per-capita personal consumption, also in current dollars, rose from $43,720 in 2019 to $58,499 in 2024. That is a spending boom and an inflation story at once; the series does not split the two. Electric-power generation, transmission and distribution payrolls, seasonally adjusted, went from 392,500 jobs in January 2015 to 429,500 in June 2026 — a slow climb, not a crash, and not a measure of whether 23 gigawatts will show up as lower rates. The point is narrower. By the time sentiment collapsed in September 2026, households had already lived through a one-third jump in the electricity line of the accounts. The official growth rate can be 2.7 percent and the mood can still be 48.1. Those are not the same thermometer.
The household electricity bill had already jumped a third before this year’s grid grants

View exact chart values
| year | electricity_billions |
|---|---|
| 2015 | 177.6 |
| 2016 | 177 |
| 2017 | 177.7 |
| 2018 | 190.7 |
| 2019 | 187.3 |
| 2020 | 191.6 |
| 2021 | 200.7 |
| 2022 | 232.9 |
| 2023 | 236.7 |
| 2024 | 253.4 |
Sources and methods
BEA quarterly real GDP is the SQGDP1 all-areas series in chained 2017 dollars, seasonally adjusted at an annual rate, from the June 25, 2026, regional release. National totals and the six named states use the same series; year-over-year comparisons pair 2026 Q1 with 2025 Q1. Quarter-to-quarter annualized rates compound the one-quarter ratio over four quarters. Missing is not treated as zero.
IMF series are annual World Economic Outlook cells from a catalogue snapshot created August 24, 2026 (raw run August 10, 2026). Calendar years 2019–2024 are treated as historical; 2025 as an IMF estimate; 2026–2027 as projections. Those later years are not current-day observations and predate September 2026 diesel and Treasury-yield prints.
Household electricity is BEA state PCE function-level spending on electricity, millions of current dollars, United States, 2015–2024. Per-capita PCE is the SAPCE2 all-items series in current dollars. Neither is inflation-adjusted. Electric-power jobs are BLS CES seasonally adjusted employment in electric power generation, transmission and distribution, thousands, January 2015 through June 2026.
The 4.6 percent Michigan inflation expectation, 48.1 sentiment index, 71 percent October hike odds, 5.22 percent 10-year yield and $6.52 diesel average are from the edition’s news reporting, not from these extracts. No causal effect is inferred from the descriptive comparisons.
Research completed 2026-09-26, for the September 25, 2026 news edition. The available source data may cover earlier periods; see the observation periods and source vintages above.