Research
The blockade is squeezing an economy that was already small
A squeeze aimed at a much smaller book
Energy Secretary Chris Wright did not bother to dress it up. Asked on Sunday whether a nuclear deal with Iran might still appear, he said there might not be one at all — “it may be simply destroying their capabilities” — and that the U.S. blockade of Iranian ports would “either change their regime or it’ll change their regime’s policies.” That was the same weekend U.S. forces disabled two Iranian oil tankers and destroyed a third, Hormuz traffic slumped to a May low, and American diesel set a record $5.85 a gallon. Wright also talked up wartime oil flowing through the strait. The political claim is that economic asphyxiation is working. The measurement question is cruder: how large is the economy being asphyxiated, and how much of the pain was already on the books?
The pinned IMF World Economic Outlook snapshot used here was built on 24 August 2026, from a database ingested earlier that month. It is not a reconstruction of what officials knew on 6 September, and it cannot see this weekend’s tanker video. It can tell you what the Fund’s annual vintage already said about size, inflation, the current account, and oil. Those series mix history through 2024, a 2025 estimate, and projections from 2026 onward. The projections are guesses drawn before the latest maritime escalation. They are useful as a baseline, not as a scorecard for Saturday’s strikes.
Eighty-three United States for every Iran
Start with the simplest comparison, because the war rhetoric does not. In the WEO’s 2025 estimate, Iran’s GDP at current U.S. dollars is about $371 billion. The United States is about $30.8 trillion. That is not a close contest. It is roughly eighty-three American economies for every Iranian one, or the other way around: Iran is about 1.2 percent of U.S. output in this vintage. Per person the gap is still a chasm, if a smaller one: about $4,260 in Iran versus about $90,000 in the United States, a ratio near twenty-one to one. Nominal dollars fold in inflation and the exchange rate, so they are a poor measure of tanks and factories. They are an excellent measure of what a blockade is trying to starve — hard-currency income.
Among the neighbours who actually ship oil through Hormuz, Iran is no longer the large economy. The same 2025 estimate puts Saudi Arabia at about $1.28 trillion, more than three times Iran; the United Arab Emirates at about $572 billion; Iraq, even after years of war and politics, at about $264 billion. Wright’s claim that Washington can escalate oil transiting the Strait of Hormuz while choking Iran is, in this arithmetic, a claim about squeezing the smaller book while escorting the larger ones. It does not prove the squeeze will change a regime. It does show that the target is not a peer.
Even among Gulf neighbours, Iran is no longer the large economy

View exact chart values
| economy | gdp_usd_bn |
|---|---|
| Iraq | 264.2 |
| Iran | 371.2 |
| United Arab Emirates | 571.6 |
| Saudi Arabia | 1276.9 |
Iran’s dollar GDP peaked in 2011 — then sanctions, then the war estimate

View exact chart values
| year | gdp_hist_bn | gdp_proj_bn |
|---|---|---|
| 2000 | 447.8 | — |
| 2001 | 403.9 | — |
| 2002 | 161.9 | — |
| 2003 | 193.3 | — |
| 2004 | 230.6 | — |
| 2005 | 276.4 | — |
| 2006 | 326.4 | — |
| 2007 | 430.5 | — |
| 2008 | 498.7 | — |
| 2009 | 509.1 | — |
| 2010 | 598.6 | — |
| 2011 | 722.1 | — |
| 2012 | 487.1 | — |
| 2013 | 494.5 | — |
| 2014 | 532.1 | — |
| 2015 | 471.4 | — |
| 2016 | 477.6 | — |
| 2017 | 507.8 | — |
| 2018 | 343.7 | — |
| 2019 | 252.1 | — |
| 2020 | 209.5 | — |
| 2021 | 307.3 | — |
| 2022 | 403.3 | — |
| 2023 | 421.5 | — |
| 2024 | 416.7 | — |
| 2025 | 371.2 | 371.2 |
| 2026 | — | 300.3 |
| 2027 | — | 313.3 |
| 2028 | — | 323.1 |
| 2029 | — | 335.5 |
| 2030 | — | 349.5 |
| 2031 | — | 364 |
The dollar GDP peaked fourteen years ago
Iran’s dollar GDP in this vintage does not look like a country that was humming until February 2026. It peaked in 2011 at about $722 billion, then dropped to about $487 billion in 2012 as sanctions bit, recovered some ground, and collapsed again after 2018: $344 billion that year, $252 billion in 2019, $210 billion in 2020. A rebound to about $422 billion in 2023 still left the 2025 estimate, $371 billion, at roughly half the 2011 peak. Real growth, which strips out some of the price noise, was negative in 2012, 2013, 2015, 2018, 2019, and in the 2025 estimate (-1.5 percent). The WEO’s 2026 projection is another contraction, about -6.1 percent, taking dollar GDP to about $300 billion. Treat that last figure as a pre-tanker first pass. Even without it, the story is not of a booming petrostate waiting to be cracked. It is of an economy that had already been made small in dollars.
That is the point of a blockade, and also its limit. A country that has already learned to live with a shrunken hard-currency GDP can be made more miserable. Misery is not the same as leverage. Tehran’s elected government has said it wants a negotiated end; Wright is describing something closer to siege. The WEO cannot tell you which faction wins. It can tell you the siege is aimed at an income base that, in dollars, is already down by half from its recorded peak.
Inflation did the other half of the work
If dollar GDP is the external squeeze, inflation is the domestic one, and it was not waiting for Labor Day gasoline. Iran’s average consumer-price inflation in this vintage is 32.5 percent in 2024 and 50.9 percent in the 2025 estimate. The United States, in the same files, is 3.0 percent and 2.7 percent. Iran had already printed 40 percent-plus in 2021, 2022, and 2023. The 2025 estimate is the highest in the 2000–2025 window of this extract. The 2026 projection, again a guess, is 68.9 percent in Iran versus 3.2 percent in the United States. American drivers paying $4.14 for regular and a record $5.85 for diesel are in a different argument from Iranian households living through a 50 percent CPI year.
Wright’s Sunday line that the blockade will change the regime or its policies assumes the pain is new enough, or sharp enough, to move politics. The inflation series says the pain is old. It does not say Iranians are indifferent. A 51 percent year on top of several 40 percent years is how you grind down real wages without a single extra tanker. It also helps explain why dollar GDP can fall while some real activity limps on: the rial’s collapse does a lot of the arithmetic.
Iran’s inflation was already in a different universe from America’s

View exact chart values
| year | iran_hist | usa_hist | iran_proj | usa_proj |
|---|---|---|---|---|
| 2000 | 12.3 | 3.4 | — | — |
| 2001 | 11.5 | 2.8 | — | — |
| 2002 | 15.8 | 1.6 | — | — |
| 2003 | 15.6 | 2.3 | — | — |
| 2004 | 15.3 | 2.7 | — | — |
| 2005 | 10.3 | 3.4 | — | — |
| 2006 | 12 | 3.2 | — | — |
| 2007 | 18.4 | 2.9 | — | — |
| 2008 | 25.3 | 3.8 | — | — |
| 2009 | 10.8 | -0.3 | — | — |
| 2010 | 12.3 | 1.6 | — | — |
| 2011 | 25.3 | 3.1 | — | — |
| 2012 | 29.3 | 2.1 | — | — |
| 2013 | 32.9 | 1.5 | — | — |
| 2014 | 14.5 | 1.6 | — | — |
| 2015 | 11.1 | 0.1 | — | — |
| 2016 | 6.8 | 1.3 | — | — |
| 2017 | 8.2 | 2.1 | — | — |
| 2018 | 26.9 | 2.4 | — | — |
| 2019 | 34.8 | 1.8 | — | — |
| 2020 | 36.5 | 1.3 | — | — |
| 2021 | 40.2 | 4.7 | — | — |
| 2022 | 45.8 | 8 | — | — |
| 2023 | 40.7 | 4.1 | — | — |
| 2024 | 32.5 | 3 | — | — |
| 2025 | 50.9 | 2.7 | 50.9 | 2.7 |
| 2026 | — | — | 68.9 | 3.2 |
| 2027 | — | — | 39.6 | 2.1 |
| 2028 | — | — | 33.8 | 2.2 |
| 2029 | — | — | 28.8 | 2.2 |
| 2030 | — | — | 25 | 2.2 |
| 2031 | — | — | 25 | 2.2 |
The $100 barrel is a daily headline. The WEO is an annual average.
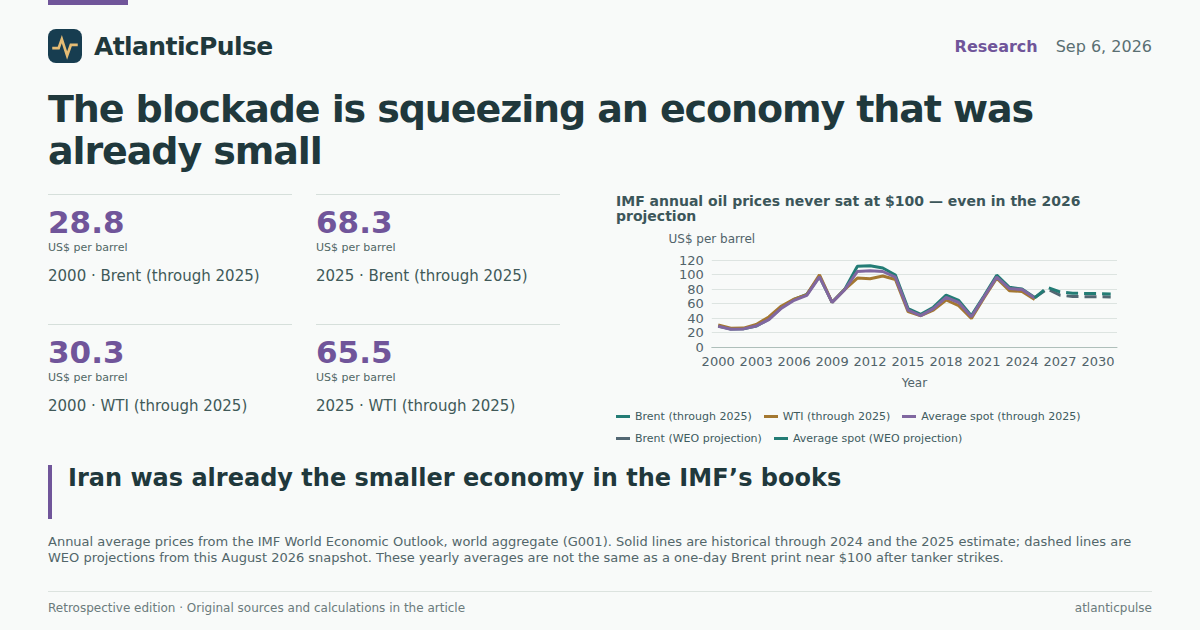
Weekend copy had Brent nearing $100 as U.S. and Iranian forces traded shots at ships. That is a spot-market sentence, and it may be true on the day. It is not what the IMF’s annual oil series show, and mixing the two is how you get a fake history of this war. In the WEO world aggregate, Brent averaged about $80 in 2024 and $68 in the 2025 estimate. The 2026 projection in this August snapshot is about $80 a barrel for Brent and about $82 for the average petroleum spot — a rebound from 2025, not a doubling. WTI sits a few dollars below Brent, as it often does. The 2011–2013 averages above $100 are in the file. So is 2022, when Brent averaged $99. The 2026 projection is not in that club.
Two cautions, both material. First, an annual average can hide a $100 week inside an $80 year; Wright’s futures comment that November gasoline was 35 cents cheaper than today’s bulk price is the same kind of averaging, just in the other direction. Second, this WEO vintage was locked before September’s tanker strikes and only partly after the February opening of the war. If Hormuz stays at ten commodity ships a day, the 2026 outturn will not look like the dashed line. The honest use of the chart is narrower: the Fund was not, as of late August, writing a $100-a-barrel year into the world outlook. American pump prices can still set records on refining bottlenecks, diesel from Russian plants, and a strait that is no longer boring.
IMF annual oil prices never sat at $100 — even in the 2026 projection

View exact chart values
| year | brent_hist | wti_hist | spot_hist | brent_proj | wti_proj | spot_proj |
|---|---|---|---|---|---|---|
| 2000 | 28.8 | 30.3 | 28.5 | — | — | — |
| 2001 | 24.7 | 25.9 | 24.5 | — | — | — |
| 2002 | 25.1 | 26.1 | 25 | — | — | — |
| 2003 | 28.8 | 31.1 | 28.9 | — | — | — |
| 2004 | 38.2 | 41.4 | 37.8 | — | — | — |
| 2005 | 54.7 | 56.5 | 53.5 | — | — | — |
| 2006 | 65.6 | 66.1 | 64.4 | — | — | — |
| 2007 | 72.7 | 72.3 | 71.2 | — | — | — |
| 2008 | 97.3 | 99.6 | 96.8 | — | — | — |
| 2009 | 61.6 | 61.7 | 61.5 | — | — | — |
| 2010 | 79.8 | 79.4 | 79.1 | — | — | — |
| 2011 | 111.5 | 95.1 | 104.1 | — | — | — |
| 2012 | 112 | 94.2 | 105.1 | — | — | — |
| 2013 | 109 | 97.9 | 104.2 | — | — | — |
| 2014 | 99.3 | 93.1 | 96.3 | — | — | — |
| 2015 | 53 | 48.8 | 50.9 | — | — | — |
| 2016 | 45.1 | 43.2 | 43.3 | — | — | — |
| 2017 | 54.9 | 50.9 | 53 | — | — | — |
| 2018 | 71.6 | 64.8 | 68.5 | — | — | — |
| 2019 | 64.2 | 56.9 | 61.4 | — | — | — |
| 2020 | 43.3 | 39.4 | 41.8 | — | — | — |
| 2021 | 70.8 | 68 | 69.2 | — | — | — |
| 2022 | 99 | 94.8 | 96.4 | — | — | — |
| 2023 | 82.3 | 77.6 | 80.6 | — | — | — |
| 2024 | 79.9 | 76.6 | 79.2 | — | — | — |
| 2025 | 68.3 | 65.5 | 67.7 | 68.3 | 65.5 | 67.7 |
| 2026 | — | — | — | 80.2 | 75.1 | 82.2 |
| 2027 | — | — | — | 71.5 | 66.4 | 76 |
| 2028 | — | — | — | 69.7 | 64.8 | 74.2 |
| 2029 | — | — | — | 69.4 | 64.3 | 73.9 |
| 2030 | — | — | — | 69.4 | 63.8 | 73.7 |
| 2031 | — | — | — | 69.1 | 63.1 | 73.3 |
A current account that is no war chest
Oil states are supposed to fatten a current-account surplus when prices rise. Iran’s series is messier. The surplus peaked near 8.1 percent of GDP in 2011, when the average petroleum spot was about $104 a barrel. It was 7.6 percent in 2018, with oil much lower, then slipped into deficit in 2019 and 2020. The 2024 reading is a modest 3.2 percent surplus; the 2025 estimate is 0.6 percent. The 2026 projection is a 1.8 percent deficit. Plot those historical and 2025 points against the average spot price and you do not get a tight upward slope. High-oil years help, until sanctions, a cheap rial, and import compression scramble the relationship. That scatter is a description, not a model of the blockade.
The policy moral is unromantic. Wright is promising regime change, or policy change, by drying up oil revenues. The WEO already shows an Iran whose dollar output is half its 2011 peak, whose inflation is in the fifties, and whose external surplus had already dwindled toward zero before this weekend’s explosions. The United States is not fighting a peer economy. It is fighting a sanctioned, inflation-ridden, mid-sized oil state whose neighbours’ dollar GDPs are larger, and whose annual oil price in the Fund’s own book had not, as of August, been rewritten into a $100 year. Whether that is enough to change their regime is a political bet. The books say the squeeze is real, old, and still smaller than the slogan.
Higher oil prices have not reliably filled Iran’s current account

View exact chart values
| year | avg_spot_usd_bbl | iran_ca_pct_gdp |
|---|---|---|
| 2000 | 28.5 | 2.79 |
| 2001 | 24.5 | 1.48 |
| 2002 | 25 | 2.21 |
| 2003 | 28.9 | 0.42 |
| 2004 | 37.8 | 0.63 |
| 2005 | 53.5 | 5.57 |
| 2006 | 64.4 | 6.31 |
| 2007 | 71.2 | 7.57 |
| 2008 | 96.8 | 4.58 |
| 2009 | 61.5 | 1.86 |
| 2010 | 79.1 | 4.6 |
| 2011 | 104.1 | 8.1 |
| 2012 | 105.1 | 4.8 |
| 2013 | 104.2 | 5.08 |
| 2014 | 96.3 | 2.55 |
| 2015 | 50.9 | 0.26 |
| 2016 | 43.3 | 2.77 |
| 2017 | 53 | 2.94 |
| 2018 | 68.5 | 7.63 |
| 2019 | 61.4 | -0.66 |
| 2020 | 41.8 | -1.74 |
| 2021 | 69.2 | 3.63 |
| 2022 | 96.4 | 3.52 |
| 2023 | 80.6 | 2.04 |
| 2024 | 79.2 | 3.18 |
| 2025 | 67.7 | 0.64 |
Sources and methods
Research date: 11 September 2026 (extract retrieval timestamp). Historical edition date: 6 September 2026. This is retrospective enrichment using a pinned IMF WEO snapshot, not an as-known-on-edition-date reconstruction.
Data snapshot: IMF World Economic Outlook normalized run 20260824T140954Z (snapshot_created_utc 2026-08-24). Underlying raw run 20260810. WEO is published in April and October; this file almost certainly reflects the April 2026 vintage plus any updates in the August ingest. Later revisions may differ.
Observation periods: annual values dated 1 January 2000 through 1 January 2031. Series used: GDP at current U.S. dollars (NGDPD), GDP at constant prices percent change (NGDP_RPCH), GDP per capita current U.S. dollars (NGDPDPC), average consumer-price inflation percent change (PCPIPCH), current-account balance percent of GDP (BCA_NGDPD), Brent (POILBRE), WTI (POILWTI), and average petroleum spot (POILAPSP). Geographies: IRN, USA, SAU, ARE, IRQ; oil prices on world aggregate G001.
Status rule applied in calculation iran-weo-core: years 2000-2024 treated as historical; 2025 as estimate; 2026-2031 as projection. The source file does not flag realized versus forecast rows; that split is an analyst convention for this vintage and should be read as a caveat, not as IMF metadata.
Units: GDP values in the extract are in U.S. dollars (full units, not billions). Inflation, growth, and current-account ratios are percent. Oil prices are U.S. dollars per barrel, annual averages. Missing is not zero; no nulls were filled. Dollar GDP is not real output and is not household income. Cross-country GDP ratios mix prices, exchange rates, and volumes.
The 6 September 2026 tanker strikes, Hormuz transit counts, and U.S. retail gasoline/diesel prices cited in the motive come from that day’s reporting. They are not in the WEO extract. Annual IMF oil averages are not daily spot prints. No causal effect of the blockade or the war is inferred from these descriptive comparisons.
Research completed 2026-09-11, for the September 6, 2026 news edition. This is retrospective analysis, not a reconstruction of information available that day.
- IMF World Economic Outlook: Source 1