Research
The bankruptcy docket got busier. The start-up queue did not empty.
A busier court, and a still-crowded inbox
The American Bankruptcy Institute’s September tally is the kind of number that sounds like a verdict. U.S. bankruptcy filings in the first nine months of 2026 reached 469,719, up 11 percent from the same stretch of 2025. Individuals accounted for 444,252 of those cases. Business filings rose 7 percent. The sharpest jump was in Subchapter V, the Chapter 11 track built for smaller firms: 2,442 cases, up 46 percent. ABI’s Amy Quackenboss blamed “persistent inflationary pressures, elevated borrowing costs, and economic uncertainty.” Credit-card rates have sat above 20 percent for more than three years. None of that is a rounding error.
It is also not the same thing as an economy that has stopped producing new firms. The Census Bureau’s Business Formation Statistics count applications for an Employer Identification Number — the paperwork that usually comes before a company exists, not after it fails. Those weekly, not-seasonally-adjusted counts, summed through the week ending 29 August 2026, show 4.35 million U.S. applications in that comparable year-to-date window. That is 17 percent more than the same weeks of 2025 and 81 percent more than 2019. The 2026 total is not a full year. It is already larger than several recent full-year-to-date runs.
Those two ledgers can be true at once. A court docket records people and firms that have already run out of road. An EIN application records people who are still hoping to get on it. The official books do not say the first caused the second, or the reverse. They do say that, as of late summer, Americans had not stopped lining up.
Through late August, 2026 already outran prior years

View exact chart values
| year | applications |
|---|---|
| 2019 YTD | 2408580 |
| 2024 YTD | 3535110 |
| 2025 YTD | 3734290 |
| 2026 YTD | 4353090 |
The mix inside the queue is the tell
Headline applications are a noisy series. They jumped in 2020 and again in 2021, when pandemic-era sole-proprietor filings flooded the system, and they have stayed high. Quarterly sums of the weekly file show 1.72 million applications in 2026 Q1 and 1.66 million in 2026 Q2 — both above the same quarters of 2025. Census flags two thinner slices that are more likely to become actual employers. “High-propensity” applications are those the bureau judges more likely to turn into firms with payroll. “Planned wages” applications are those that say they intend to pay wages.
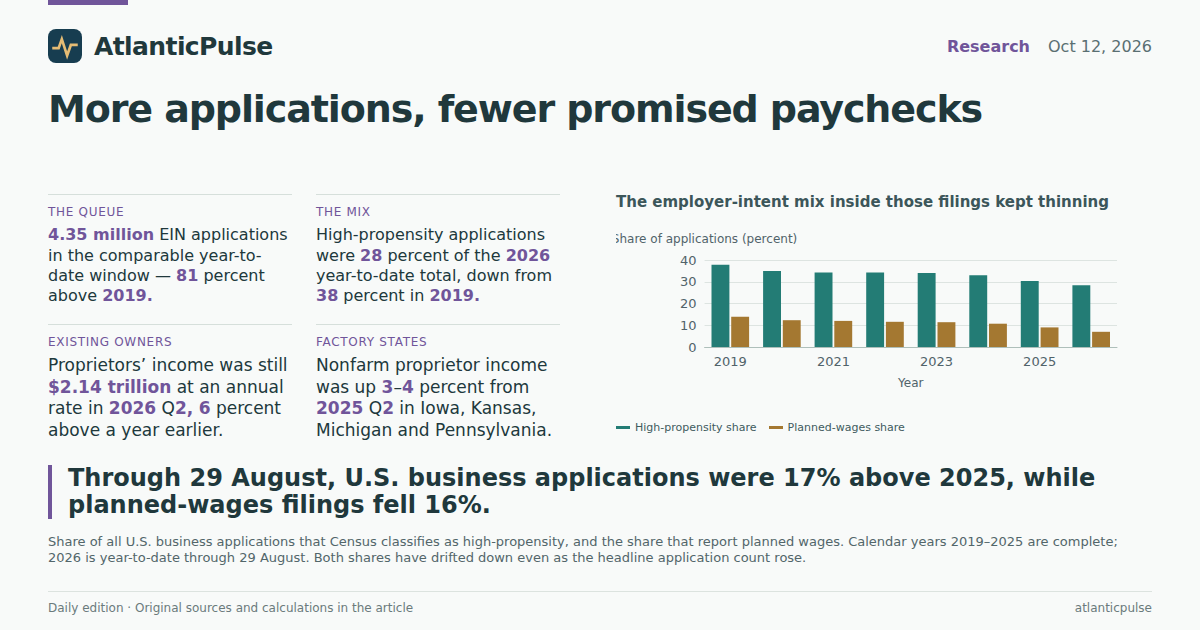
Those slices have not kept up with the headline. High-propensity applications in the 2026 year-to-date window were 1.24 million, only 5 percent above 2025. Their share of all applications fell from 38 percent in calendar 2019 to 30 percent in 2025 and 28 percent in 2026 through late August. Planned-wages applications fell 16 percent from 2025’s comparable window, to 307,000. Their share dropped from 14 percent in 2019 to 9 percent in 2025 and 7 percent in 2026 year-to-date.
That is the split that matters for a bankruptcy story. More people are filing the form. A smaller fraction of them look, on Census’s own flags, like future employers. The weekly file is not seasonally adjusted, so week-to-week swings include holidays and tax deadlines. The year-to-date comparison uses the same closing month-day in each year, which is why 2019 through 2026 can be lined up at all. It is not a claim that 2026 will finish as a record year, and it is not a count of firms that opened, hired, or survived.
Americans kept filing to start companies after the pandemic boom

View exact chart values
| label | applications | high_propensity | planned_wages |
|---|---|---|---|
| 2019 Q1 | 1040270 | 383180 | 144920 |
| 2019 Q2 | 882450 | 342700 | 127120 |
| 2019 Q3 | 833980 | 316410 | 115080 |
| 2019 Q4 | 736860 | 278540 | 100120 |
| 2020 Q1 | 995850 | 370360 | 131190 |
| 2020 Q2 | 998030 | 342040 | 120880 |
| 2020 Q3 | 1373060 | 469400 | 159010 |
| 2020 Q4 | 970560 | 337030 | 120290 |
| 2021 Q1 | 1577910 | 536890 | 191730 |
| 2021 Q2 | 1515670 | 521080 | 177950 |
| 2021 Q3 | 1228380 | 420640 | 147720 |
| 2021 Q4 | 1080940 | 375410 | 132870 |
| 2022 Q1 | 1464530 | 484950 | 168940 |
| 2022 Q2 | 1331760 | 459750 | 153020 |
| 2022 Q3 | 1203870 | 416790 | 139450 |
| 2022 Q4 | 1074230 | 372640 | 129300 |
| 2023 Q1 | 1528150 | 521510 | 174000 |
| 2023 Q2 | 1430500 | 483900 | 155540 |
| 2023 Q3 | 1349070 | 453440 | 153180 |
| 2023 Q4 | 1270610 | 435490 | 155670 |
| 2024 Q1 | 1525330 | 504480 | 161140 |
| 2024 Q2 | 1325700 | 438440 | 143670 |
| 2024 Q3 | 1238020 | 411920 | 132340 |
| 2024 Q4 | 1061120 | 342170 | 113730 |
| 2025 Q1 | 1554670 | 498920 | 160870 |
| 2025 Q2 | 1433390 | 451210 | 137270 |
| 2025 Q3 | 1395480 | 410420 | 115490 |
| 2025 Q4 | 1289270 | 357100 | 98470 |
| 2026 Q1 | 1715440 | 498260 | 131360 |
| 2026 Q2 | 1657470 | 476340 | 113540 |
The employer-intent mix inside those filings kept thinning

View exact chart values
| year | hp_share_pct | wage_share_pct |
|---|---|---|
| 2019 | 37.8 | 13.9 |
| 2020 | 35 | 12.3 |
| 2021 | 34.3 | 12 |
| 2022 | 34.2 | 11.6 |
| 2023 | 34 | 11.4 |
| 2024 | 33 | 10.7 |
| 2025 | 30.3 | 9 |
| 2026 YTD | 28.4 | 7 |
The people already in business were still earning more
If Subchapter V is filling up because existing owners are going broke, that squeeze should eventually show up in proprietors’ income — the Bureau of Economic Analysis’s measure of current-production income for sole proprietors, partnerships, and tax-exempt cooperatives. It is published as a seasonally adjusted annual rate, not as cash received in the quarter. In 2026 Q2 it ran at $2.14 trillion, 6 percent above 2025 Q2 and 39 percent above 2019 Q2. Nonfarm proprietors accounted for $2.04 trillion of that. Farm proprietors, a much smaller slice, were at $100 billion, 11 percent above a year earlier.
As a share of all personal income, proprietors have slipped rather than collapsed. They were 8.4 percent of U.S. personal income in 2019 Q2 and 7.8 percent in 2026 Q2. Personal income itself was $27.4 trillion at an annual rate. The arithmetic is blunt: the owner-operator slice of the income pie is a bit thinner than before the pandemic, and the pie is a lot larger. That is not the same as a wave of failed shops, and it is not proof those shops are healthy. BEA’s series includes partnerships and makes large national adjustments for misreporting, depreciation, and inventories. It will not tell you whether a clock factory in Zeeland, Michigan, made it.
It will tell you that, in the four factory-and-farm states named in this week’s plant-closure reporting, nonfarm proprietors’ income was still rising on the official books. From 2025 Q2 to 2026 Q2 the annualized flow was up 3.4 percent in Iowa, 3.9 percent in Kansas, 4.2 percent in Michigan, and 4.3 percent in Pennsylvania. Those are not manufacturing payrolls. They are not a census of Main Street. They are the income measure the national accounts have for the people who, when things go badly, are the ones who file Subchapter V.
Proprietors’ earnings were still rising into mid-2026

View exact chart values
| label | proprietors_saar_bil | nonfarm_saar_bil | farm_saar_bil |
|---|---|---|---|
| 2019 Q1 | 1542.48 | 1505.84 | 36.65 |
| 2019 Q2 | 1542.97 | 1515.99 | 26.98 |
| 2019 Q3 | 1576.4 | 1528.53 | 47.87 |
| 2019 Q4 | 1587.42 | 1537.6 | 49.81 |
| 2020 Q1 | 1591.27 | 1542.28 | 48.99 |
| 2020 Q2 | 1433.07 | 1400.43 | 32.64 |
| 2020 Q3 | 1713.41 | 1658.72 | 54.69 |
| 2020 Q4 | 1683.26 | 1592.36 | 90.9 |
| 2021 Q1 | 1703.09 | 1648.1 | 55 |
| 2021 Q2 | 1852.18 | 1751.99 | 100.19 |
| 2021 Q3 | 1877.68 | 1784.38 | 93.31 |
| 2021 Q4 | 1868.57 | 1798.16 | 70.41 |
| 2022 Q1 | 1868.58 | 1772.96 | 95.62 |
| 2022 Q2 | 1873.62 | 1765.76 | 107.85 |
| 2022 Q3 | 1894.19 | 1788.94 | 105.26 |
| 2022 Q4 | 1874.14 | 1769.54 | 104.6 |
| 2023 Q1 | 1877.66 | 1769.55 | 108.11 |
| 2023 Q2 | 1842.96 | 1757.46 | 85.5 |
| 2023 Q3 | 1838.87 | 1766.84 | 72.03 |
| 2023 Q4 | 1849.58 | 1794.2 | 55.38 |
| 2024 Q1 | 1878.53 | 1820.5 | 58.03 |
| 2024 Q2 | 1914.66 | 1855.34 | 59.32 |
| 2024 Q3 | 1936.74 | 1874.81 | 61.94 |
| 2024 Q4 | 1965.41 | 1893.48 | 71.93 |
| 2025 Q1 | 2018.14 | 1923.23 | 94.91 |
| 2025 Q2 | 2024.25 | 1934.59 | 89.66 |
| 2025 Q3 | 2044.99 | 1948.85 | 96.14 |
| 2025 Q4 | 2045.33 | 1970.44 | 74.89 |
| 2026 Q1 | 2108.79 | 2005.81 | 102.98 |
| 2026 Q2 | 2137.18 | 2037.66 | 99.52 |
Factory-state small-business income did not crack in the official books

View exact chart values
| state | pct_vs_2025 | q2_2026_bil |
|---|---|---|
| Iowa | 3.4 | 14.15 |
| Kansas | 3.9 | 14 |
| Michigan | 4.2 | 43.95 |
| Pennsylvania | 4.3 | 71.76 |
What the two ledgers do not settle
Put the pieces next to each other and the picture is less a collapse than a sorting. More people are still applying to start something. A shrinking share of those applications look like employers. The people already in the proprietor column were still taking home more money, in nominal annualized terms, through mid-2026. Bankruptcy court, meanwhile, is seeing more of the cases that happen when credit is expensive and inflation has not gone back to 2021. The ABI count runs through September. The Census weekly file in this snapshot ends 29 August. BEA’s income estimate ends in the second quarter. None of those calendars is “today.”
The series also refuse a tidy moral. An EIN application is not a job. A high-propensity flag is not a hired worker. Planned wages can be abandoned. Proprietors’ income can rise because remaining owners are earning more, not because more owners survived. Subchapter V can jump because Congress made the box easier to use, because more firms are distressed, or both. This file cannot separate those. It can say the start-up queue did not empty when the bankruptcy docket got busier, and that the applications still pouring in look less like payrolls than they did six years ago.
That is an unsatisfying punchline only if you wanted a single number to stand in for “the small-business economy.” The useful one is the split. People are still filling out the form. Fewer of them are promising a paycheck. The owners already on the books had not, as of June, seen their official income crack. The court is where the ones who already did the cracking show up.
Sources and methods
This analysis uses pinned Census Business Formation Statistics weekly files (release census-business-formation-2026-09-11, weekly observations through the week ending 29 August 2026) and BEA quarterly state personal income (release bea-regional-state-quarterly-2026-09-30, through 2026 Q2). Provider lag is normal; these are not current-day observations.
Weekly application counts are not seasonally adjusted. Year-to-date comparisons sum weeks whose period-end month-day is on or before 29 August in each year so that 2019–2026 line up on the same closing date. 2020 and 2021 year-to-date windows contain 35 weeks rather than 34 because of calendar alignment of week endings; that is disclosed in the calculation tables and is not treated as a full extra month of activity.
Seasonally adjusted quarterly BFS in this snapshot ends in 2020. Quarterly 2019–2026 application totals used in charts are sums of weekly NSA counts. 2026 Q3 is omitted from quarterly charts because the weekly file does not complete that quarter.
High-propensity and planned-wages series are Census flags on applications, not counts of firms that later hired. An Employer Identification Number application is not an open business.
Proprietors’ income is BEA current-production income for sole proprietors, partnerships, and tax-exempt cooperatives, with inventory valuation and capital consumption adjustments, published as a seasonally adjusted annual rate in millions of dollars. It is not a quarterly cash total and not a count of firms. Farm proprietors exclude corporate farms. State nonfarm figures inherit national adjustments allocated with tax-return data.
Bankruptcy filing counts, including the 11 percent rise, 469,719 cases, and 46 percent Subchapter V increase, come from this edition’s reporting of the American Bankruptcy Institute’s 8 October 2026 statement, not from the Census or BEA extracts. The series are not the same universe and are not used to infer that applications caused filings or that income growth prevented them. Missing observations were skipped and were not treated as zero.
Research completed 2026-10-13, for the October 12, 2026 news edition. The available source data may cover earlier periods; see the observation periods and source vintages above.