Research
The 98-percent payroll was not a one-month fluke
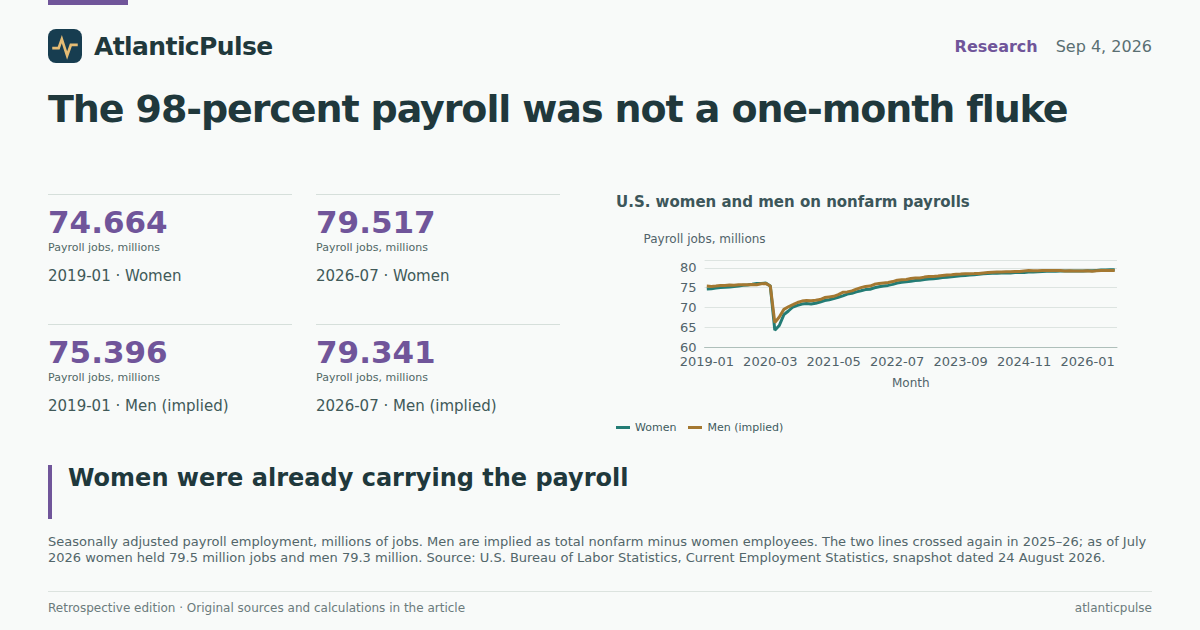
A 50–50 payroll, before August even printed
Friday’s August jobs report was the kind of headline that makes a labor economist reach for a cold compress. Employers added 162,000 jobs, nearly triple the forecast, and the unemployment rate sat at 4.1 percent. Buried in the same print was a stranger split: women accounted for 158,000 of those jobs, about 98 percent; men added roughly 4,000. Heather Long at Navy Federal Credit Union called the month-to-month gender split “noisy,” and she is not wrong. Teachers returning from summer and restaurant hiring can scramble a single seasonally adjusted month. The useful question is whether August was a one-off, or whether the official payroll had already become a women’s market.
The establishment survey sitting in the Bureau of Labor Statistics Current Employment Statistics files — the same family of numbers behind the monthly jobs report — answers that without waiting on August. In the pinned CES snapshot, seasonally adjusted nonfarm payrolls in July 2026 totaled 158.9 million jobs. Women held 79.5 million of them, 50.06 percent. Men, measured the only way CES allows here — total jobs minus women employees — held 79.3 million. That is not a landslide. It is a thin majority, about 176,000 jobs, on a payroll of nearly 159 million. It is also not a rounding error that appeared on Friday.
The two lines have been circling each other for years. They plunged together in the spring of 2020, when the pandemic erased tens of millions of jobs in a month, then climbed back. Women slipped behind again in the recovery, then caught up. By February 2026 the women’s line was back on top, and it stayed there through July.
U.S. women and men on nonfarm payrolls

View exact chart values
| period | women_millions | men_millions |
|---|---|---|
| 2019-01 | 74.664 | 75.396 |
| 2019-02 | 74.749 | 75.318 |
| 2019-03 | 74.903 | 75.392 |
| 2019-04 | 75.064 | 75.527 |
| 2019-05 | 75.085 | 75.533 |
| 2019-06 | 75.16 | 75.678 |
| 2019-07 | 75.32 | 75.617 |
| 2019-08 | 75.426 | 75.743 |
| 2019-09 | 75.604 | 75.761 |
| 2019-10 | 75.698 | 75.762 |
| 2019-11 | 75.852 | 75.815 |
| 2019-12 | 76.033 | 75.761 |
| 2020-01 | 76.04 | 75.991 |
| 2020-02 | 76.202 | 76.091 |
| 2020-03 | 75.461 | 75.434 |
| 2020-04 | 64.258 | 66.168 |
| 2020-05 | 65.443 | 67.597 |
| 2020-06 | 68.173 | 69.498 |
| 2020-07 | 69.099 | 70.156 |
| 2020-08 | 70.112 | 70.709 |
| 2020-09 | 70.514 | 71.256 |
| 2020-10 | 70.85 | 71.61 |
| 2020-11 | 71.009 | 71.724 |
| 2020-12 | 70.84 | 71.708 |
| 2021-01 | 71.06 | 71.803 |
| 2021-02 | 71.385 | 71.995 |
| 2021-03 | 71.749 | 72.483 |
| 2021-04 | 71.927 | 72.66 |
| 2021-05 | 72.24 | 72.825 |
| 2021-06 | 72.567 | 73.253 |
| 2021-07 | 72.93 | 73.832 |
| 2021-08 | 73.373 | 73.941 |
| 2021-09 | 73.581 | 74.19 |
| 2021-10 | 73.941 | 74.631 |
| 2021-11 | 74.208 | 75.022 |
| 2021-12 | 74.508 | 75.308 |
| 2022-01 | 74.61 | 75.396 |
| 2022-02 | 74.981 | 75.844 |
| 2022-03 | 75.228 | 76.087 |
| 2022-04 | 75.408 | 76.215 |
| 2022-05 | 75.578 | 76.346 |
| 2022-06 | 75.823 | 76.535 |
| 2022-07 | 76.191 | 76.881 |
| 2022-08 | 76.359 | 77.003 |
| 2022-09 | 76.48 | 77.102 |
| 2022-10 | 76.638 | 77.301 |
| 2022-11 | 76.816 | 77.426 |
| 2022-12 | 76.896 | 77.446 |
| 2023-01 | 77.095 | 77.681 |
| 2023-02 | 77.208 | 77.858 |
| 2023-03 | 77.279 | 77.855 |
| 2023-04 | 77.393 | 77.982 |
| 2023-05 | 77.548 | 78.107 |
| 2023-06 | 77.657 | 78.223 |
| 2023-07 | 77.759 | 78.284 |
| 2023-08 | 77.886 | 78.375 |
| 2023-09 | 77.992 | 78.425 |
| 2023-10 | 78.065 | 78.511 |
| 2023-11 | 78.175 | 78.528 |
| 2023-12 | 78.286 | 78.571 |
| 2024-01 | 78.414 | 78.618 |
| 2024-02 | 78.5 | 78.738 |
| 2024-03 | 78.62 | 78.846 |
| 2024-04 | 78.635 | 78.895 |
| 2024-05 | 78.67 | 78.938 |
| 2024-06 | 78.709 | 78.986 |
| 2024-07 | 78.7 | 79.048 |
| 2024-08 | 78.75 | 79.007 |
| 2024-09 | 78.81 | 79.102 |
| 2024-10 | 78.821 | 79.124 |
| 2024-11 | 78.867 | 79.212 |
| 2024-12 | 78.984 | 79.332 |
| 2025-01 | 79.002 | 79.266 |
| 2025-02 | 79.016 | 79.294 |
| 2025-03 | 79.057 | 79.32 |
| 2025-04 | 79.157 | 79.328 |
| 2025-05 | 79.177 | 79.321 |
| 2025-06 | 79.165 | 79.313 |
| 2025-07 | 79.196 | 79.346 |
| 2025-08 | 79.254 | 79.218 |
| 2025-09 | 79.255 | 79.293 |
| 2025-10 | 79.185 | 79.223 |
| 2025-11 | 79.194 | 79.255 |
| 2025-12 | 79.2 | 79.232 |
| 2026-01 | 79.293 | 79.299 |
| 2026-02 | 79.266 | 79.17 |
| 2026-03 | 79.364 | 79.286 |
| 2026-04 | 79.448 | 79.35 |
| 2026-05 | 79.497 | 79.364 |
| 2026-06 | 79.549 | 79.332 |
| 2026-07 | 79.517 | 79.341 |
This is the third time, not the first
A 50 percent share sounds like a sudden social revolution. The annual averages say it has been a long grind. In 1990, women held 47.1 percent of nonfarm payroll jobs. The share drifted up through the 1990s expansion, then jumped in the 2008–09 recession — not because women suddenly flooded factories, but because male-heavy goods jobs collapsed. The annual average reached 49.98 percent in 2009. The first month in this 1990–2026 extract when women outnumbered implied men on the payroll was June 2009.
That majority did not last. Men took back a slim lead as construction and manufacturing recovered. The share hovered in the high 49s for a decade, then poked above 50 percent again in late 2019 and early 2020 before the pandemic knocked women off the payroll faster than men. Fortune’s account of August called the latest overtake the third time in history. The CES history in this snapshot is consistent with that counting: a recession crossover in 2009, a brief one around 2019–20, and this one.
What is new is the stickiness. After a one-month overtake in August 2025, the share slipped back under 50 percent in the autumn, then crossed for good in February 2026. The 2026 average through July is 50.04 percent. A few tenths of a percentage point is not a new labor force. It is what you get when one set of industries keeps hiring and another set does not.
Women’s share of U.S. nonfarm payrolls

View exact chart values
| year | women_thousands | men_thousands | women_share | months |
|---|---|---|---|---|
| 1990 | 51619.6 | 57908.3 | 47.13 | 12 |
| 1991 | 51728.8 | 56705.3 | 47.71 | 12 |
| 1992 | 52183.8 | 56607.5 | 47.97 | 12 |
| 1993 | 53240.8 | 57692.7 | 47.99 | 12 |
| 1994 | 54831.2 | 59554.8 | 47.94 | 12 |
| 1995 | 56295.5 | 61115.1 | 47.95 | 12 |
| 1996 | 57500.5 | 62319.8 | 47.99 | 12 |
| 1997 | 59042.5 | 63887.4 | 48.03 | 12 |
| 1998 | 60463 | 65672.2 | 47.94 | 12 |
| 1999 | 61990.9 | 67236.9 | 47.97 | 12 |
| 2000 | 63406 | 68611.5 | 48.03 | 12 |
| 2001 | 63883.5 | 68195.1 | 48.37 | 12 |
| 2002 | 63597.3 | 67036.4 | 48.68 | 12 |
| 2003 | 63494.7 | 66830.5 | 48.72 | 12 |
| 2004 | 64014.3 | 67741 | 48.59 | 12 |
| 2005 | 64996.5 | 69026.6 | 48.5 | 12 |
| 2006 | 65825.9 | 70606.8 | 48.25 | 12 |
| 2007 | 67133.3 | 70845.1 | 48.65 | 12 |
| 2008 | 67453.8 | 69772.7 | 49.16 | 12 |
| 2009 | 65617.7 | 65673.4 | 49.98 | 12 |
| 2010 | 65086.2 | 65248.4 | 49.94 | 12 |
| 2011 | 65449.7 | 66467 | 49.61 | 12 |
| 2012 | 66374 | 67780.5 | 49.48 | 12 |
| 2013 | 67426.3 | 68934.3 | 49.45 | 12 |
| 2014 | 68564.3 | 70358.4 | 49.35 | 12 |
| 2015 | 69970.2 | 71831.2 | 49.34 | 12 |
| 2016 | 71518.2 | 72813.8 | 49.55 | 12 |
| 2017 | 72624.5 | 73985.9 | 49.54 | 12 |
| 2018 | 73942.4 | 74951.2 | 49.66 | 12 |
| 2019 | 75296.5 | 75608.6 | 49.9 | 12 |
| 2020 | 70666.8 | 71495.2 | 49.71 | 12 |
| 2021 | 72789.1 | 73495.2 | 49.76 | 12 |
| 2022 | 75917.3 | 76631.8 | 49.77 | 12 |
| 2023 | 77695.2 | 78200 | 49.84 | 12 |
| 2024 | 78706.7 | 78987.2 | 49.91 | 12 |
| 2025 | 79154.8 | 79284.1 | 49.96 | 12 |
| 2026 | 79419.1 | 79306 | 50.04 | 7 |
The jobs women already have
CES does not assign a gender to every industry in a way that lets you add the whole economy twice. It does publish women-employee counts for the big supersectors, which is enough to see the shape of the payroll. In July 2026, women held 76.5 percent of private education and health jobs, 58.4 percent of government jobs, and 52.3 percent of leisure and hospitality jobs. They held 28.6 percent of manufacturing jobs, 22.7 percent of the broader goods-producing group, and 14.3 percent of construction jobs.
That is the occupational sorting everyone already knows, written in payroll counts. Hospitals, clinics, nursing homes, and social assistance are female-majority workplaces. So are many public-sector jobs, especially local schools. Construction sites and machine shops are not. If hiring concentrates in the first group and stalls in the second, the women’s share of the whole payroll rises even if no individual woman switches industries and even if men’s employment barely moves.
One caution, because CES is an establishment survey: these are jobs, not unique people. A nurse with two part-time gigs counts twice. A man implied as “total minus women” is a residual, not a separately enumerated male payroll. Food services, the industry that juiced August’s hospitality rebound in the news coverage, is left off the gender-share chart because the matched women series in this snapshot did not yet have a July 2026 observation. The supersector still tells the story.
Where women already hold the jobs

View exact chart values
| industry | all_thousands | women_thousands | men_thousands | women_share |
|---|---|---|---|---|
| Construction | 8343 | 1197 | 7146 | 14.3 |
| Goods-producing | 21561 | 4894 | 16667 | 22.7 |
| Manufacturing | 12611 | 3612 | 8999 | 28.6 |
| Leisure and hospitality | 16931 | 8853 | 8078 | 52.3 |
| Government | 23270 | 13599 | 9671 | 58.4 |
| Private education and health | 27962 | 21390 | 6572 | 76.5 |
Since January 2025, health care has been the labor market
Look at who actually added jobs after January 2025, the first month of the second Trump term and a clean waypoint for “has this already happened.” From January 2025 to July 2026, total nonfarm payrolls rose by 590,000. Women accounted for 515,000 of that, 87 percent. Men added 75,000. That is not 98 percent, and it is not a single noisy month. It is a year and a half in which almost nine in ten net payroll jobs went to women.
The industry mix is blunter. Private education and health added 956,000 jobs over that span — more than the entire net payroll — including 704,000 women and 252,000 men. Leisure and hospitality added 99,000. Construction added 79,000, mostly men. Manufacturing shed 62,000. Government shed 287,000, women and men both. Goods-producing employment as a whole was essentially unchanged, up 2,000, with women down 36,000 and men up 38,000. In other words: the clinics hired, the school-adjacent public payroll shrank, and the factory floor did not come to the rescue of anyone’s gender gap.
This is also why a 98 percent August print is less mysterious than it looks. When the growing industries are already three-quarters women, and the shrinking ones are mixed or male, a strong services month will almost always skew female. Long’s warning still applies to any one month. It applies much less to a 19-month running total.
Who added the jobs after January 2025

View exact chart values
| industry | women_change | men_change | all_change |
|---|---|---|---|
| Private education and health | 704 | 252 | 956 |
| Leisure and hospitality | 63 | 36 | 99 |
| Government | -157 | -130 | -287 |
| Manufacturing | -53 | -9 | -62 |
| Construction | 17 | 62 | 79 |
| Goods-producing | -36 | 38 | 2 |
The 12-month map, and the pay that did not boom
Narrow the window to the year ending July 2026, the last full year in this CES snapshot, and the same map appears before Friday’s report. Total payrolls rose 316,000. Women added 321,000 jobs; implied men fell by 5,000. Women accounted for 101.6 percent of the net gain because men’s employment edged down. Health care and social assistance added 552,000 jobs. Private education and health added 550,000. Food services and drinking places added 123,000. Leisure and hospitality as a whole added 83,000. Construction added 82,000. Manufacturing was down 14,000. Local government education, the “teacher effect” in the August commentary, was down 82,000 over the year on a seasonally adjusted basis. Government overall was down 315,000.
That last point is worth sitting with. August’s 42,000 jump in local-government education was reported as a reversal of a summer seasonal glitch. In the seasonally adjusted CES through July, local education was not in a hiring boom. It was smaller than a year earlier. The industry that has been in a hiring boom is health care. At 23.9 million jobs in July, health care and social assistance is now a larger payroll than state-plus-local-plus-federal government in this snapshot, and it is still growing.
Pay did not keep up with the vibe of a “monster” jobs report. Average hourly earnings of all private employees were $37.62 in July 2026, up 3.15 percent from $36.47 a year earlier. That matches the slow-wage story in Friday’s coverage more closely than the 162,000 headline. A labor market can add jobs, even add them mostly among women, and still leave households arguing with a $5.85 diesel ticket.
None of this says August’s 98 percent split will repeat, or that women “run” the labor market in any deeper sense than the payroll count. CES does not tell you who wanted those jobs, who was kept out of factories, or what immigration enforcement did to construction crews. It tells you where the jobs are. As of July, they were already in female-majority service industries, and the male-majority goods floor had stalled. Friday’s print was a loud month. It was not a new country.
The 12-month hiring map behind a ‘hot’ jobs print

View exact chart values
| industry | change_thousands |
|---|---|
| Government | -315 |
| Local government education | -82.2 |
| Manufacturing | -14 |
| Goods-producing | 65 |
| Construction | 82 |
| Leisure and hospitality | 83 |
| Food services and drinking places | 122.8 |
| Private education and health | 550 |
| Health care and social assistance | 552.1 |
Sources and methods
This is retrospective enrichment using the pinned CES snapshot, not a reconstruction of what was knowable on the 4 September 2026 edition date. Later releases and revisions may be present in the snapshot.
Research compiled 11 September 2026 against the BLS Current Employment Statistics snapshot created 24 August 2026 (release identifier bls-ce-snapshot-2026-08-24). Observation window: monthly seasonally adjusted series from January 1990 through July 2026 for total nonfarm all employees (CES0000000001) and women employees (CES0000000010); industry series from January 2015 through July 2026.
The August 2026 jobs print, including the reported 162,000 gain and 98 percent women share, is taken from 4 September 2026 news reporting. It is not in this CES extract and is not used as a chart value.
Men’s employment is not a published CES series here. It is implied as total nonfarm (or industry all-employees) minus women employees. That residual inherits any classification, multiple-job, and revision properties of both inputs. CES counts jobs on establishment payrolls, not unique people.
Null observations were not treated as zero. Where two rows shared a period, the first was kept; no duplicates appeared in these extracts. Food services women employees had 138 monthly observations against 139 for all employees and lacked July 2026, so that industry is omitted from gender-share and gender-growth charts. The separately published “health care” women series is not the same industry as “health care and social assistance” all employees and was not paired with it.
Annual shares are simple averages of monthly seasonally adjusted observations (2026 uses seven months). Twelve-month and January 2025–July 2026 changes are level differences, not annualized rates. Goods-producing overlaps manufacturing and construction; those series are not added together. No causal claim is drawn from the descriptive comparisons.
Research completed 2026-09-11, for the September 4, 2026 news edition. This is retrospective analysis, not a reconstruction of information available that day.