Research
The 51st state already has a bigger payroll than Hawaii
A petition, and a payroll that is not tiny
Puerto Rico’s governor signed a formal petition on Friday asking President Donald Trump and Congress to admit the island as the 51st state — which her government called the first such request from the island’s executive. The Constitution still leaves admission to Congress, which is on recess and otherwise occupied. The political argument will be about votes, taxes and status. The official jobs book is blunter.
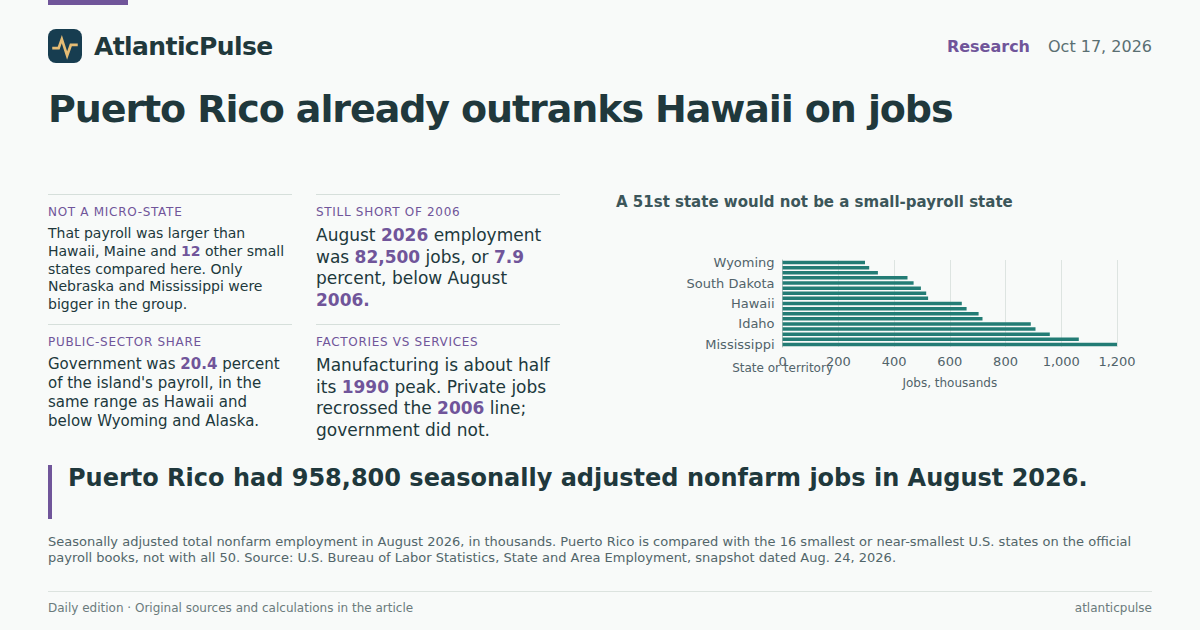
In August 2026, Puerto Rico had 958,800 seasonally adjusted nonfarm jobs. That is not a rounding error on America’s payroll. It is larger than the entire job markets of Hawaii (643,000) and Maine (660,200), larger than New Hampshire, West Virginia, Idaho and New Mexico, and more than three times Wyoming’s 295,700. Among 16 small and near-small states pulled for comparison, only Nebraska (1.06 million) and Mississippi (1.20 million) were bigger. A 51st state would walk into the Senate with a workforce that already outranks most of the states that already have two senators.
These figures come from the Bureau of Labor Statistics’ State and Area Employment series, in a snapshot dated Aug. 24, 2026. They count payroll jobs, not residents, voters or GDP. The Commerce Department’s state GDP and income accounts, used elsewhere in this research archive, do not include Puerto Rico, so this is an employment story, not a full fiscal one. It is still the cleanest official answer to a simple question the petition raises: how large is the place asking to join?
A 51st state would not be a small-payroll state

View exact chart values
| state | jobs_thousands |
|---|---|
| Wyoming | 295.7 |
| Vermont | 310.6 |
| Alaska | 341.8 |
| North Dakota | 448.3 |
| South Dakota | 470.2 |
| Delaware | 496.4 |
| Rhode Island | 515.1 |
| Montana | 522.1 |
| Hawaii | 643 |
| Maine | 660.2 |
| New Hampshire | 703.3 |
| West Virginia | 717.1 |
| Idaho | 890.7 |
| New Mexico | 907.4 |
| Puerto Rico | 958.8 |
| Nebraska | 1062.7 |
| Mississippi | 1199.8 |
The peak was 20 years ago
August snapshots, which dodge some of the remaining seasonal noise in Puerto Rico’s government series, show an island that grew through the 1990s, stalled after 2004, and then bled jobs for a decade and a half. August 2004 was 1.05 million. August 2006, just as the island’s long contraction became obvious, was 1.04 million. August 2026 is 82,500 jobs, or 7.9 percent, below that 2006 mark.
The all-month peak in the seasonally adjusted series is 1.06 million in June 2000. Treat that number with care: Puerto Rico’s government series still shows midsummer spikes even after seasonal adjustment, so June is a noisy month for totals. The August path is the fairer year-to-year comparison, and it tells the same story. Hurricane Maria’s year, August 2017, was 874,300. The pandemic trough was 767,500 in April 2020; by the following August the island was at 832,300. The recovery since then has been real. It has not put the 2000s back.
Private employers, not the government, did most of the climbing back. Private payrolls in August 2026 were 763,000, a shade above August 2006. Government payrolls were 195,800, about a third below that same benchmark. The public sector shrank; the private sector came back to where it had been, not to a boom.
Puerto Rico's payroll never fully recaptured its 2000s peak

View exact chart values
| year | nonfarm | government | private | manufacturing |
|---|---|---|---|---|
| 1990 | 843.4 | 291.5 | 551.9 | 157.6 |
| 1991 | 832.4 | 285.3 | 547.1 | 153.4 |
| 1992 | 853.9 | 286.7 | 567.2 | 153.9 |
| 1993 | 879.9 | 295.2 | 584.7 | 156.8 |
| 1994 | 916.3 | 319.3 | 597 | 155.4 |
| 1995 | 945.7 | 322.7 | 623 | 158.2 |
| 1996 | 969.9 | 311.7 | 658.2 | 157.4 |
| 1997 | 985.2 | 305.7 | 679.5 | 153.7 |
| 1998 | 994.7 | 300.8 | 693.9 | 147.2 |
| 1999 | 1005.3 | 277.8 | 727.5 | 144.4 |
| 2000 | 1021.7 | 280 | 741.7 | 142.4 |
| 2001 | 1004.8 | 284.7 | 720.1 | 127.9 |
| 2002 | 1004.1 | 295.6 | 708.5 | 120.6 |
| 2003 | 1027.1 | 304 | 723.1 | 117.6 |
| 2004 | 1052.9 | 307.9 | 745 | 118.5 |
| 2005 | 1048.7 | 303 | 745.7 | 113.4 |
| 2006 | 1041.3 | 299.6 | 741.7 | 109.1 |
| 2007 | 1033.6 | 297.5 | 736.1 | 106.6 |
| 2008 | 1012.2 | 299.3 | 712.9 | 100.4 |
| 2009 | 948.3 | 277.7 | 670.6 | 90.1 |
| 2010 | 927.7 | 263.6 | 664.1 | 86.2 |
| 2011 | 921.2 | 256.1 | 665.1 | 83.9 |
| 2012 | 942.4 | 256.8 | 685.6 | 81.4 |
| 2013 | 920.8 | 241.7 | 679.1 | 75.1 |
| 2014 | 905.5 | 233.7 | 671.8 | 74.9 |
| 2015 | 899 | 231.9 | 667.1 | 74.3 |
| 2016 | 893.2 | 227.6 | 665.6 | 73.8 |
| 2017 | 874.3 | 214.6 | 659.7 | 71.6 |
| 2018 | 869.9 | 206.4 | 663.5 | 72.3 |
| 2019 | 880.6 | 201.4 | 679.2 | 75.5 |
| 2020 | 832.3 | 200.1 | 632.2 | 74.3 |
| 2021 | 887.8 | 195.1 | 692.7 | 77.4 |
| 2022 | 927.4 | 196.4 | 731 | 82.3 |
| 2023 | 946.9 | 198.6 | 748.3 | 84.5 |
| 2024 | 953.6 | 199.1 | 754.5 | 83.2 |
| 2025 | 950.1 | 194.6 | 755.5 | 80.3 |
| 2026 | 958.8 | 195.8 | 763 | 81.4 |
Factories halved. Government shrank. Services filled in.
Index the same August figures to 2006 and the split is stark. Manufacturing is about 25 percent below that benchmark. Government is about 35 percent below. Private employment is 3 percent above. Total nonfarm sits at 92. That is not a mystery about too much government. It is a factory-and-public-payroll contraction with a services patch.
Manufacturing employment peaked at 161,500 in February 1990 and was 81,400 in August 2026 — roughly half. Construction, which the BLS series only carries on a seasonally adjusted basis from 2003, was 39,100, or 4.1 percent of the island’s payroll. The jobs that remain are in shops, offices, hotels and clinics: professional and business services at 133,700, retail at 133,600, private education and health at 128,600, leisure and hospitality at 104,600.
Federal employment on the island is 20,000, about 2.1 percent of nonfarm jobs. Statehood would not, on these books, be a story about a giant federal enclave. It would be a story about an island whose private services recovered, whose factories did not, and whose government payroll is smaller than it was a generation ago.
After 2006, factories and government shrank. Private jobs came back.

View exact chart values
| year | nonfarm_index_2006 | gov_index_2006 | mfg_index_2006 | private_index_2006 |
|---|---|---|---|---|
| 2000 | 98.1 | 93.5 | 130.5 | 100 |
| 2001 | 96.5 | 95 | 117.2 | 97.1 |
| 2002 | 96.4 | 98.7 | 110.5 | 95.5 |
| 2003 | 98.6 | 101.5 | 107.8 | 97.5 |
| 2004 | 101.1 | 102.8 | 108.6 | 100.4 |
| 2005 | 100.7 | 101.1 | 103.9 | 100.5 |
| 2006 | 100 | 100 | 100 | 100 |
| 2007 | 99.3 | 99.3 | 97.7 | 99.2 |
| 2008 | 97.2 | 99.9 | 92 | 96.1 |
| 2009 | 91.1 | 92.7 | 82.6 | 90.4 |
| 2010 | 89.1 | 88 | 79 | 89.5 |
| 2011 | 88.5 | 85.5 | 76.9 | 89.7 |
| 2012 | 90.5 | 85.7 | 74.6 | 92.4 |
| 2013 | 88.4 | 80.7 | 68.8 | 91.6 |
| 2014 | 87 | 78 | 68.7 | 90.6 |
| 2015 | 86.3 | 77.4 | 68.1 | 89.9 |
| 2016 | 85.8 | 76 | 67.6 | 89.7 |
| 2017 | 84 | 71.6 | 65.6 | 88.9 |
| 2018 | 83.5 | 68.9 | 66.3 | 89.5 |
| 2019 | 84.6 | 67.2 | 69.2 | 91.6 |
| 2020 | 79.9 | 66.8 | 68.1 | 85.2 |
| 2021 | 85.3 | 65.1 | 70.9 | 93.4 |
| 2022 | 89.1 | 65.6 | 75.4 | 98.6 |
| 2023 | 90.9 | 66.3 | 77.5 | 100.9 |
| 2024 | 91.6 | 66.5 | 76.3 | 101.7 |
| 2025 | 91.2 | 65 | 73.6 | 101.9 |
| 2026 | 92.1 | 65.4 | 74.6 | 102.9 |
Services, shops and the public sector now dwarf the factories

View exact chart values
| industry | jobs_thousands | share_of_nonfarm_pct | period |
|---|---|---|---|
| Government | 195.8 | 20.4 | 2026-08 |
| Manufacturing | 81.4 | 8.5 | 2026-08 |
| Construction | 39.1 | 4.1 | 2026-08 |
| Leisure and hospitality | 104.6 | 10.9 | 2026-08 |
| Private education and health | 128.6 | 13.4 | 2026-08 |
| Professional and business services | 133.7 | 13.9 | 2026-08 |
| Retail trade | 133.6 | 13.9 | 2026-08 |
| Federal government | 20 | 2.1 | 2026-08 |
A fifth of the jobs are public. That is not exotic.
Government still accounts for 20.4 percent of Puerto Rico’s nonfarm payroll. That sounds like a lot until it is set beside other small, isolated, or resource-and-tourism economies. Wyoming’s government share in August 2026 was 24.1 percent. Alaska’s was 22.8 percent. Hawaii’s was 19.6 percent. Vermont’s was 18.1 percent. Maine’s was 15.5 percent. On that short list, Puerto Rico sits in the middle, not on a cliff.
The comparison is limited to the states whose government series were pulled for this analysis; it is not a 50-state ranking. It is enough to retire a cartoon. The island asking for two senators is not a company town of public employees. It is a services economy with a still-large, but shrunken, public sector and a factory base that is half what it was in 1990.
None of this tells Congress whether to admit Puerto Rico. Payroll size is not population, is not income, and is not a tax base. It does tell readers what the 51st state would look like on the one official ledger that actually covers the island month by month: not a micro-state, not a government colony, and not yet back to the jobs it had before the long contraction began.
Government is a fifth of the island's payroll — not an outlier

View exact chart values
| state | gov_share_pct |
|---|---|
| Maine | 15.5 |
| Vermont | 18.1 |
| Hawaii | 19.6 |
| Puerto Rico | 20.4 |
| Alaska | 22.8 |
| Wyoming | 24.1 |
Sources and methods
All employment figures are from the U.S. Bureau of Labor Statistics State and Area Employment program, in a research snapshot dated Aug. 24, 2026 (release identifier bls-sm-snapshot-2026-08-24). Units are thousands of jobs. Totals use seasonally adjusted series unless noted.
History charts use August of each year so that year-to-year comparisons are not dominated by remaining midsummer spikes in Puerto Rico’s government series, which are visible even after seasonal adjustment. The all-month peak (June 2000) is reported with that caveat.
Ranking compares Puerto Rico with 16 small or near-small U.S. states, not with all 50. Government-share comparisons are limited to the six geographies whose government series were extracted (Puerto Rico, Wyoming, Vermont, Alaska, Hawaii, Maine).
Federal government employment is a subset of total government and is not added to the government total. Puerto Rico’s seasonally adjusted construction series begins in 2003. BEA state GDP and personal-income accounts in this catalogue do not include Puerto Rico, so no output or income comparison is offered.
Observation dates are reference months, not release dates. Figures are descriptive. They do not estimate the fiscal, electoral or legal effects of statehood.
Research completed 2026-10-18, for the October 17, 2026 news edition. The available source data may cover earlier periods; see the observation periods and source vintages above.