Research
The $5.85 gallon hits a workforce that already shrank
The people who buy diesel for a living
Diesel set a U.S. record of $5.85 a gallon on Friday, AAA said, as the six-month war with Iran snarled fuel through the Strait of Hormuz. Regular gasoline averaged $4.15, never before above $4 on Labor Day. That is the holiday-weekend story. The quieter one is who pays first. Households can cancel a trip. Freight cannot. Diesel powers the trucks that restock produce, the trains and boats behind them, and a lot of the backup generators nobody thinks about until the lights flicker. Grocers already warn that fuel is 15 to 30 percent of food cost. Amazon, UPS, FedEx and the Postal Service have added surcharges. (AP)
The catalogue behind this article does not include pump prices. It does include the official payrolls of the industries that burn the stuff. As of July 2026, in the Bureau of Labor Statistics snapshot dated August 24, truck transportation employed 1.47 million people on a seasonally adjusted basis. Warehousing and storage employed 1.83 million. Couriers and messengers, the last mile of the same diesel economy, employed 1.10 million. The whole transportation-and-warehousing supersector stood at 6.60 million, about 4.9 percent of private employment. Trucking alone is just 1.1 percent of the private payroll. It is a thin line holding up a fat grocery aisle. (BLS Current Employment Statistics)
Those are establishment jobs, not unique drivers, and they are not a diesel invoice. They are the official count of who shows up when the fuel surcharge lands. If the $5.85 gallon is going to show up as fewer loads, shorter hours, or thinner pay, this is the workforce where it would print.
Warehouses now employ more people than the truck lines do

View exact chart values
| industry | jobs_thousands |
|---|---|
| Warehousing and storage | 1834.6 |
| Food manufacturing | 1764.3 |
| Truck transportation | 1465.1 |
| Couriers and messengers | 1098 |
| Air transportation | 568.4 |
| Transit and ground passenger | 494.4 |
| Rail transportation | 149.3 |
The shrinkage started before the war
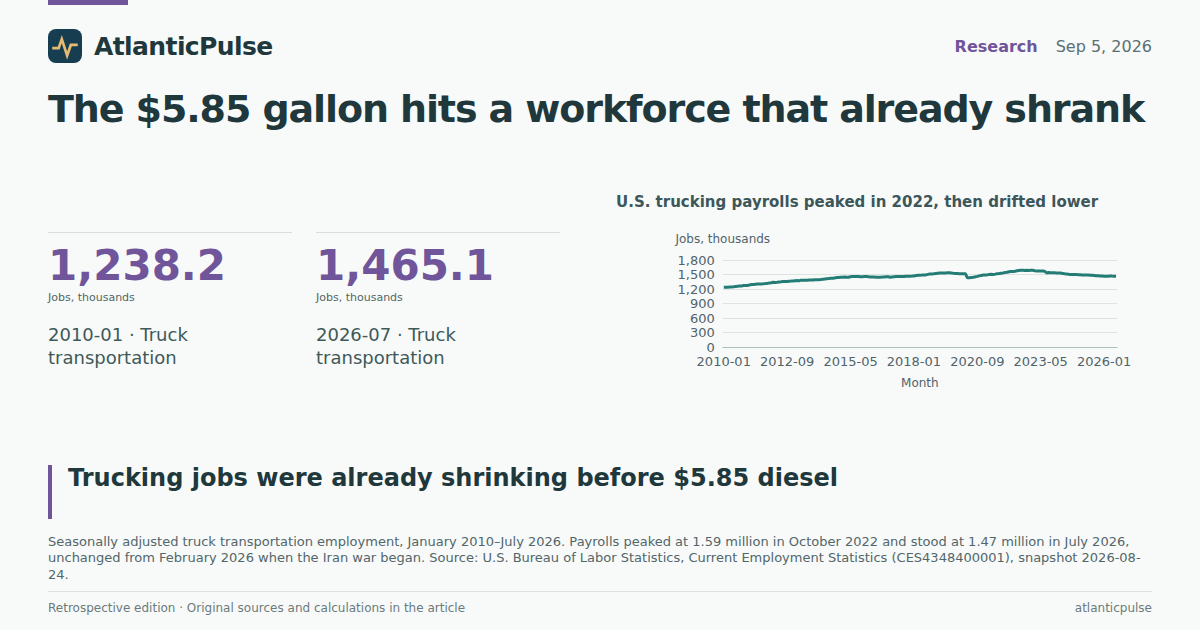
Trucking did not walk into this energy shock at a peak. Seasonally adjusted payrolls rose from 1.24 million in early 2010 to a high of 1.59 million in October 2022, slumped in the first pandemic spring, then recovered and overshot. From that 2022 high they have been drifting down. By July 2026 they were 1.465 million, 7.8 percent below the peak and 3.3 percent below January 2020. Year over year they were down 1.2 percent from July 2025. That is not a collapse. It is a long, unshowy erosion, the sort of chart that never makes a campaign ad and still changes who can afford to keep a truck on the road.
Warehousing tells a different story. Those jobs are 40 percent above January 2020, a monument to e-commerce and inventory buffering, and they still outnumber trucking. They have cooled too: July 2026 was 1.9 percent below July 2025. Food manufacturing, the cargo that diesel keeps cold, slipped 0.9 percent between February and July 2026 and 1.1 percent year over year. Rail, which also burns diesel, employed 149,300 in July. Transit and ground passenger transportation, including a lot of diesel buses, employed 494,400.
None of this proves the Iran war shrank the trucking payroll. The decline was already in the books. What the official series can say is narrower and more useful: when diesel hit a record, the industry that buys it was not hiring its way through the shock. It was, at best, treading water.
U.S. trucking payrolls peaked in 2022, then drifted lower

View exact chart values
| month | jobs_thousands |
|---|---|
| 2010-01 | 1238.2 |
| 2010-02 | 1236.4 |
| 2010-03 | 1234.7 |
| 2010-04 | 1238.9 |
| 2010-05 | 1243.4 |
| 2010-06 | 1245.5 |
| 2010-07 | 1251.3 |
| 2010-08 | 1256.5 |
| 2010-09 | 1259.5 |
| 2010-10 | 1264.7 |
| 2010-11 | 1271 |
| 2010-12 | 1272.9 |
| 2011-01 | 1273 |
| 2011-02 | 1283.8 |
| 2011-03 | 1290.4 |
| 2011-04 | 1295.8 |
| 2011-05 | 1298.6 |
| 2011-06 | 1303.7 |
| 2011-07 | 1304.5 |
| 2011-08 | 1304.6 |
| 2011-09 | 1308.5 |
| 2011-10 | 1312.5 |
| 2011-11 | 1316.2 |
| 2011-12 | 1323.3 |
| 2012-01 | 1328.2 |
| 2012-02 | 1339.7 |
| 2012-03 | 1337.5 |
| 2012-04 | 1339.1 |
| 2012-05 | 1344.4 |
| 2012-06 | 1349.6 |
| 2012-07 | 1355.2 |
| 2012-08 | 1357.6 |
| 2012-09 | 1356.2 |
| 2012-10 | 1361.4 |
| 2012-11 | 1363 |
| 2012-12 | 1367.4 |
| 2013-01 | 1372.5 |
| 2013-02 | 1376 |
| 2013-03 | 1367 |
| 2013-04 | 1382.8 |
| 2013-05 | 1382.8 |
| 2013-06 | 1380.7 |
| 2013-07 | 1382.9 |
| 2013-08 | 1385.2 |
| 2013-09 | 1387.2 |
| 2013-10 | 1389 |
| 2013-11 | 1391.6 |
| 2013-12 | 1392 |
| 2014-01 | 1392.3 |
| 2014-02 | 1394.4 |
| 2014-03 | 1401 |
| 2014-04 | 1405.8 |
| 2014-05 | 1411.6 |
| 2014-06 | 1416 |
| 2014-07 | 1420.4 |
| 2014-08 | 1423.3 |
| 2014-09 | 1429.5 |
| 2014-10 | 1435.4 |
| 2014-11 | 1435.5 |
| 2014-12 | 1442.5 |
| 2015-01 | 1443.9 |
| 2015-02 | 1448.6 |
| 2015-03 | 1443.8 |
| 2015-04 | 1443.1 |
| 2015-05 | 1452.2 |
| 2015-06 | 1460 |
| 2015-07 | 1461.5 |
| 2015-08 | 1460.5 |
| 2015-09 | 1458 |
| 2015-10 | 1452.9 |
| 2015-11 | 1455.1 |
| 2015-12 | 1455.7 |
| 2016-01 | 1456.3 |
| 2016-02 | 1454 |
| 2016-03 | 1449.8 |
| 2016-04 | 1447.7 |
| 2016-05 | 1446.7 |
| 2016-06 | 1442.7 |
| 2016-07 | 1441.8 |
| 2016-08 | 1445 |
| 2016-09 | 1445.2 |
| 2016-10 | 1450.6 |
| 2016-11 | 1452.5 |
| 2016-12 | 1451.5 |
| 2017-01 | 1445.1 |
| 2017-02 | 1448.8 |
| 2017-03 | 1452 |
| 2017-04 | 1456.9 |
| 2017-05 | 1455.7 |
| 2017-06 | 1457.2 |
| 2017-07 | 1458.5 |
| 2017-08 | 1459 |
| 2017-09 | 1462.3 |
| 2017-10 | 1463.5 |
| 2017-11 | 1462.9 |
| 2017-12 | 1466.2 |
| 2018-01 | 1470.6 |
| 2018-02 | 1477.2 |
| 2018-03 | 1486.5 |
| 2018-04 | 1484 |
| 2018-05 | 1488.3 |
| 2018-06 | 1491.6 |
| 2018-07 | 1492.1 |
| 2018-08 | 1502.9 |
| 2018-09 | 1509.5 |
| 2018-10 | 1511.1 |
| 2018-11 | 1515.1 |
| 2018-12 | 1520.7 |
| 2019-01 | 1526 |
| 2019-02 | 1530.3 |
| 2019-03 | 1531 |
| 2019-04 | 1532.4 |
| 2019-05 | 1532.8 |
| 2019-06 | 1534.7 |
| 2019-07 | 1534.5 |
| 2019-08 | 1529.4 |
| 2019-09 | 1524.6 |
| 2019-10 | 1523.7 |
| 2019-11 | 1520.9 |
| 2019-12 | 1516.9 |
| 2020-01 | 1515.8 |
| 2020-02 | 1516.8 |
| 2020-03 | 1516.2 |
| 2020-04 | 1431.6 |
| 2020-05 | 1433.5 |
| 2020-06 | 1439.1 |
| 2020-07 | 1444 |
| 2020-08 | 1453.3 |
| 2020-09 | 1461.5 |
| 2020-10 | 1471.8 |
| 2020-11 | 1481 |
| 2020-12 | 1487.7 |
| 2021-01 | 1489 |
| 2021-02 | 1492.4 |
| 2021-03 | 1502.6 |
| 2021-04 | 1504.9 |
| 2021-05 | 1501 |
| 2021-06 | 1508.8 |
| 2021-07 | 1515.6 |
| 2021-08 | 1521.2 |
| 2021-09 | 1527.3 |
| 2021-10 | 1533.9 |
| 2021-11 | 1541.6 |
| 2021-12 | 1546.5 |
| 2022-01 | 1557.5 |
| 2022-02 | 1564.7 |
| 2022-03 | 1561.3 |
| 2022-04 | 1567 |
| 2022-05 | 1577.2 |
| 2022-06 | 1582.7 |
| 2022-07 | 1587.4 |
| 2022-08 | 1588.3 |
| 2022-09 | 1582.2 |
| 2022-10 | 1588.6 |
| 2022-11 | 1585.4 |
| 2022-12 | 1587.5 |
| 2023-01 | 1587.8 |
| 2023-02 | 1579.5 |
| 2023-03 | 1575 |
| 2023-04 | 1573.7 |
| 2023-05 | 1574.4 |
| 2023-06 | 1571.5 |
| 2023-07 | 1565.8 |
| 2023-08 | 1533.1 |
| 2023-09 | 1539.1 |
| 2023-10 | 1537 |
| 2023-11 | 1536.3 |
| 2023-12 | 1535.5 |
| 2024-01 | 1532 |
| 2024-02 | 1530.2 |
| 2024-03 | 1529.2 |
| 2024-04 | 1523.6 |
| 2024-05 | 1515.1 |
| 2024-06 | 1511.6 |
| 2024-07 | 1505.7 |
| 2024-08 | 1502.3 |
| 2024-09 | 1501.3 |
| 2024-10 | 1497.7 |
| 2024-11 | 1497.1 |
| 2024-12 | 1494.8 |
| 2025-01 | 1493.1 |
| 2025-02 | 1487.6 |
| 2025-03 | 1491.4 |
| 2025-04 | 1490.6 |
| 2025-05 | 1487.7 |
| 2025-06 | 1482.7 |
| 2025-07 | 1482.5 |
| 2025-08 | 1480.2 |
| 2025-09 | 1472.3 |
| 2025-10 | 1472.6 |
| 2025-11 | 1467.8 |
| 2025-12 | 1467.2 |
| 2026-01 | 1465.6 |
| 2026-02 | 1465.1 |
| 2026-03 | 1464.3 |
| 2026-04 | 1469.4 |
| 2026-05 | 1467.7 |
| 2026-06 | 1465 |
| 2026-07 | 1465.1 |
Five months of war, a flat trucking line
U.S. and Israeli attacks on Iran began February 28, 2026. CES does not have an August 2026 print in this snapshot, so the clean window is February through July. Truck transportation jobs were 1,465,100 in February and 1,465,100 in July. That is not rounding poetry. It is the same number. Warehousing added 3,500 jobs, 0.2 percent. The broader transportation-and-warehousing supersector rose 63,600, or 1.0 percent, almost entirely because couriers jumped 61,600, or 5.9 percent. Total private employment rose 0.35 percent over the same span, to 135.6 million.
Index the series to February 2026 and the picture is almost rude in its calm. Trucking sits on 100. Warehousing wobbles around 100. Food manufacturing drifts to 99. Total private edges up to 100.4. Couriers spike, which is a reminder that last-mile vans and long-haul tractors are not the same labor market even when they share a fuel type. If diesel was already crushing freight demand in the first five months of the war, it had not yet shown up as a trucking-payroll collapse. Hours are the other place it could hide.
Average weekly hours in trucking were 41.1 in February and 40.7 in June, the last month the trucking hours series printed in this extract. Private hours were 34.3 in both months. Truckers still work a much longer week. They did not, in this window, pick up extra overtime to offset $5 diesel. They slightly cut it. July 2026 hours for trucking are missing here and are omitted, not treated as zero. That gap matters: a missing month is not evidence that hours crashed.
Since the Iran war started, trucking jobs have not grown

View exact chart values
| month | truck | warehousing | couriers | food_manufacturing | total_private |
|---|---|---|---|---|---|
| 2025-01 | 101.91 | 102.74 | 105.49 | 99.96 | 99.7 |
| 2025-02 | 101.54 | 102.86 | 108.06 | 99.98 | 99.73 |
| 2025-03 | 101.8 | 102.71 | 106.16 | 100.11 | 99.78 |
| 2025-04 | 101.74 | 102.74 | 103.5 | 100.21 | 99.85 |
| 2025-05 | 101.54 | 102.41 | 104.19 | 100.32 | 99.87 |
| 2025-06 | 101.2 | 102.23 | 104.93 | 100.26 | 99.83 |
| 2025-07 | 101.19 | 102.09 | 105.39 | 100.28 | 99.88 |
| 2025-08 | 101.03 | 102.09 | 105.81 | 100.29 | 99.87 |
| 2025-09 | 100.49 | 101.22 | 104.83 | 100.24 | 99.92 |
| 2025-10 | 100.51 | 100.48 | 105.88 | 100.29 | 99.93 |
| 2025-11 | 100.18 | 100.6 | 100.68 | 100.07 | 99.98 |
| 2025-12 | 100.14 | 100.28 | 101.39 | 100.02 | 99.98 |
| 2026-01 | 100.03 | 99.96 | 104.25 | 100.02 | 100.11 |
| 2026-02 | 100 | 100 | 100 | 100 | 100 |
| 2026-03 | 99.95 | 100.08 | 102.26 | 99.91 | 100.15 |
| 2026-04 | 100.29 | 100.34 | 105.81 | 99.94 | 100.26 |
| 2026-05 | 100.18 | 100.58 | 105.58 | 99.55 | 100.31 |
| 2026-06 | 99.99 | 100.71 | 104.51 | 99.47 | 100.33 |
| 2026-07 | 100 | 100.19 | 105.94 | 99.12 | 100.35 |
They earn less per hour, more per week
The White House spent Friday celebrating 162,000 August jobs and complaining that wage growth of 3.1 percent was being read as an inflation problem. In trucking, the pay story is older than the war. Average hourly earnings of all trucking employees were $33.16 in February 2026 and $33.46 in June, still $4.14 below the private-sector $37.60. A year earlier, in June 2025, trucking paid $32.11 an hour. That is a 4.2 percent raise, a bit faster than the private 3.4 percent. It is not a catch-up. The gap has been a few dollars an hour for the entire 2015–2026 span of this extract.
Hours flip the comparison. Multiply the published hourly rate by the published weekly hours and trucking paid about $1,362 a week in June 2026 against $1,290 for all private jobs, a $72 premium. In February the weekly premium was $85. Drivers are not rich on an hourly basis. They are paid for a long week in a job that got shorter, slightly, as diesel rose. That weekly figure is a calculation from two CES series, not a separate BLS weekly-earnings release, and it inherits both series' rounding.
Inflation-adjusted hourly pay is the unkindest chart. In 1982–84 dollars, trucking earned $10.13 in February and $10.06 in June. The private sector earned $11.38 and $11.31. Real truck wages are essentially where they were in 2020. They are not where a record diesel bill would want them. October 2025 is missing for trucking real earnings in this extract; the line skips it. Real private hourly pay was $11.30 in July 2026, down 0.7 percent from February. The catalogue does not let us put a diesel gallon next to those dollars. It does let us say the people who will pay the $5.85 first have not been getting a real raise to match it.
Truck pay rose, but it still trails the private-sector average

View exact chart values
| month | truck_dollars | total_private_dollars |
|---|---|---|
| 2015-01 | 22.54 | 24.74 |
| 2015-02 | 22.47 | 24.79 |
| 2015-03 | 22.47 | 24.85 |
| 2015-04 | 22.37 | 24.89 |
| 2015-05 | 22.54 | 24.97 |
| 2015-06 | 22.34 | 24.97 |
| 2015-07 | 22.46 | 25.01 |
| 2015-08 | 22.41 | 25.1 |
| 2015-09 | 22.42 | 25.11 |
| 2015-10 | 22.49 | 25.2 |
| 2015-11 | 22.55 | 25.25 |
| 2015-12 | 22.59 | 25.25 |
| 2016-01 | 22.75 | 25.37 |
| 2016-02 | 22.69 | 25.38 |
| 2016-03 | 22.75 | 25.45 |
| 2016-04 | 22.8 | 25.53 |
| 2016-05 | 22.72 | 25.58 |
| 2016-06 | 22.77 | 25.62 |
| 2016-07 | 22.74 | 25.69 |
| 2016-08 | 22.66 | 25.71 |
| 2016-09 | 22.73 | 25.77 |
| 2016-10 | 22.69 | 25.9 |
| 2016-11 | 22.78 | 25.9 |
| 2016-12 | 22.81 | 25.93 |
| 2017-01 | 22.88 | 26 |
| 2017-02 | 22.97 | 26.07 |
| 2017-03 | 23.05 | 26.11 |
| 2017-04 | 23.16 | 26.18 |
| 2017-05 | 23.26 | 26.21 |
| 2017-06 | 23.46 | 26.26 |
| 2017-07 | 23.47 | 26.35 |
| 2017-08 | 23.57 | 26.37 |
| 2017-09 | 23.64 | 26.49 |
| 2017-10 | 23.74 | 26.5 |
| 2017-11 | 23.73 | 26.54 |
| 2017-12 | 23.72 | 26.63 |
| 2018-01 | 23.78 | 26.72 |
| 2018-02 | 23.98 | 26.74 |
| 2018-03 | 24.09 | 26.85 |
| 2018-04 | 24.12 | 26.91 |
| 2018-05 | 24.17 | 26.98 |
| 2018-06 | 24.26 | 27.03 |
| 2018-07 | 24.33 | 27.1 |
| 2018-08 | 24.46 | 27.21 |
| 2018-09 | 24.53 | 27.32 |
| 2018-10 | 24.6 | 27.37 |
| 2018-11 | 24.66 | 27.44 |
| 2018-12 | 24.82 | 27.56 |
| 2019-01 | 24.84 | 27.59 |
| 2019-02 | 24.89 | 27.69 |
| 2019-03 | 24.92 | 27.77 |
| 2019-04 | 25.05 | 27.79 |
| 2019-05 | 25.22 | 27.88 |
| 2019-06 | 25.19 | 27.97 |
| 2019-07 | 25.38 | 28.03 |
| 2019-08 | 25.41 | 28.14 |
| 2019-09 | 25.48 | 28.16 |
| 2019-10 | 25.54 | 28.24 |
| 2019-11 | 25.69 | 28.34 |
| 2019-12 | 25.77 | 28.38 |
| 2020-01 | 25.95 | 28.43 |
| 2020-02 | 26.02 | 28.54 |
| 2020-03 | 26.08 | 28.73 |
| 2020-04 | 26.23 | 30.04 |
| 2020-05 | 26.12 | 29.72 |
| 2020-06 | 25.99 | 29.38 |
| 2020-07 | 26.22 | 29.39 |
| 2020-08 | 26.34 | 29.49 |
| 2020-09 | 26.5 | 29.51 |
| 2020-10 | 26.96 | 29.54 |
| 2020-11 | 27.02 | 29.64 |
| 2020-12 | 27.2 | 29.91 |
| 2021-01 | 26.84 | 29.93 |
| 2021-02 | 26.59 | 30.05 |
| 2021-03 | 26.71 | 30.03 |
| 2021-04 | 26.73 | 30.22 |
| 2021-05 | 27.06 | 30.41 |
| 2021-06 | 27.35 | 30.54 |
| 2021-07 | 27.55 | 30.66 |
| 2021-08 | 27.61 | 30.78 |
| 2021-09 | 27.73 | 30.98 |
| 2021-10 | 27.73 | 31.14 |
| 2021-11 | 27.74 | 31.23 |
| 2021-12 | 27.89 | 31.39 |
| 2022-01 | 28.12 | 31.6 |
| 2022-02 | 28.43 | 31.64 |
| 2022-03 | 28.55 | 31.8 |
| 2022-04 | 28.69 | 31.96 |
| 2022-05 | 29.3 | 32.1 |
| 2022-06 | 29.03 | 32.19 |
| 2022-07 | 29.09 | 32.34 |
| 2022-08 | 29.43 | 32.44 |
| 2022-09 | 29.87 | 32.57 |
| 2022-10 | 29.63 | 32.7 |
| 2022-11 | 29.83 | 32.82 |
| 2022-12 | 29.72 | 32.94 |
| 2023-01 | 29.93 | 33.02 |
| 2023-02 | 30.11 | 33.15 |
| 2023-03 | 30.03 | 33.27 |
| 2023-04 | 30.54 | 33.43 |
| 2023-05 | 30.71 | 33.5 |
| 2023-06 | 30.87 | 33.69 |
| 2023-07 | 30.96 | 33.85 |
| 2023-08 | 30.63 | 33.89 |
| 2023-09 | 30.59 | 34.01 |
| 2023-10 | 30.71 | 34.08 |
| 2023-11 | 30.69 | 34.17 |
| 2023-12 | 30.89 | 34.29 |
| 2024-01 | 31.02 | 34.47 |
| 2024-02 | 30.95 | 34.52 |
| 2024-03 | 31.12 | 34.65 |
| 2024-04 | 31.23 | 34.76 |
| 2024-05 | 31.26 | 34.89 |
| 2024-06 | 31.33 | 35.01 |
| 2024-07 | 31.38 | 35.08 |
| 2024-08 | 31.31 | 35.22 |
| 2024-09 | 31.38 | 35.34 |
| 2024-10 | 31.4 | 35.46 |
| 2024-11 | 31.58 | 35.6 |
| 2024-12 | 31.71 | 35.69 |
| 2025-01 | 31.75 | 35.84 |
| 2025-02 | 31.91 | 35.94 |
| 2025-03 | 31.93 | 36.11 |
| 2025-04 | 32.14 | 36.12 |
| 2025-05 | 32.08 | 36.28 |
| 2025-06 | 32.11 | 36.36 |
| 2025-07 | 32.21 | 36.47 |
| 2025-08 | 32.41 | 36.62 |
| 2025-09 | 32.67 | 36.7 |
| 2025-10 | 32.84 | 36.85 |
| 2025-11 | 32.96 | 37 |
| 2025-12 | 33.2 | 37.02 |
| 2026-01 | 33.15 | 37.15 |
| 2026-02 | 33.16 | 37.27 |
| 2026-03 | 33.25 | 37.35 |
| 2026-04 | 33.34 | 37.41 |
| 2026-05 | 33.38 | 37.49 |
| 2026-06 | 33.46 | 37.6 |
Inflation-adjusted truck wages have not broken out

View exact chart values
| month | truck_1982_84_dollars | total_private_1982_84_dollars |
|---|---|---|
| 2015-01 | 9.6 | 10.54 |
| 2015-02 | 9.55 | 10.53 |
| 2015-03 | 9.52 | 10.53 |
| 2015-04 | 9.47 | 10.54 |
| 2015-05 | 9.51 | 10.54 |
| 2015-06 | 9.4 | 10.51 |
| 2015-07 | 9.44 | 10.51 |
| 2015-08 | 9.41 | 10.54 |
| 2015-09 | 9.44 | 10.57 |
| 2015-10 | 9.46 | 10.6 |
| 2015-11 | 9.47 | 10.61 |
| 2015-12 | 9.5 | 10.62 |
| 2016-01 | 9.57 | 10.68 |
| 2016-02 | 9.56 | 10.69 |
| 2016-03 | 9.56 | 10.69 |
| 2016-04 | 9.54 | 10.68 |
| 2016-05 | 9.48 | 10.68 |
| 2016-06 | 9.48 | 10.67 |
| 2016-07 | 9.47 | 10.7 |
| 2016-08 | 9.42 | 10.69 |
| 2016-09 | 9.42 | 10.69 |
| 2016-10 | 9.39 | 10.71 |
| 2016-11 | 9.41 | 10.7 |
| 2016-12 | 9.4 | 10.69 |
| 2017-01 | 9.39 | 10.67 |
| 2017-02 | 9.41 | 10.68 |
| 2017-03 | 9.45 | 10.71 |
| 2017-04 | 9.48 | 10.72 |
| 2017-05 | 9.53 | 10.74 |
| 2017-06 | 9.61 | 10.76 |
| 2017-07 | 9.61 | 10.79 |
| 2017-08 | 9.61 | 10.76 |
| 2017-09 | 9.59 | 10.75 |
| 2017-10 | 9.63 | 10.75 |
| 2017-11 | 9.6 | 10.73 |
| 2017-12 | 9.57 | 10.75 |
| 2018-01 | 9.56 | 10.74 |
| 2018-02 | 9.61 | 10.72 |
| 2018-03 | 9.65 | 10.76 |
| 2018-04 | 9.64 | 10.75 |
| 2018-05 | 9.64 | 10.76 |
| 2018-06 | 9.66 | 10.77 |
| 2018-07 | 9.68 | 10.79 |
| 2018-08 | 9.72 | 10.81 |
| 2018-09 | 9.73 | 10.83 |
| 2018-10 | 9.73 | 10.83 |
| 2018-11 | 9.76 | 10.86 |
| 2018-12 | 9.82 | 10.9 |
| 2019-01 | 9.84 | 10.92 |
| 2019-02 | 9.83 | 10.93 |
| 2019-03 | 9.8 | 10.92 |
| 2019-04 | 9.81 | 10.89 |
| 2019-05 | 9.88 | 10.92 |
| 2019-06 | 9.87 | 10.96 |
| 2019-07 | 9.92 | 10.96 |
| 2019-08 | 9.92 | 10.99 |
| 2019-09 | 9.94 | 10.98 |
| 2019-10 | 9.93 | 10.98 |
| 2019-11 | 9.96 | 10.99 |
| 2019-12 | 9.96 | 10.97 |
| 2020-01 | 10.01 | 10.97 |
| 2020-02 | 10.04 | 11.01 |
| 2020-03 | 10.11 | 11.13 |
| 2020-04 | 10.24 | 11.73 |
| 2020-05 | 10.21 | 11.62 |
| 2020-06 | 10.11 | 11.43 |
| 2020-07 | 10.15 | 11.38 |
| 2020-08 | 10.16 | 11.37 |
| 2020-09 | 10.19 | 11.35 |
| 2020-10 | 10.36 | 11.35 |
| 2020-11 | 10.36 | 11.36 |
| 2020-12 | 10.38 | 11.41 |
| 2021-01 | 10.22 | 11.39 |
| 2021-02 | 10.09 | 11.4 |
| 2021-03 | 10.08 | 11.33 |
| 2021-04 | 10.03 | 11.33 |
| 2021-05 | 10.08 | 11.33 |
| 2021-06 | 10.11 | 11.28 |
| 2021-07 | 10.13 | 11.28 |
| 2021-08 | 10.13 | 11.29 |
| 2021-09 | 10.12 | 11.31 |
| 2021-10 | 10.03 | 11.26 |
| 2021-11 | 9.95 | 11.2 |
| 2021-12 | 9.93 | 11.18 |
| 2022-01 | 9.95 | 11.18 |
| 2022-02 | 9.99 | 11.12 |
| 2022-03 | 9.92 | 11.05 |
| 2022-04 | 9.94 | 11.08 |
| 2022-05 | 10.06 | 11.02 |
| 2022-06 | 9.84 | 10.91 |
| 2022-07 | 9.86 | 10.97 |
| 2022-08 | 9.97 | 10.99 |
| 2022-09 | 10.08 | 10.99 |
| 2022-10 | 9.94 | 10.97 |
| 2022-11 | 9.98 | 10.98 |
| 2022-12 | 9.95 | 11.02 |
| 2023-01 | 9.96 | 10.99 |
| 2023-02 | 9.99 | 11 |
| 2023-03 | 9.95 | 11.02 |
| 2023-04 | 10.08 | 11.04 |
| 2023-05 | 10.12 | 11.04 |
| 2023-06 | 10.15 | 11.08 |
| 2023-07 | 10.16 | 11.11 |
| 2023-08 | 10.01 | 11.07 |
| 2023-09 | 9.96 | 11.07 |
| 2023-10 | 9.98 | 11.08 |
| 2023-11 | 9.96 | 11.09 |
| 2023-12 | 10.01 | 11.11 |
| 2024-01 | 10.02 | 11.13 |
| 2024-02 | 9.95 | 11.1 |
| 2024-03 | 9.96 | 11.09 |
| 2024-04 | 9.98 | 11.1 |
| 2024-05 | 9.98 | 11.14 |
| 2024-06 | 10.01 | 11.18 |
| 2024-07 | 10.01 | 11.19 |
| 2024-08 | 9.97 | 11.21 |
| 2024-09 | 9.97 | 11.23 |
| 2024-10 | 9.95 | 11.23 |
| 2024-11 | 9.98 | 11.25 |
| 2024-12 | 9.98 | 11.24 |
| 2025-01 | 9.95 | 11.24 |
| 2025-02 | 9.98 | 11.24 |
| 2025-03 | 9.98 | 11.29 |
| 2025-04 | 10.03 | 11.28 |
| 2025-05 | 10.01 | 11.32 |
| 2025-06 | 9.99 | 11.31 |
| 2025-07 | 10 | 11.32 |
| 2025-08 | 10.03 | 11.33 |
| 2025-09 | 10.08 | 11.32 |
| 2025-11 | 10.14 | 11.38 |
| 2025-12 | 10.18 | 11.35 |
| 2026-01 | 10.15 | 11.38 |
| 2026-02 | 10.13 | 11.38 |
| 2026-03 | 10.07 | 11.31 |
| 2026-04 | 10.03 | 11.25 |
| 2026-05 | 9.99 | 11.23 |
| 2026-06 | 10.06 | 11.31 |
What a record pump price cannot tell you yet
CES is a monthly survey of employers. It will not show, in July, a Friday in September when AAA printed $5.85. It will not show owner-operators who are not on a payroll. It will not show fuel surcharges already baked into a grocery price, or the farm equipment that also drinks diesel. It is silent on whether a 1.2 percent year-over-year drop in trucking jobs is drivers leaving, firms failing to replace retirees, or freight simply slowing. Those are different stories with the same headcount.
What it can do is put a scale on the warning. About 1.5 million payroll jobs sit in truck transportation. Another 1.8 million sit in warehouses. Food factories, which need the trucks, employ 1.76 million and have been edging down. The private economy as a whole was still adding jobs through July. Trucking was not. If diesel stays expensive, the next prints to watch are hours and real pay, not a speech about 15 percent GDP. The people who move the groceries were already working a long week for an hourly rate that still trails everyone else. A record gallon does not make that week shorter in a good way.
Sources and methods
This is retrospective enrichment using the pinned BLS Current Employment Statistics snapshot dated 2026-08-24 (normalized run 2026-08-24T10-07-20Z), not an as-known-on-2026-09-05 reconstruction. Research was compiled on 2026-09-11. Later CES revisions may differ.
Edition date for the accompanying digest is 2026-09-05. Observation window for employment series is January 2010 through July 2026, monthly, seasonally adjusted, United States. Truck transportation average hourly earnings, weekly hours, and 1982–84-dollar earnings end in June 2026 in this extract (198 monthly rows versus 199 for most employment series). Refrigerated warehousing also lacks July 2026. Missing months were skipped and were not treated as zero.
Series are CES establishment payrolls in thousands of jobs, not unique persons and not owner-operators. Average hourly earnings are for all employees. Real earnings are BLS 1982–84 dollars. Weekly pay in the text is the product of published hourly earnings and published weekly hours, rounded, not a separate CES weekly-earnings series.
February 2026 is used as the start of the Iran-war window because reporting places the U.S. and Israeli attacks on February 28, 2026. Indexing to that month is a descriptive comparison, not a causal estimate of the war or of diesel prices. The catalogue does not include diesel or gasoline prices; pump-price figures in the article come from the day's reporting.
Duplicate period keys, if any, kept the first observation. Null values were not filled. Components of transportation and warehousing were not summed to rebuild the supersector, which is taken from its own CES series. Food manufacturing is a separate industry shown because reporting tied diesel to grocery costs; it is not part of transportation and warehousing.
Research completed 2026-09-11, for the September 5, 2026 news edition. This is retrospective analysis, not a reconstruction of information available that day.