Research
The 47% grocery-and-rent squeeze is a household survey. The national accounts tell a clinic story.
Two books, two halves
A Consumer Expenditure Survey released on 29 October found that in 2025 the average American household spent $27,790 on housing and $10,633 on food. Together those two bills took 46.9% of a $81,905 budget, the largest combined share in about 15 years. Housing’s share, 33.9%, was the highest since 2010 aside from the pandemic jump; food’s 13.0% was the highest since 2011. That is the number walking into Tuesday’s midterms: rent, the mortgage, the grocery cart.
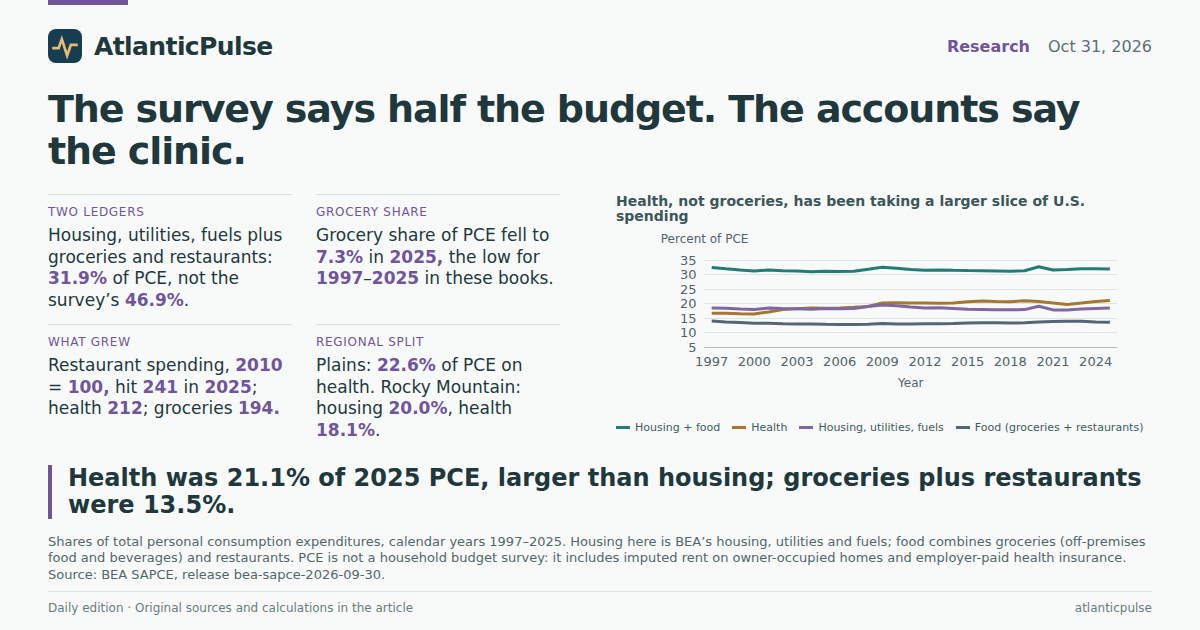
The national accounts keep a different ledger. In the Bureau of Economic Analysis’s personal consumption expenditures by state, calendar 2025 U.S. spending was $20.87 trillion. Housing, utilities and fuels were 18.41% of that total. Groceries — food and beverages bought for off-premises consumption — were 7.30%, a low for the 1997–2025 series. Restaurants added 6.20%. Combine those three categories and you get 31.92% of PCE, not 46.9%. The combined housing-and-food share peaked in this series in 2020, at 32.64%, not last year.
The gap is not a rounding error. It is a definition. The survey is a household budget: what consumer units report spending, with housing defined the CES way (shelter, utilities, furnishings, household operations). PCE is an economy-wide consumption total. It includes the imputed rental value of owner-occupied homes, so a paid-off house still generates a large “housing” line. It also includes employer-paid health insurance and other spending that never hits a checking account. Neither book is fake. They are answering different questions. The survey asks what pinched last year’s paycheck. The accounts ask which categories swallowed a larger slice of everything America consumed.
Health, not groceries, has been taking a larger slice of U.S. spending

View exact chart values
| year | housing_utils_fuels_share | food_total_share | food_home_share | food_services_share | health_share | housing_plus_food_share |
|---|---|---|---|---|---|---|
| 1997 | 18.48 | 13.97 | 8.57 | 5.39 | 16.61 | 32.44 |
| 1998 | 18.33 | 13.65 | 8.29 | 5.35 | 16.67 | 31.97 |
| 1999 | 18.07 | 13.46 | 8.2 | 5.26 | 16.44 | 31.53 |
| 2000 | 17.95 | 13.22 | 7.99 | 5.23 | 16.4 | 31.16 |
| 2001 | 18.42 | 13.17 | 7.97 | 5.2 | 17.1 | 31.59 |
| 2002 | 18.29 | 13.04 | 7.82 | 5.21 | 17.92 | 31.32 |
| 2003 | 18.2 | 12.97 | 7.75 | 5.23 | 18.22 | 31.17 |
| 2004 | 18.05 | 12.93 | 7.68 | 5.25 | 18.4 | 30.98 |
| 2005 | 18.27 | 12.84 | 7.62 | 5.22 | 18.39 | 31.12 |
| 2006 | 18.21 | 12.79 | 7.55 | 5.24 | 18.49 | 31 |
| 2007 | 18.32 | 12.79 | 7.57 | 5.23 | 18.71 | 31.11 |
| 2008 | 18.93 | 12.87 | 7.65 | 5.21 | 19 | 31.8 |
| 2009 | 19.44 | 13.07 | 7.81 | 5.26 | 20.21 | 32.52 |
| 2010 | 19.22 | 12.9 | 7.67 | 5.23 | 20.25 | 32.13 |
| 2011 | 18.79 | 12.93 | 7.66 | 5.27 | 20.13 | 31.72 |
| 2012 | 18.46 | 13.01 | 7.66 | 5.35 | 20.19 | 31.47 |
| 2013 | 18.54 | 13.03 | 7.64 | 5.39 | 20.07 | 31.57 |
| 2014 | 18.31 | 13.13 | 7.67 | 5.46 | 20.17 | 31.44 |
| 2015 | 18.03 | 13.32 | 7.66 | 5.66 | 20.62 | 31.35 |
| 2016 | 17.97 | 13.35 | 7.62 | 5.73 | 20.84 | 31.32 |
| 2017 | 17.84 | 13.35 | 7.6 | 5.75 | 20.66 | 31.19 |
| 2018 | 17.83 | 13.26 | 7.49 | 5.77 | 20.58 | 31.09 |
| 2019 | 17.91 | 13.35 | 7.5 | 5.85 | 20.97 | 31.26 |
| 2020 | 19.03 | 13.62 | 8.44 | 5.17 | 20.69 | 32.64 |
| 2021 | 17.79 | 13.75 | 8.01 | 5.73 | 20.2 | 31.54 |
| 2022 | 17.81 | 13.9 | 7.89 | 6.01 | 19.69 | 31.71 |
| 2023 | 18.12 | 13.89 | 7.66 | 6.23 | 20.18 | 32.01 |
| 2024 | 18.29 | 13.67 | 7.46 | 6.21 | 20.69 | 31.96 |
| 2025 | 18.41 | 13.5 | 7.3 | 6.2 | 21.07 | 31.92 |
The bill that actually grew
If you index the dollar totals to 2010, the hierarchy is blunt. Restaurant spending in 2025 was 241 on that scale. Health was 211.6. All PCE was 203.4. Housing, utilities and fuels were 194.8. Groceries were 193.7. In current dollars, eating out and medical care outran the grocery aisle and the housing line. That does not mean groceries got cheaper; it means they did not outgrow the rest of consumption the way restaurants and clinics did.
Health’s share of PCE is the series high in these books: 21.07% in 2025, up from 16.4% in 2000 and 20.25% in 2010. It overtook housing, utilities and fuels years ago and stayed there. Food’s combined share, 13.50%, is below 1997’s 13.97%. Grocery share alone fell from 8.57% in 1997 to 7.30% in 2025. Restaurant share drifted up, from 5.39% to 6.20%, which is why the CES finding that households still spent more on food away from home in 2025 than the year before can sit beside a falling grocery share of PCE. People paid more at restaurants. They did not, on these books, devote a record slice of national consumption to the supermarket.
None of this is an inflation adjustment. The indexes are nominal. A 241 restaurant index is a pile of current-dollar checks, not a claim that Americans ate 141% more meals out. It is still the right comparison for a political argument about which bill “took over” the budget. In the accounts, the expanding necessity is health. Housing is large and sticky. Groceries are smaller as a share than they were in the late 1990s.
Restaurant bills outran the grocery cart; health outran housing

View exact chart values
| year | housing_utils_fuels_index | food_home_index | food_services_index | health_index | total_pce_index |
|---|---|---|---|---|---|
| 2010 | 100 | 100 | 100 | 100 | 100 |
| 2011 | 101.9 | 104.2 | 105 | 103.6 | 104.3 |
| 2012 | 103.4 | 107.5 | 110.1 | 107.3 | 107.7 |
| 2013 | 107.1 | 110.6 | 114.2 | 110 | 111 |
| 2014 | 110.2 | 115.7 | 120.8 | 115.3 | 115.7 |
| 2015 | 112.4 | 119.7 | 129.5 | 122 | 119.9 |
| 2016 | 116 | 123.2 | 135.7 | 127.6 | 124 |
| 2017 | 120.2 | 128.4 | 142.2 | 132.1 | 129.5 |
| 2018 | 125.9 | 132.7 | 149.7 | 138 | 135.8 |
| 2019 | 131.1 | 137.7 | 157.3 | 145.7 | 140.7 |
| 2020 | 137.3 | 152.7 | 137 | 141.7 | 138.7 |
| 2021 | 145.4 | 164.1 | 172 | 156.6 | 157.1 |
| 2022 | 159.6 | 177.2 | 197.9 | 167.4 | 172.2 |
| 2023 | 172.4 | 182.8 | 217.8 | 182.3 | 183 |
| 2024 | 183.8 | 187.9 | 229.2 | 197.3 | 193.2 |
| 2025 | 194.8 | 193.7 | 241 | 211.6 | 203.4 |
A $4.4 trillion clinic, a $3.8 trillion house
Slice 2025 PCE and the ranking is the same in dollars. Health: $4.40 trillion, 21.1%. Housing, utilities and fuels: $3.84 trillion, 18.4%. Groceries plus restaurants: $2.82 trillion, 13.5%. Everything else — cars, clothes, recreation, financial services, the rest — is 47.0%, or $9.81 trillion. That “everything else” is why a household survey can feel like half the budget is rent and food while the accounts still show a majority of consumption going to other things, including a medical sector bigger than shelter.
The CES housing line is also broader than BEA’s housing-utilities-fuels function. Furnishings and some household operations sit in the survey’s housing category and elsewhere in PCE. Owner-occupied imputed rent inflates the BEA housing total relative to a renter’s cash outlay and can shrink housing’s share of a survey budget for owners who already paid the mortgage. Crosswalks are messy. The usable conclusion is narrower: if the campaign trail treats 46.9% as a national-accounts fact, it is mixing ledgers.
In the national accounts, health is a bigger 2025 bill than housing

View exact chart values
| category | share_pct | billions |
|---|---|---|
| Housing, utilities and fuels | 18.41 | 3843 |
| Health | 21.07 | 4396.8 |
| Food at home and restaurants | 13.5 | 2818.2 |
| All other PCE | 47.02 | 9812.3 |
The map is not one squeeze
The regional books, still 2025, still PCE, split the country the way a midterm map might. Grocery share here is off-premises food only — not restaurants — so it is not comparable to the national food-total figure. Even so, the pattern is consistent. The Plains devoted 22.60% of PCE to health and 16.31% to housing, utilities and fuels, the lowest housing share of the eight BEA regions. The Mideast (22.41% health) and Great Lakes (22.39%) sat in the same clinic-heavy cluster. Rocky Mountain reversed it: 19.97% housing, the highest, and 18.09% health, the lowest. It is the only region in this extract where housing-utilities-fuels outspent health.
Far West and Southeast sit in the middle-high housing band, around 19.2–19.3%, with health still larger than groceries. Southeast groceries, 7.78%, were the highest regional grocery share; the Mideast’s 6.57% was the lowest. None of those grocery shares look like a 13% CES food line, because restaurants are missing and because PCE is not a household average. They do show that the supermarket is not the regional outlier. Health is, in the middle of the country. Housing is, in the mountain West.
That is a different midterm story than “housing and food took half.” It is closer to the other household complaint in this week’s reporting: insurance premiums, deductibles, the clinic. It does not refute anyone’s grocery receipt. It says the official consumption machine has been shifting weight onto medical care for a quarter-century, and that in 2025 that shift was still visible in every region except the one where housing already takes the larger slice.
Where health still outspends housing \u2014 and where it does not

View exact chart values
| region | health_share_pct | housing_share_pct | grocery_share_pct |
|---|---|---|---|
| Plains | 22.6 | 16.31 | 7.16 |
| Mideast | 22.41 | 17.87 | 6.57 |
| Great Lakes | 22.39 | 16.7 | 7.27 |
| Southeast | 21.26 | 19.29 | 7.78 |
| New England | 20.86 | 18.1 | 6.88 |
| Southwest | 19.88 | 18.84 | 7.63 |
| Far West | 19.72 | 19.19 | 7.27 |
| Rocky Mountain | 18.09 | 19.97 | 7.46 |
A housing-heavy West, a clinic-heavy Midwest

View exact chart values
| region | pce_billions | housing_share_pct | grocery_share_pct | health_share_pct | housing_plus_groceries_pct |
|---|---|---|---|---|---|
| New England | 1100.7 | 18.1 | 6.88 | 20.86 | 24.97 |
| Mideast | 3380.3 | 17.87 | 6.57 | 22.41 | 24.45 |
| Great Lakes | 2769.8 | 16.7 | 7.27 | 22.39 | 23.97 |
| Plains | 1256 | 16.31 | 7.16 | 22.6 | 23.47 |
| Southeast | 5138.4 | 19.29 | 7.78 | 21.26 | 27.07 |
| Southwest | 2522.1 | 18.84 | 7.63 | 19.88 | 26.47 |
| Rocky Mountain | 812.1 | 19.97 | 7.46 | 18.09 | 27.43 |
| Far West | 3877.4 | 19.19 | 7.27 | 19.72 | 26.46 |
Sources and methods
BEA Personal Consumption Expenditures by State (SAPCE table SAPCE4, function), vintage bea-sapce-2026-09-30, snapshot created 2026-10-07. Calendar years 1997–2025 for the United States; calendar 2025 only for eight BEA regions. Figures are millions of current dollars, not inflation-adjusted, not per household, and not seasonally adjusted.
Housing is the function “Housing, utilities, and fuels,” which includes imputed rental of owner-occupied housing. Food at the national level is off-premises food and beverages plus food services (restaurants), excluding accommodations. Regional grocery shares are off-premises food and beverages only. Health is the function “Health,” which includes employer-paid insurance in PCE. Denominator is total PCE, not household consumption expenditures alone.
These series are not the Consumer Expenditure Survey. CES 46.9% is a survey of consumer-unit budgets reported in 31 October coverage and is cited as such; it is not recalculated here. Shares are arithmetic (category ÷ total PCE × 100). Indexes use 2010 current-dollar totals = 100. Nulls were not treated as zero; all extracted U.S. and regional observations in these windows were non-null. No causal inference.
Research completed 2026-11-01, for the October 31, 2026 news edition. The available source data may cover earlier periods; see the observation periods and source vintages above.