Research
The $40 trillion headline is not the whole debt story
Two different $40 trillions
On August 18, 2026, the Treasury’s debt clock ticked past $40 trillion in gross federal debt. That is a cash-register number: every Treasury bill, note and bond outstanding, plus the IOUs the government owes its own trust funds. It is not a ratio, it is not internationally comparable, and it is not the same object economists use when they ask whether a country has borrowed “too much.”
The IMF World Economic Outlook tracks something else: general-government gross debt as a share of GDP. That series folds in federal, state and local government on a national-accounts basis, then scales the stock to the size of the economy. In 2024, the latest year treated here as historical, that ratio was 122.3 percent of GDP, or about $35.8 trillion of general-government debt against $29.3 trillion of GDP. The 2026 WEO projection for the same stock is $40.7 trillion — a rhyme with Treasury’s print, not a match. Mixing the two is how a round number becomes a wrong story.
A ratio that jumped twice and never came home
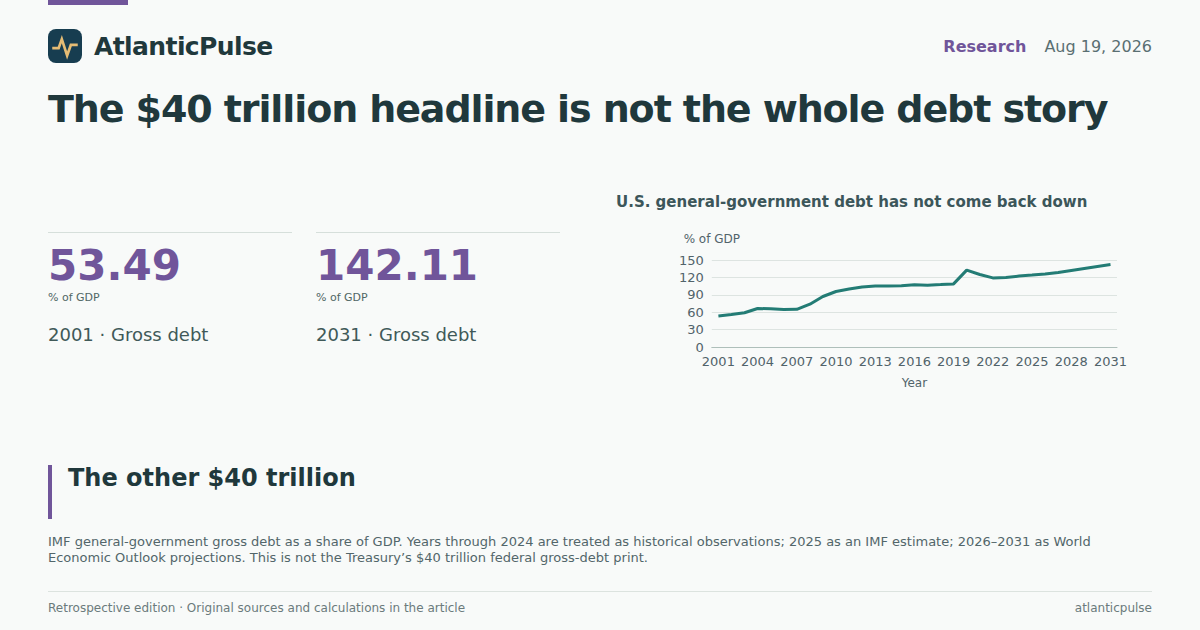
In 2001, U.S. general-government gross debt was 53.5 percent of GDP. It crossed 100 percent in 2011, after the financial crisis, and was 108.8 percent in 2019. Then the pandemic did in one year what the previous decade had done in ten: the ratio jumped to 132.6 percent in 2020. It eased as nominal GDP recovered, to 119.1 percent in 2022, and then started climbing again. By 2024 it was 122.3 percent.
The WEO path does not bend down. The 2025 estimate is 123.9 percent. The 2031 projection is 142.1 percent — above the 2020 peak. Net debt, which subtracts financial assets, was still 95.7 percent of GDP in 2024. Readers who remember the postwar 106 percent public-debt record cited in this week’s coverage are looking at a different series; on the IMF’s general-government yardstick, the United States has been above 100 percent of GDP for more than a decade.
U.S. general-government debt has not come back down

View exact chart values
| year | debt_pct_gdp | status |
|---|---|---|
| 2001 | 53.49 | historical |
| 2002 | 55.86 | historical |
| 2003 | 58.96 | historical |
| 2004 | 66.44 | historical |
| 2005 | 65.78 | historical |
| 2006 | 64.53 | historical |
| 2007 | 64.95 | historical |
| 2008 | 73.84 | historical |
| 2009 | 87.07 | historical |
| 2010 | 95.65 | historical |
| 2011 | 100.03 | historical |
| 2012 | 103.67 | historical |
| 2013 | 105.01 | historical |
| 2014 | 104.94 | historical |
| 2015 | 105.44 | historical |
| 2016 | 107.41 | historical |
| 2017 | 106.4 | historical |
| 2018 | 107.65 | historical |
| 2019 | 108.78 | historical |
| 2020 | 132.55 | historical |
| 2021 | 125.05 | historical |
| 2022 | 119.15 | historical |
| 2023 | 119.96 | historical |
| 2024 | 122.27 | historical |
| 2025 | 123.89 | estimate |
| 2026 | 125.78 | projection |
| 2027 | 128.58 | projection |
| 2028 | 132.13 | projection |
| 2029 | 135.53 | projection |
| 2030 | 138.9 | projection |
| 2031 | 142.11 | projection |
The flow that feeds the stock
Debt ratios rise when governments spend more than they collect, when interest compounds, and when the economy grows slowly relative to both. The WEO’s flow numbers are blunt. In 2024, general-government revenue was 29.9 percent of GDP and expenditure 37.7 percent, leaving a deficit of 7.9 percent of GDP. That is not a pandemic leftover. The 2020 deficit was 14.1 percent; 2022 briefly compressed to 3.7 percent as inflation padded receipts; 2023 and 2024 reopened the gap to nearly 8 percent.
The primary balance — the deficit excluding interest, identified here by the IMF code GGXONLB rather than a swapped catalogue label — was still a 4.4 percent-of-GDP hole in 2024. In other words, even if interest had been zero, the government was not covering its non-interest bills. The WEO’s 2026–2031 projections keep the headline deficit in a 7.4–7.6 percent band. Revenue stays near 30–31 percent of GDP; expenditure stays near 38 percent. There is no projected return to the 2–3 percent gaps of the mid-2000s expansion.
The gap is on the spending side, and it never really closed

View exact chart values
| year | status | revenue_pct_gdp | expenditure_pct_gdp | net_lending_pct_gdp | deficit_pct_gdp | primary_net_lending_pct_gdp |
|---|---|---|---|---|---|---|
| 2001 | historical | 32.26 | 32.8 | -0.54 | 0.54 | 1.77 |
| 2002 | historical | 29.88 | 33.7 | -3.82 | 3.82 | -1.72 |
| 2003 | historical | 29.27 | 34.04 | -4.77 | 4.77 | -2.81 |
| 2004 | historical | 29.48 | 33.72 | -4.24 | 4.24 | -2.35 |
| 2005 | historical | 30.85 | 33.93 | -3.07 | 3.07 | -1.08 |
| 2006 | historical | 31.66 | 33.69 | -2.04 | 2.04 | -0.07 |
| 2007 | historical | 31.65 | 34.56 | -2.91 | 2.91 | -0.85 |
| 2008 | historical | 30.53 | 37.14 | -6.61 | 6.61 | -4.59 |
| 2009 | historical | 28.22 | 41.4 | -13.18 | 13.18 | -11.29 |
| 2010 | historical | 28.77 | 39.76 | -10.99 | 10.99 | -8.97 |
| 2011 | historical | 29.08 | 38.8 | -9.72 | 9.72 | -7.42 |
| 2012 | historical | 29.11 | 37.22 | -8.11 | 8.11 | -5.9 |
| 2013 | historical | 31.22 | 35.78 | -4.56 | 4.56 | -2.58 |
| 2014 | historical | 31.3 | 35.32 | -4.03 | 4.03 | -2.06 |
| 2015 | historical | 31.5 | 35.03 | -3.53 | 3.53 | -1.69 |
| 2016 | historical | 30.98 | 35.33 | -4.36 | 4.36 | -2.37 |
| 2017 | historical | 30.4 | 35.19 | -4.79 | 4.79 | -2.78 |
| 2018 | historical | 30.01 | 35.35 | -5.33 | 5.33 | -3.1 |
| 2019 | historical | 30.01 | 35.82 | -5.81 | 5.81 | -3.53 |
| 2020 | historical | 30.61 | 44.74 | -14.13 | 14.13 | -12.08 |
| 2021 | historical | 31.76 | 43.22 | -11.46 | 11.46 | -9.19 |
| 2022 | historical | 33.08 | 36.8 | -3.72 | 3.72 | -0.99 |
| 2023 | historical | 29.62 | 37.51 | -7.89 | 7.89 | -4.76 |
| 2024 | historical | 29.88 | 37.74 | -7.86 | 7.86 | -4.37 |
| 2025 | estimate | 30.88 | 37.7 | -6.82 | 6.82 | -3.17 |
| 2026 | projection | 30.44 | 37.94 | -7.5 | 7.5 | -3.67 |
| 2027 | projection | 30.53 | 37.9 | -7.37 | 7.37 | -3.52 |
| 2028 | projection | 30.38 | 37.98 | -7.59 | 7.59 | -3.66 |
| 2029 | projection | 30.4 | 37.85 | -7.45 | 7.45 | -3.37 |
| 2030 | projection | 30.65 | 38.11 | -7.47 | 7.47 | -3.27 |
| 2031 | projection | 30.76 | 38.15 | -7.39 | 7.39 | -3.08 |
How America ranks
Among eight large economies with complete 2024 observations, the United States is not the most indebted. Japan’s general-government gross debt was 214.5 percent of GDP; Italy’s was 134.7 percent. France was 113.2 percent, Canada 110.0 percent, the United Kingdom 99.9 percent, China 90.4 percent, Germany 62.2 percent. America sits in the upper half of that list, not at the extreme.
The flow is the more uncomfortable comparison. In 2024 the U.S. general-government deficit was 7.9 percent of GDP, the widest in this group. China was next at 7.1 percent. The United Kingdom ran 6.1 percent, France 5.8 percent, Italy 3.4 percent, Germany 2.7 percent, Canada 2.1 percent, Japan 1.7 percent. Japan carries a huge stock and a small gap. The United States carries a large stock and a large gap at the same time. That combination is what bond investors mean when they talk about a stock that does not stabilize.
Indexed to 2019, China’s ratio has risen fastest — from 59.8 percent of GDP to 90.4 percent in 2024, with the WEO taking it above 125 percent by 2031. The U.S. index is up 12 percent over the same historical span, and the projection keeps climbing. Germany remains the low-debt large economy in this set. None of these comparisons imply that one country’s institutions, currency or investor base is interchangeable with another’s. They do show that the American fiscal position is no longer the conservative outlier in the rich world.
On a comparable yardstick, America already sits with the high-debt club

View exact chart values
| country | gross_debt_pct_gdp_2024 |
|---|---|
| Germany | 62.2 |
| China | 90.4 |
| United Kingdom | 99.9 |
| Canada | 110 |
| France | 113.2 |
| United States | 122.3 |
| Italy | 134.7 |
| Japan | 214.5 |
High debt is common. A 8-percent-of-GDP deficit is not

View exact chart values
| country | gross_debt_pct_gdp_2024 | deficit_pct_gdp_2024 | net_lending_pct_gdp_2024 |
|---|---|---|---|
| United States | 122.3 | 7.86 | -7.86 |
| Japan | 214.5 | 1.67 | -1.67 |
| Italy | 134.7 | 3.35 | -3.35 |
| France | 113.2 | 5.79 | -5.79 |
| United Kingdom | 99.9 | 6.06 | -6.06 |
| Germany | 62.2 | 2.66 | -2.66 |
| Canada | 110 | 2.12 | -2.12 |
| China | 90.4 | 7.11 | -7.11 |
The interest wedge
Subtract the primary balance from the headline balance and the residual is implied interest, as a share of GDP. It is an accounting identity from two IMF series, not the Treasury’s net-interest outlay, and it covers general government rather than the federal budget alone. It is still the cleanest interest picture this catalogue can support.
That residual sat near 2 percent of GDP for most of the 2010s, when yields were suppressed. It was 2.7 percent in 2022, 3.1 percent in 2023 and 3.5 percent in 2024. The WEO path takes it to 3.8 percent in 2026 and 4.3 percent in 2031. Meanwhile the primary deficit shrinks only modestly. The headline gap stays wide because the interest line is doing more of the work — the same arithmetic that this week’s reporting compressed into “interest now exceeds defense,” a comparison the IMF series here cannot make and that this article does not claim.
The reader payoff is narrower, and more useful. The $40 trillion Treasury print is a milestone, not a ratio. On the measure that can be compared across countries, the United States is already in the high-debt group, still running one of the largest deficits, and watching the interest wedge widen. The WEO does not forecast a turn. Anyone waiting for the debt ratio to fall back to the pre-2008 world is waiting for a vintage that is no longer in the book.
The interest wedge is the part that keeps growing

View exact chart values
| year | status | headline_deficit_pct_gdp | primary_deficit_pct_gdp | implied_interest_pct_gdp |
|---|---|---|---|---|
| 2001 | historical | 0.54 | -1.77 | 2.31 |
| 2002 | historical | 3.82 | 1.72 | 2.1 |
| 2003 | historical | 4.77 | 2.81 | 1.96 |
| 2004 | historical | 4.24 | 2.35 | 1.89 |
| 2005 | historical | 3.07 | 1.08 | 1.99 |
| 2006 | historical | 2.04 | 0.07 | 1.96 |
| 2007 | historical | 2.91 | 0.85 | 2.07 |
| 2008 | historical | 6.61 | 4.59 | 2.02 |
| 2009 | historical | 13.18 | 11.29 | 1.89 |
| 2010 | historical | 10.99 | 8.97 | 2.03 |
| 2011 | historical | 9.72 | 7.42 | 2.3 |
| 2012 | historical | 8.11 | 5.9 | 2.21 |
| 2013 | historical | 4.56 | 2.58 | 1.98 |
| 2014 | historical | 4.03 | 2.06 | 1.97 |
| 2015 | historical | 3.53 | 1.69 | 1.84 |
| 2016 | historical | 4.36 | 2.37 | 1.98 |
| 2017 | historical | 4.79 | 2.78 | 2.01 |
| 2018 | historical | 5.33 | 3.1 | 2.23 |
| 2019 | historical | 5.81 | 3.53 | 2.28 |
| 2020 | historical | 14.13 | 12.08 | 2.05 |
| 2021 | historical | 11.46 | 9.19 | 2.27 |
| 2022 | historical | 3.72 | 0.99 | 2.73 |
| 2023 | historical | 7.89 | 4.76 | 3.13 |
| 2024 | historical | 7.86 | 4.37 | 3.49 |
| 2025 | estimate | 6.82 | 3.17 | 3.65 |
| 2026 | projection | 7.5 | 3.67 | 3.83 |
| 2027 | projection | 7.37 | 3.52 | 3.86 |
| 2028 | projection | 7.59 | 3.66 | 3.94 |
| 2029 | projection | 7.45 | 3.37 | 4.08 |
| 2030 | projection | 7.47 | 3.27 | 4.2 |
| 2031 | projection | 7.39 | 3.08 | 4.31 |
Sources and methods
This is retrospective enrichment using a pinned IMF World Economic Outlook snapshot, not an as-known-on-edition-date reconstruction. The AtlanticPulse edition date is 2026-08-19. Research was run on 2026-09-11. The WEO extract snapshot was created 2026-08-24 from a raw run dated 2026-08-10 (run_id 20260810).
Observation dates on the series are annual (stored as January 1 of each year). U.S. general-government debt, net debt, revenue, expenditure, net lending/borrowing and primary net lending cover 2001–2031. GDP in current U.S. dollars covers 1980–2031. Peer debt ratios cover 2001–2031; peer deficits used for the 2024 scatter cover 2019–2026.
Years through 2024 are treated as historical observations; 2025 as an IMF estimate; 2026–2031 as WEO projections. The snapshot does not attach official realized/forecast flags, so that split follows WEO convention for an August 2026 vintage and should be read as a dating rule, not a claim about what was published in each April or October book. Later WEO revisions may already exist.
IMF general-government gross debt is not U.S. Treasury gross federal debt and is not debt held by the public. It includes state and local government on a national-accounts basis. Dollar stocks use the WEO national-currency series (XDC); for the United States those stored units are treated as dollars. Aggregate dollars are not household burdens.
The primary-balance series is IMF code GGXONLB_NGDP (extract usa-gg-primary-onlb). The catalogue display name for that series was swapped with structural balance; the series code was used instead of the display name. Implied interest is the residual (primary net lending minus headline net lending) and is not Treasury net interest. It is not compared with defense spending because no defense-outlay series is in the indexed catalogue.
No duplicate year-geography rows were observed. Missing values were skipped and never treated as zero. Peer comparisons are descriptive. They do not imply that debt ratios cause deficits, that Japan’s stock is a template, or that a 2024 snapshot forecasts a crisis. China, Japan and others have different debt-holder structures, which this dataset does not show.
Research completed 2026-09-11, for the August 19, 2026 news edition. This is retrospective analysis, not a reconstruction of information available that day.
- IMF World Economic Outlook: Source 1