Research
The 3.4% quarter had not shown up yet. The two-speed map already had.
A strong print, and a slower map underneath
Thursday's Commerce Department snapshot told voters the economy grew at a 3.4% annualized pace in the third quarter, the fastest in a year, while the Federal Reserve's preferred inflation gauge hit 3.6%. That is the number campaigns will argue about. It is not the number on the last official state books. Those books, published by the Bureau of Economic Analysis in its 30 September 2026 regional release, stop at 2026 Q2. They measure something quieter and more useful for a midterm week: whether the expansion was already broad, or already lopsided, before the advance estimate arrived.
In those Q2 accounts, U.S. real GDP was $24.41 trillion at a seasonally adjusted annual rate, in chained 2017 dollars. That was 2.19% above 2025 Q2 — a year-over-year change in the level, not the annualized quarter-to-quarter rate in Thursday's print. The two figures are not rivals; they are different cameras. The Q2 camera is the one that can still be sliced by state and industry. It shows an economy that was growing, just not the way a 3.4% headline sounds, and not in the places where Trump and Obama were spending the week.
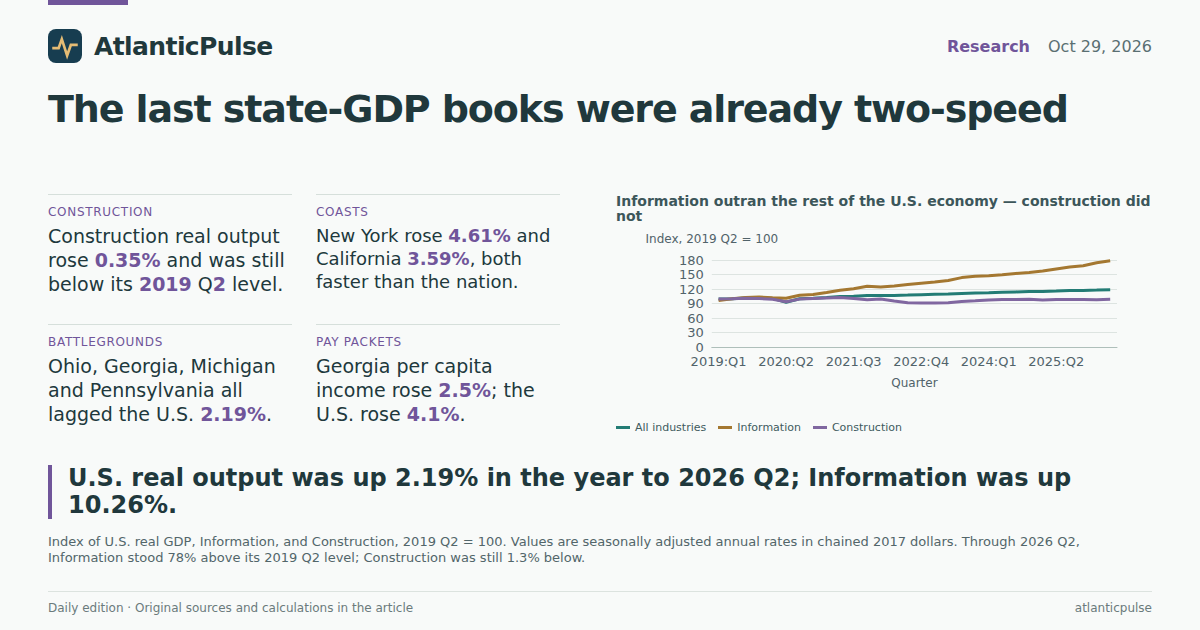
The split inside that 2.19% is the story. Real output in Information — software publishing, data processing, telecom, streaming, the industrial park behind every AI earnings call — was up 10.26% from a year earlier, to about $2.09 trillion. Construction, the sector that actually pours the slabs for those data centers and still builds the houses voters cannot afford, was up 0.35%. Indexed to 2019 Q2, Information stood at 178. Construction was still at 99. The rest of the economy sat in between, at 118.
Information outran the rest of the U.S. economy — construction did not

View exact chart values
| quarter | gdp_index_2019q2 | info_index_2019q2 | construction_index_2019q2 |
|---|---|---|---|
| 2019:Q1 | 99.17 | 96.2 | 99.52 |
| 2019:Q2 | 100 | 100 | 100 |
| 2019:Q3 | 101.17 | 102.39 | 100.69 |
| 2019:Q4 | 101.86 | 103.25 | 100.13 |
| 2020:Q1 | 100.52 | 101.88 | 98.7 |
| 2020:Q2 | 92.6 | 101.06 | 93.72 |
| 2020:Q3 | 99.79 | 107.07 | 99.08 |
| 2020:Q4 | 100.92 | 108.51 | 100.29 |
| 2021:Q1 | 102.45 | 112.67 | 101.44 |
| 2021:Q2 | 104.23 | 117.58 | 102.38 |
| 2021:Q3 | 105.05 | 120.53 | 100.46 |
| 2021:Q4 | 106.79 | 125.72 | 97.84 |
| 2022:Q1 | 106.52 | 124.11 | 99.09 |
| 2022:Q2 | 106.67 | 126.38 | 95.06 |
| 2022:Q3 | 107.39 | 129.16 | 91.55 |
| 2022:Q4 | 108.11 | 131.72 | 91.11 |
| 2023:Q1 | 109 | 134.31 | 91.06 |
| 2023:Q2 | 109.59 | 137.67 | 91.73 |
| 2023:Q3 | 110.81 | 143.5 | 94.43 |
| 2023:Q4 | 111.8 | 146.39 | 95.8 |
| 2024:Q1 | 112.2 | 147.56 | 97.36 |
| 2024:Q2 | 113.19 | 149.47 | 98.13 |
| 2024:Q3 | 114.07 | 152.09 | 98.41 |
| 2024:Q4 | 114.75 | 154.06 | 98.61 |
| 2025:Q1 | 114.79 | 157.07 | 97.25 |
| 2025:Q2 | 115.93 | 161.67 | 98.35 |
| 2025:Q3 | 117.04 | 165.79 | 98.26 |
| 2025:Q4 | 117.1 | 168.12 | 98.04 |
| 2026:Q1 | 117.82 | 174.4 | 97.91 |
| 2026:Q2 | 118.47 | 178.26 | 98.7 |
Most of the states on the trail were already slower
Line up the states that have spent October as political scenery and the ranking is unkind to the idea of a uniform boom. Among the states in this extract, New York led with 4.61% real GDP growth in the year to 2026 Q2. California followed at 3.59%, Florida at 3.02%. The United States as a whole was 2.19%. Then the map that actually votes in toss-ups: North Carolina 2.07%, Georgia 1.93%, Ohio 1.89%, Michigan 1.87%, Texas 1.69%, Pennsylvania 1.30%, Indiana 1.16%. Virginia, home to a large share of the East Coast's data-center build, managed 1.04%. Alaska, whose Senate race the White House has been trying to litigate in advance, was slightly smaller than a year earlier, at -0.32%.
Those are not forecasts and they are not Thursday's 3.4%. They are the last complete official reading of how much each state's economy produced, adjusted for inflation in BEA's chained 2017 dollars, before the midterm. A 1.9% Ohio year is still growth. It is also a reminder that a national print can be pulled by a handful of large coastal accounts. New York and California together added more real output, in dollars, than Ohio, Georgia, Michigan and Pennsylvania combined. If you lived in Chillicothe, you were not imaginary. You were just not where the extra $ was being booked.
Before the 3.4% print, most midterm states were already growing slower than the nation

View exact chart values
| state | yoy_pct | gdp_2026q2_chained2017_mil | gdp_2025q2_chained2017_mil |
|---|---|---|---|
| Alaska | -0.32 | 56159.6 | 56342.4 |
| Virginia | 1.04 | 639147.7 | 632572.7 |
| Indiana | 1.16 | 426705.8 | 421822.1 |
| Wisconsin | 1.21 | 367898.2 | 363516.9 |
| Pennsylvania | 1.3 | 825662.6 | 815056.4 |
| Arizona | 1.56 | 457896.5 | 450874.4 |
| Nevada | 1.57 | 212577.6 | 209289 |
| Washington | 1.68 | 727417 | 715408.2 |
| Texas | 1.69 | 2376525.1 | 2337094.7 |
| Illinois | 1.81 | 967139.3 | 949926 |
| Michigan | 1.87 | 586515.9 | 575733.2 |
| Ohio | 1.89 | 751813.9 | 737844.6 |
| Georgia | 1.93 | 733586.6 | 719677.6 |
| North Carolina | 2.07 | 695413.8 | 681299 |
| United States | 2.19 | 24408011 | 23884563 |
| South Carolina | 2.57 | 293939.3 | 286577.3 |
| Florida | 3.02 | 1411321.1 | 1369928.7 |
| California | 3.59 | 3515203.1 | 3393430.3 |
| New York | 4.61 | 1962063 | 1875553.6 |
Information ran. It did not always take the state with it.
Zoom into Information and the ranking flips. Virginia's Information real GDP jumped 17.96% in the year to 2026 Q2. New York's rose 15.48%, California's 14.65%, Georgia's 11.54%. The United States: 10.26%. Ohio, despite the ballot fight over data centers, still saw Information output up 9.87% — from a small base, about 4% of the state's chained-dollar total. Washington state is the exception that proves the hangover: Information is already about a quarter of Washington's real GDP, more than double the national 8.6% indicative share, and it grew only 2.91% over the year. The boom is so large there that it has become the weather. A cloudy quarter still leaves you wet.
Shares calculated in chained dollars are a sketch, not a ledger; BEA warns against adding up real industry totals as if they were current-dollar accounts. The direction is not a sketch. Since 2019 Q2, U.S. Information real output is up 78%. Virginia's is up 118%, Washington's 115%, California's 95%. Georgia's Information sector, for all of Atlanta's film-and-tech branding, is up 29% over the same seven years — a real expansion, and a much slower one.
Put the two growth rates on one scatter and Virginia is the awkward guest. Its Information sector is among the fastest in this set; its total economy is among the slowest. New York managed both. Ohio's Information growth looks healthy on a bar chart and barely moves the state's total, because the sector is still small. That is the local politics of the AI buildout in a sentence: the industry can be booming in your state without your state's GDP, or your electric bill, feeling like the same story.
Virginia’s Information sector surged. Washington’s already-huge one did not.

View exact chart values
| state | yoy_pct | info_2026q2_chained2017_mil | since_2019q2_pct | approx_share_chained_pct |
|---|---|---|---|---|
| Washington | 2.91 | 177178.1 | 114.98 | 24.36 |
| Texas | 9.01 | 137167.2 | 81.12 | 5.77 |
| Ohio | 9.87 | 29603.2 | 61.79 | 3.94 |
| United States | 10.26 | 2089763 | 78.26 | 8.56 |
| Georgia | 11.54 | 68150.5 | 29.41 | 9.29 |
| California | 14.65 | 613779.2 | 94.85 | 17.46 |
| New York | 15.48 | 252249.9 | 62.82 | 12.86 |
| Virginia | 17.96 | 46224.3 | 117.52 | 7.23 |
A fast Information sector did not automatically lift the whole state

View exact chart values
| state | total_yoy_pct | info_yoy_pct | approx_share_chained_pct |
|---|---|---|---|
| United States | 2.19 | 10.26 | 8.56 |
| Virginia | 1.04 | 17.96 | 7.23 |
| New York | 4.61 | 15.48 | 12.86 |
| California | 3.59 | 14.65 | 17.46 |
| Ohio | 1.89 | 9.87 | 3.94 |
| Texas | 1.69 | 9.01 | 5.77 |
| Georgia | 1.93 | 11.54 | 9.29 |
| Washington | 1.68 | 2.91 | 24.36 |
Pay packets, in current dollars, and the states that lagged
Income is what households actually spend at $4 gasoline. BEA's per capita personal income is a current-dollar annual rate, not adjusted for prices, derived from seasonally adjusted income divided by mid-quarter population. In the year to 2026 Q2 it rose 4.08% nationally, to $79,904. New York rose 6.04%, to $96,276. California rose 4.88%. Georgia rose 2.52%, to $66,802. Virginia, despite that Information surge, rose 2.75%. Ohio rose 3.83%.
A 2.5% rise in Georgia's per capita income is not a collapse. It is also not a raise that outruns a later 3.6% national inflation print, and it is not proof that Georgians got poorer in real terms — this series is not deflated, and the inflation gauge is national and a quarter newer. What it does show, without reaching, is that the states hosting Thursday night's dueling rallies were not the ones booking the fattest income gains on the official Q2 books. New York was. The battlegrounds were closer to the slow lane, in output and in the paycheck statistic that is supposed to make 3.4% feel like it happened to you.
None of this says Thursday's 3.4% was fake. Advance GDP can jump in a single quarter when AI equipment and consumer spending both fire, which is what the Commerce Department described. It says the year that produced that jump was already uneven: Information did the sprint, construction jogged in place, and the map of the midterms — Ohio, Georgia, Michigan, Pennsylvania, even data-center Virginia — was growing more slowly than the two giant coastal accounts that pull the national average. Voters who say the boom missed them are not required to be good national accountants. The state books, as of 2026 Q2, were not entirely on the other side.
Georgia’s pay packets lagged the nation’s — in current dollars

View exact chart values
| state | pcpi_2026q2_dollars | pcpi_2025q2_dollars | yoy_pct |
|---|---|---|---|
| Georgia | 66802 | 65157 | 2.52 |
| Virginia | 83144 | 80922 | 2.75 |
| Ohio | 70294 | 67704 | 3.83 |
| Texas | 76003 | 73121 | 3.94 |
| United States | 79904 | 76774 | 4.08 |
| Pennsylvania | 78303 | 75057 | 4.32 |
| Michigan | 70017 | 67042 | 4.44 |
| California | 94506 | 90112 | 4.88 |
| New York | 96276 | 90791 | 6.04 |
Sources and methods
All figures are calculated from the Bureau of Economic Analysis quarterly state GDP (SQGDP9) and personal income (SQINC1) files in the 30 September 2026 regional release, pinned in this catalogue snapshot. Real GDP is in millions of chained 2017 dollars at a seasonally adjusted annual rate, not a realized quarterly total. Per capita personal income is current dollars at an annual rate, derived from seasonally adjusted income and unadjusted mid-quarter population; it is not inflation-adjusted.
Year-over-year changes compare 2026 Q2 with 2025 Q2. They are not comparable to the Commerce Department's 3.4% annualized quarter-to-quarter growth rate for 2026 Q3 published on 29 October 2026. Index series use 2019 Q2 = 100. Indicative Information shares divide chained-dollar industry GDP by chained-dollar all-industry GDP; BEA cautions that chained-dollar components do not add to totals. Alaska's slightly negative reading is a small-economy year-over-year change, not a claim about the Senate race. No causal effect is inferred from the comparisons. Observation dates are not release dates; 2026 Q3 state GDP is not in this vintage.
Research completed 2026-10-30, for the October 29, 2026 news edition. The available source data may cover earlier periods; see the observation periods and source vintages above.