Research
The 3.4% boom, and the shrinking paycheck inside it
A strong print, and a series that does not go back to 1947
The Commerce Department’s first look at third-quarter 2026 GDP gave Washington a talking point on the eve of the midterms: the economy expanded at a 3.4% annualized rate, consumer spending rose 3.8%, and business equipment investment surged 20.9%. The same week, a Fortune headline said U.S. workers had just taken home their smallest share of capital since 1947. Those two sentences can both be true and still talk past each other. The quarterly print is a growth rate. The labor-share claim is a split of the pie. This article asks a narrower, checkable question: in the official BEA GDP-by-state accounts, has compensation of employees already been losing ground to gross operating surplus?
Those accounts do not run back to 1947. The SAGDP1 table in the Bureau’s September 30, 2026 annual release starts in calendar 1997 and ends in calendar 2025. It is not the third-quarter 2026 national GDP report, and it is not the Bureau of Labor Statistics labor share of nonfarm business income. What it does offer is a clean three-way split of current-dollar GDP: compensation of employees, gross operating surplus, and taxes on production and imports less subsidies. Compensation is wages, salaries and employer supplements. Gross operating surplus is broader than “profits”: BEA defines it as business income including consumption of fixed capital, proprietors’ income, corporate profits and net business current transfer payments. Treat it as a surplus bucket, not a CEO bonus.
Across 29 years, the identity holds. Compensation plus surplus plus taxes-less-subsidies matches published current-dollar GDP within $4 million, rounding noise on a $30 trillion pie. That is the right kind of boring. It means the shares below are accounting, not a model.
Compensation is still most of GDP. It is a smaller most than it used to be.
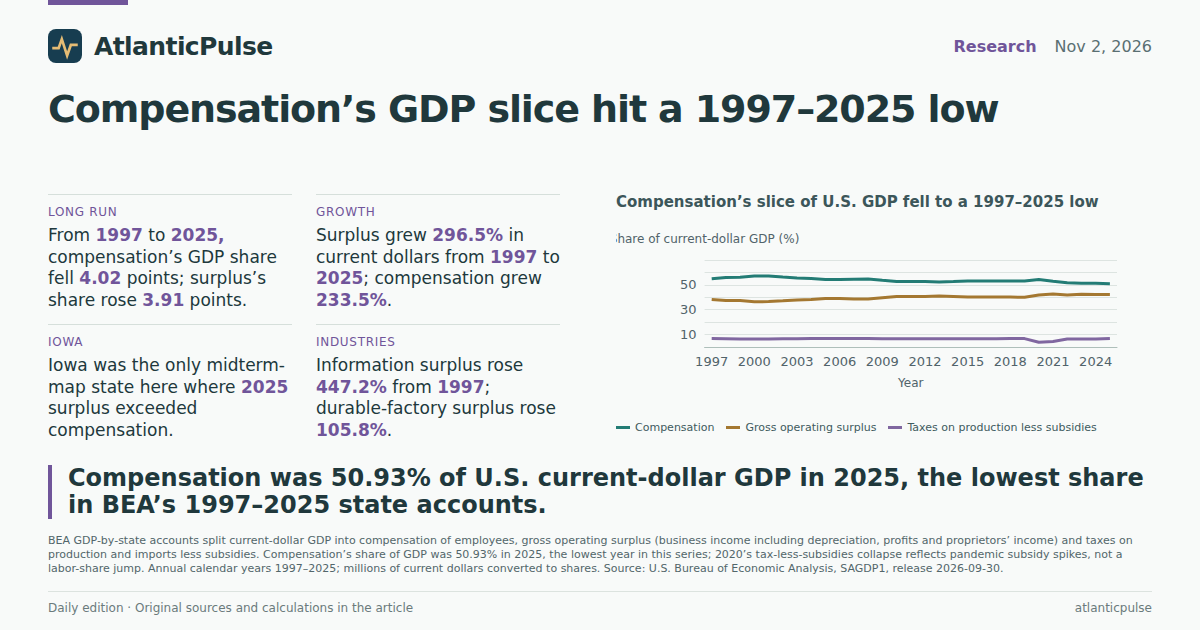
In 2025, U.S. current-dollar GDP in these accounts was $30.861 trillion. Compensation was $15.719 trillion, or 50.93% of GDP. Gross operating surplus was $13.031 trillion, or 42.23%. Taxes on production less subsidies were $2.111 trillion, or 6.84%. That compensation share is the lowest year in the 1997–2025 series. The peak was 57.14% in 2001. In 1997, compensation was 54.95% and surplus 38.32%. From 1997 to 2025, compensation’s slice shrank 4.02 percentage points; surplus’s slice rose 3.91 points.
The levels still grew. Compensation is up 233.5% from 1997, GDP 259.8%, surplus 296.5%. Indexed to 1997=100, surplus is at 396.5, GDP at 359.8, compensation at 333.5. Paychecks got bigger. The surplus bucket got bigger faster. A two-factor split that ignores taxes tells the same story: compensation was 58.92% of compensation-plus-surplus in 1997 and 54.67% in 2025, also the series low.
Two years need a footnote. In 2020, taxes less subsidies collapsed to 3.85% of GDP because subsidies exploded; compensation’s GDP share bounced to 54.30% that year even as its share of compensation-plus-surplus kept falling. In 2021, surplus’s GDP share hit its series high, 42.53%. Neither year is a clean midterm analog. The 2025 reading is. It is the year before this week’s 3.4% print, and it is the low for compensation in this book.
Compensation’s slice of U.S. GDP fell to a 1997–2025 low

View exact chart values
| year | compensation_mn | gos_mn | gdp_mn | topi_less_subsidies_mn | identity_gap_mn | comp_share_gdp_pct | gos_share_gdp_pct | topi_share_gdp_pct | comp_of_comp_plus_gos_pct | gos_of_comp_plus_gos_pct | comp_index_1997 | gos_index_1997 | gdp_index_1997 |
|---|---|---|---|---|---|---|---|---|---|---|---|---|---|
| 1997 | 4713220 | 3286528 | 8577552 | 577804 | 0 | 54.95 | 38.32 | 6.74 | 58.92 | 41.08 | 100 | 100 | 100 |
| 1998 | 5075701 | 3384009 | 9062817 | 603105 | 2 | 56.01 | 37.34 | 6.65 | 60 | 40 | 107.7 | 103 | 105.7 |
| 1999 | 5409932 | 3592861 | 9631172 | 628376 | 3 | 56.17 | 37.3 | 6.52 | 60.09 | 39.91 | 114.8 | 109.3 | 112.3 |
| 2000 | 5854629 | 3733603 | 10250952 | 662716 | 4 | 57.11 | 36.42 | 6.46 | 61.06 | 38.94 | 124.2 | 113.6 | 119.5 |
| 2001 | 6046343 | 3866608 | 10581929 | 668980 | -2 | 57.14 | 36.54 | 6.32 | 60.99 | 39.01 | 128.3 | 117.7 | 123.4 |
| 2002 | 6143368 | 4067108 | 10929108 | 718634 | -2 | 56.21 | 37.21 | 6.58 | 60.17 | 39.83 | 130.3 | 123.8 | 127.4 |
| 2003 | 6362296 | 4337596 | 11456450 | 756559 | -1 | 55.53 | 37.86 | 6.6 | 59.46 | 40.54 | 135 | 132 | 133.6 |
| 2004 | 6729301 | 4666186 | 12217196 | 821711 | -2 | 55.08 | 38.19 | 6.73 | 59.05 | 40.95 | 142.8 | 142 | 142.4 |
| 2005 | 7077721 | 5079951 | 13039197 | 881527 | -2 | 54.28 | 38.96 | 6.76 | 58.22 | 41.78 | 150.2 | 154.6 | 152 |
| 2006 | 7491255 | 5378760 | 13815583 | 945572 | -4 | 54.22 | 38.93 | 6.84 | 58.21 | 41.79 | 158.9 | 163.7 | 161.1 |
| 2007 | 7889369 | 5602614 | 14474228 | 982245 | 0 | 54.51 | 38.71 | 6.79 | 58.47 | 41.53 | 167.4 | 170.5 | 168.7 |
| 2008 | 8068679 | 5703999 | 14769862 | 997183 | 1 | 54.63 | 38.62 | 6.75 | 58.58 | 41.42 | 171.2 | 173.6 | 172.2 |
| 2009 | 7767191 | 5742406 | 14478067 | 968470 | 0 | 53.65 | 39.66 | 6.69 | 57.49 | 42.51 | 164.8 | 174.7 | 168.8 |
| 2010 | 7932969 | 6108737 | 15048971 | 1007265 | 0 | 52.71 | 40.59 | 6.69 | 56.5 | 43.5 | 168.3 | 185.9 | 175.4 |
| 2011 | 8234013 | 6322003 | 15599732 | 1043716 | 0 | 52.78 | 40.53 | 6.69 | 56.57 | 43.43 | 174.7 | 192.4 | 181.9 |
| 2012 | 8575371 | 6600522 | 16253970 | 1078077 | 0 | 52.76 | 40.61 | 6.63 | 56.51 | 43.49 | 181.9 | 200.8 | 189.5 |
| 2013 | 8843638 | 6910942 | 16880683 | 1126103 | 0 | 52.39 | 40.94 | 6.67 | 56.13 | 43.87 | 187.6 | 210.3 | 196.8 |
| 2014 | 9259655 | 7168861 | 17608138 | 1179622 | 0 | 52.59 | 40.71 | 6.7 | 56.36 | 43.64 | 196.5 | 218.1 | 205.3 |
| 2015 | 9709535 | 7369222 | 18295019 | 1216262 | 0 | 53.07 | 40.28 | 6.65 | 56.85 | 43.15 | 206 | 224.2 | 213.3 |
| 2016 | 9977096 | 7580439 | 18804913 | 1247378 | 0 | 53.06 | 40.31 | 6.63 | 56.83 | 43.17 | 211.7 | 230.7 | 219.2 |
| 2017 | 10434978 | 7873027 | 19612102 | 1304097 | 0 | 53.21 | 40.14 | 6.65 | 57 | 43 | 221.4 | 239.6 | 228.6 |
| 2018 | 10967687 | 8295055 | 20656516 | 1393774 | 0 | 53.1 | 40.16 | 6.75 | 56.94 | 43.06 | 232.7 | 252.4 | 240.8 |
| 2019 | 11458472 | 8620834 | 21539982 | 1460676 | 0 | 53.2 | 40.02 | 6.78 | 57.07 | 42.93 | 243.1 | 262.3 | 251.1 |
| 2020 | 11605744 | 8946779 | 21375281 | 822758 | 0 | 54.3 | 41.86 | 3.85 | 56.47 | 43.53 | 246.2 | 272.2 | 249.2 |
| 2021 | 12572704 | 10099442 | 23745848 | 1073701 | 1 | 52.95 | 42.53 | 4.52 | 55.45 | 44.55 | 266.8 | 307.3 | 276.8 |
| 2022 | 13466671 | 10884896 | 26059709 | 1708141 | 1 | 51.68 | 41.77 | 6.55 | 55.3 | 44.7 | 285.7 | 331.2 | 303.8 |
| 2023 | 14256577 | 11808999 | 27825886 | 1760310 | 0 | 51.23 | 42.44 | 6.33 | 54.7 | 45.3 | 302.5 | 359.3 | 324.4 |
| 2024 | 15064163 | 12439872 | 29380991 | 1876956 | 0 | 51.27 | 42.34 | 6.39 | 54.77 | 45.23 | 319.6 | 378.5 | 342.5 |
| 2025 | 15718937 | 13031275 | 30861292 | 2111080 | 0 | 50.93 | 42.23 | 6.84 | 54.67 | 45.33 | 333.5 | 396.5 | 359.8 |
Business surplus outgrew paychecks after 1997

View exact chart values
| year | compensation | gos | gdp |
|---|---|---|---|
| 1997 | 100 | 100 | 100 |
| 1998 | 107.7 | 103 | 105.7 |
| 1999 | 114.8 | 109.3 | 112.3 |
| 2000 | 124.2 | 113.6 | 119.5 |
| 2001 | 128.3 | 117.7 | 123.4 |
| 2002 | 130.3 | 123.8 | 127.4 |
| 2003 | 135 | 132 | 133.6 |
| 2004 | 142.8 | 142 | 142.4 |
| 2005 | 150.2 | 154.6 | 152 |
| 2006 | 158.9 | 163.7 | 161.1 |
| 2007 | 167.4 | 170.5 | 168.7 |
| 2008 | 171.2 | 173.6 | 172.2 |
| 2009 | 164.8 | 174.7 | 168.8 |
| 2010 | 168.3 | 185.9 | 175.4 |
| 2011 | 174.7 | 192.4 | 181.9 |
| 2012 | 181.9 | 200.8 | 189.5 |
| 2013 | 187.6 | 210.3 | 196.8 |
| 2014 | 196.5 | 218.1 | 205.3 |
| 2015 | 206 | 224.2 | 213.3 |
| 2016 | 211.7 | 230.7 | 219.2 |
| 2017 | 221.4 | 239.6 | 228.6 |
| 2018 | 232.7 | 252.4 | 240.8 |
| 2019 | 243.1 | 262.3 | 251.1 |
| 2020 | 246.2 | 272.2 | 249.2 |
| 2021 | 266.8 | 307.3 | 276.8 |
| 2022 | 285.7 | 331.2 | 303.8 |
| 2023 | 302.5 | 359.3 | 324.4 |
| 2024 | 319.6 | 378.5 | 342.5 |
| 2025 | 333.5 | 396.5 | 359.8 |
Iowa’s surplus already outruns its payroll. Michigan’s has not.
The same split, applied to the states that filled Monday’s campaign map, is not uniform. Using compensation as a share of compensation plus surplus in 2025 — a two-factor mix that leaves taxes out — Michigan still looks like a paycheck state: 57.92%, the highest in this set, with $394.3 billion in compensation against $286.5 billion in surplus. Pennsylvania is 57.80%. Wisconsin is 56.89%. California, despite the tech balance sheet in its backyard, is 56.09%. Kansas is 55.66%. Ohio is 53.32%. Texas is 50.62%. Iowa is 49.11%, the only state here where surplus, $131.2 billion, exceeded compensation, $126.6 billion.
The recent move is sharper than the long one in some places. From 2019 to 2025, Texas’s compensation factor share dropped 5.00 percentage points, the largest decline in this set. Iowa fell 3.87 points, Wisconsin 3.45, Ohio 3.39, Michigan 2.21, Pennsylvania 1.03, California 0.66. Kansas ticked up 0.16 points, the only gain. From 1997 to 2025, Ohio and Wisconsin each lost more than 7 points. California barely moved. A scatter of the 2019–2025 change against the 2025 level puts Texas farthest left and Iowa lowest. That is a map of mixes, not of misery. It does not say Iowans got poorer in dollars. It says more of what Iowa produces now sits in the surplus bucket — which, on a farm-and-factory landscape, includes proprietors’ income as well as corporate profits and depreciation.
President Trump spent the weekend in Iowa and Kansas promising diesel checks. Michigan spent the weekend arguing over a Senate endorsement. The books underneath those rallies do not settle the races. They do show why a 3.4% national print can feel like someone else’s boom. A compensation-heavy mix, as in Michigan, means more of GDP shows up as pay. A surplus-heavy mix, as in Iowa and Texas, means more of it shows up as business income, including the income of people who are not on a W-2.
In 2025, Iowa’s surplus already rivaled its payroll

View exact chart values
| state | comp_of_factor_2025_pct | comp_of_factor_1997_pct | comp_of_factor_2019_pct | change_1997_2025_pp | change_2019_2025_pp | compensation_2025_bn | gos_2025_bn |
|---|---|---|---|---|---|---|---|
| Michigan | 57.92 | 63.65 | 60.13 | -5.73 | -2.21 | 394.3 | 286.5 |
| Pennsylvania | 57.8 | 60.92 | 58.83 | -3.12 | -1.03 | 570.9 | 416.8 |
| Wisconsin | 56.89 | 64.4 | 60.34 | -7.51 | -3.45 | 256.6 | 194.4 |
| California | 56.09 | 57.3 | 56.75 | -1.21 | -0.66 | 2235.1 | 1749.9 |
| Kansas | 55.66 | 60.73 | 55.5 | -5.08 | 0.16 | 122.2 | 97.4 |
| Ohio | 53.32 | 60.9 | 56.71 | -7.58 | -3.39 | 487.9 | 427.1 |
| Texas | 50.62 | 56.38 | 55.62 | -5.75 | -5 | 1362.9 | 1329.4 |
| Iowa | 49.11 | 55.24 | 52.98 | -6.13 | -3.87 | 126.6 | 131.2 |
Texas’s paycheck-to-surplus mix shifted fastest after 2019

View exact chart values
| state | comp_of_factor_2025_pct | comp_of_factor_1997_pct | comp_of_factor_2019_pct | change_1997_2025_pp | change_2019_2025_pp | compensation_2025_bn | gos_2025_bn |
|---|---|---|---|---|---|---|---|
| Michigan | 57.92 | 63.65 | 60.13 | -5.73 | -2.21 | 394.3 | 286.5 |
| Pennsylvania | 57.8 | 60.92 | 58.83 | -3.12 | -1.03 | 570.9 | 416.8 |
| Wisconsin | 56.89 | 64.4 | 60.34 | -7.51 | -3.45 | 256.6 | 194.4 |
| California | 56.09 | 57.3 | 56.75 | -1.21 | -0.66 | 2235.1 | 1749.9 |
| Kansas | 55.66 | 60.73 | 55.5 | -5.08 | 0.16 | 122.2 | 97.4 |
| Ohio | 53.32 | 60.9 | 56.71 | -7.58 | -3.39 | 487.9 | 427.1 |
| Texas | 50.62 | 56.38 | 55.62 | -5.75 | -5 | 1362.9 | 1329.4 |
| Iowa | 49.11 | 55.24 | 52.98 | -6.13 | -3.87 | 126.6 | 131.2 |
The surplus did not go to the factory floor
If surplus outgrew paychecks, who booked it? Industry gross operating surplus, from BEA’s SAGDP7 table, is in thousands of dollars; converted to billions, it can be compared with the SAGDP1 surplus total. In 2025, finance, insurance, real estate, rental and leasing accounted for $4,984.5 billion, or 38.25% of U.S. surplus, up from 33.21% in 1997. Information — software publishing, telecom, data processing, broadcasting and related — was $1,062.2 billion, 8.15% of surplus, up from 5.90%. Professional and business services was $1,009.7 billion, 7.75%. Durable-goods manufacturing was $604.5 billion, 4.64%, down from 8.94% in 1997.
Indexed to 1997=100, information surplus is at 547.3, a 447.2% rise. Finance is at 456.6. Professional services is at 443.1. Durable manufacturing is at 205.8, a 105.8% rise, slower than the surplus total’s 296.5%. These four industries are not the whole surplus pie; they are the ones that speak to this week’s AI earnings, factory PMI and farm-state politics. The information line is the one that rhymes with Anthropic’s compute bill and Apple’s profit. The manufacturing line is the one that rhymes with an ISM reading of 55.5. Surplus can boom in software and real estate while the factory share of that boom shrinks. That is a composition fact, not a verdict on whether factories are “winning.”
None of this proves that tariffs, the Iran war, or a midterm farm package caused the split. Annual 2025 accounts cannot see a November 2026 oil drop. They also cannot test a 1947 labor-share headline. What they can say, without raising their voice, is that the last full year on the books already showed compensation at a 1997–2025 low as a share of GDP, surplus growing faster than pay, Iowa’s surplus larger than its payroll, and information surplus more than five times its 1997 level. If Tuesday’s voters are sour on a 3.4% economy, they are not inventing the gap between the print and the paycheck. They are living in a pie whose slices moved.
Information surplus grew more than fivefold; factory surplus barely doubled

View exact chart values
| year | fire | information | professional | durable_mfg |
|---|---|---|---|---|
| 1997 | 100 | 100 | 100 | 100 |
| 1998 | 104.8 | 109.3 | 99.6 | 96.9 |
| 1999 | 112.9 | 118.3 | 109.2 | 95.7 |
| 2000 | 121.2 | 96 | 109.2 | 98.8 |
| 2001 | 131.4 | 109.1 | 121.3 | 78.7 |
| 2002 | 137.3 | 143.2 | 137 | 88.5 |
| 2003 | 142.4 | 149.2 | 147.9 | 99.7 |
| 2004 | 146 | 173 | 158.7 | 105.6 |
| 2005 | 160.9 | 181.4 | 166.6 | 116.9 |
| 2006 | 166.8 | 182.7 | 172.6 | 124.5 |
| 2007 | 172.8 | 205.6 | 188.8 | 128.9 |
| 2008 | 168 | 227.4 | 219.7 | 121.4 |
| 2009 | 181.5 | 219.5 | 211.3 | 105.6 |
| 2010 | 187.1 | 238.1 | 224 | 130.3 |
| 2011 | 191.8 | 235.9 | 232.4 | 137.4 |
| 2012 | 207.7 | 229.7 | 239.2 | 143.7 |
| 2013 | 212.7 | 258.8 | 237.4 | 150.9 |
| 2014 | 225 | 255.3 | 243.2 | 149.3 |
| 2015 | 234.1 | 277.9 | 250.8 | 153.8 |
| 2016 | 246 | 303.9 | 260.3 | 151.5 |
| 2017 | 252.5 | 310.6 | 271.2 | 154.3 |
| 2018 | 266.7 | 310.4 | 289 | 159.7 |
| 2019 | 280.4 | 349.8 | 299.6 | 164.3 |
| 2020 | 291.9 | 362 | 320.9 | 163.2 |
| 2021 | 316.8 | 385.1 | 344.9 | 170.6 |
| 2022 | 347.7 | 411.3 | 357 | 182.5 |
| 2023 | 392.3 | 465.1 | 388.1 | 205.4 |
| 2024 | 421.8 | 509.4 | 417.6 | 200.8 |
| 2025 | 456.6 | 547.3 | 443.1 | 205.8 |
Sources and methods
This analysis uses the U.S. Bureau of Economic Analysis annual GDP-by-state summary (SAGDP1) and gross operating surplus by industry (SAGDP7) from the September 30, 2026 regional release, pinned in an AtlanticPulse snapshot created October 8, 2026. Observation years are calendar 1997–2025. They are not the advance third-quarter 2026 national GDP estimates released around this edition, and they are not a reconstruction of a 1947 labor-share series.
Compensation of employees is wages, salaries and employer supplements on an accrual basis. Gross operating surplus includes consumption of fixed capital, proprietors’ income, corporate profits and net business current transfer payments; it is not identical to corporate profits or to BLS labor share of nonfarm business income. Taxes on production and imports less subsidies complete the SAGDP1 identity. For the United States, compensation + surplus + taxes-less-subsidies matched published current-dollar GDP within $4 million in every year, treated as rounding.
State comparisons use compensation as a share of compensation plus surplus, omitting taxes, for Michigan, Iowa, Kansas, Texas, California, Pennsylvania, Ohio and Wisconsin. Industry surplus series are SAGDP7 values in thousands of dollars, divided by 1,000 to millions and then by 1,000 to billions, and compared with SAGDP1 total surplus in millions. The four industries shown are not exhaustive. 2020 taxes-less-subsidies are distorted by pandemic subsidies. Nulls were not recoded as zero. No year had duplicate observations. GDP by state excludes compensation of federal civilian and military personnel stationed abroad and some overseas military capital consumption. Provider lag relative to election week is expected. No causal claim is made from these descriptive shares.
Research completed 2026-11-03, for the November 2, 2026 news edition. The available source data may cover earlier periods; see the observation periods and source vintages above.