Research
The $3.3 trillion housing bill, and the much smaller pump
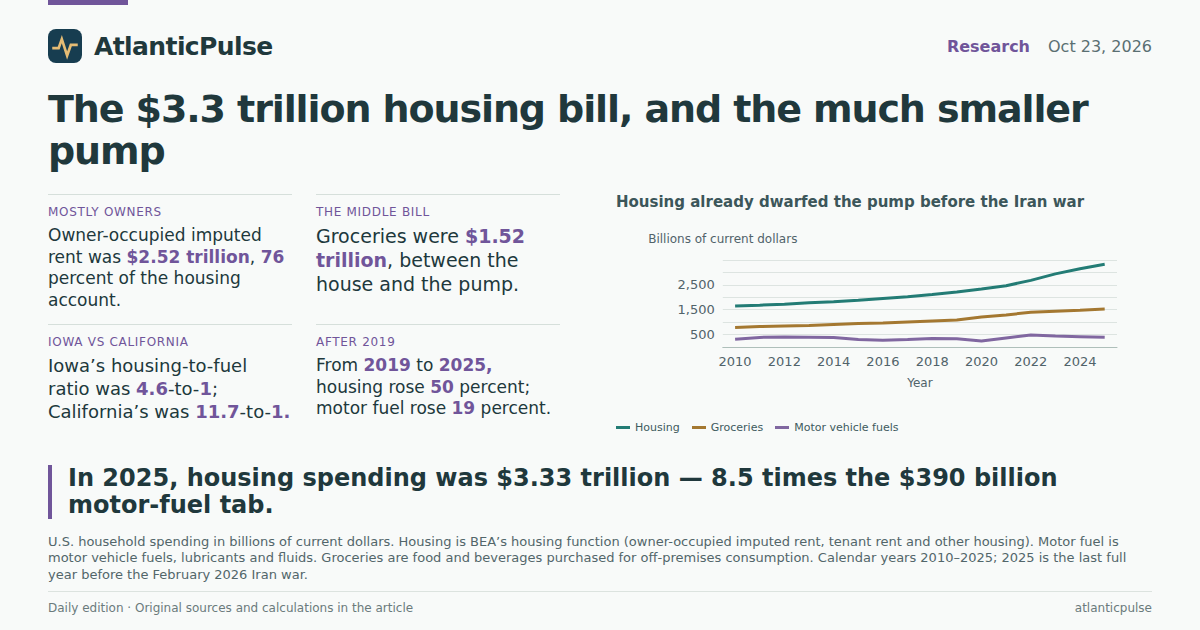
Two memos, two very different bills
President Trump spent Thursday trying to look like a cost-of-living president on two fronts at once. He invoked the 1950 Defense Production Act to treat petroleum production and refining as a national-defense problem, with diesel still around $6 a gallon and Brent crude above $114. He also signed an executive order telling housing agencies to nibble at mortgage insurance, veterans’ and rural loan rates, and manufactured homes, eleven days before the midterms. The political instinct is obvious: the pump is loud, and so is the rent. The official spending books are quieter, and they are not the same size.
The latest complete Bureau of Economic Analysis state consumption accounts run through calendar 2025 — the last full year before the February 2026 Iran war sent diesel to a U.S. record. They cannot tell you what a gallon costs this week. They can tell you which bill was already eating the household budget when the White House started writing wartime energy memos. In 2025, Americans spent $3.33 trillion on housing, $1.52 trillion on groceries, and $390 billion on motor vehicle fuels, lubricants and fluids. Housing was 8.5 times the motor-fuel tab. It was 16 percent of all household spending. Fuel was under 2 percent.
That hierarchy is the opposite of a campaign’s volume knob. Diesel at $6.32 a gallon is a number you see on a sign. Imputed rent is a number you do not. The Defense Production Act memo and a $150 million refining push are aimed at the smaller annual bill. The housing order is aimed at the larger one, and even then only at a sliver of it: mortgage insurance for some government-backed borrowers, not the $2.52 trillion of owner-occupied housing that dominates the account.
Housing already dwarfed the pump before the Iran war

View exact chart values
| year | housing_bil | owner_bil | tenant_bil | other_housing_bil | motorfuel_bil | food_bil | total_bil | housing_share_pct | fuel_share_pct | food_share_pct | housing_to_fuel_ratio | owner_share_of_housing_pct | pc_housing_util | pc_gasoline_energy | pc_food | pc_total |
|---|---|---|---|---|---|---|---|---|---|---|---|---|---|---|---|---|
| 2010 | 1648.1 | 1267.6 | 361.1 | 19.4 | 312.1 | 786.9 | 10260.3 | 16.06 | 3.04 | 7.67 | 5.28 | 76.91 | 6296 | 1088 | 2543 | 33164 |
| 2011 | 1683 | 1284 | 378.3 | 20.7 | 386.8 | 819.5 | 10698.9 | 15.73 | 3.62 | 7.66 | 4.35 | 76.29 | 6360 | 1327 | 2628 | 34309 |
| 2012 | 1722.4 | 1301.7 | 399.5 | 21.2 | 397.8 | 846.2 | 11047.4 | 15.59 | 3.6 | 7.66 | 4.33 | 75.58 | 6409 | 1342 | 2692 | 35145 |
| 2013 | 1778.3 | 1343.9 | 413.4 | 21 | 395.7 | 870.5 | 11388.2 | 15.62 | 3.47 | 7.64 | 4.49 | 75.57 | 6585 | 1331 | 2749 | 35956 |
| 2014 | 1823.3 | 1372.2 | 429.5 | 21.7 | 383.1 | 910.4 | 11874.5 | 15.36 | 3.23 | 7.67 | 4.76 | 75.26 | 6722 | 1287 | 2852 | 37194 |
| 2015 | 1879.1 | 1411.2 | 445.5 | 22.4 | 297.4 | 942 | 12297.4 | 15.28 | 2.42 | 7.66 | 6.32 | 75.1 | 6824 | 991 | 2927 | 38213 |
| 2016 | 1953.2 | 1470.7 | 460.7 | 21.7 | 268.6 | 969.6 | 12726.8 | 15.35 | 2.11 | 7.62 | 7.27 | 75.3 | 6996 | 885 | 2989 | 39238 |
| 2017 | 2023.3 | 1533.2 | 467.1 | 23 | 302.5 | 1010.4 | 13290.6 | 15.22 | 2.28 | 7.6 | 6.69 | 75.78 | 7196 | 992 | 3094 | 40693 |
| 2018 | 2108.2 | 1593.6 | 490.4 | 24.1 | 341.7 | 1044.4 | 13934.4 | 15.13 | 2.45 | 7.49 | 6.17 | 75.59 | 7486 | 1116 | 3179 | 42415 |
| 2019 | 2210.8 | 1665.4 | 520.9 | 24.4 | 328.7 | 1083.2 | 14437.5 | 15.31 | 2.28 | 7.5 | 6.73 | 75.33 | 7758 | 1067 | 3280 | 43720 |
| 2020 | 2331.9 | 1770.6 | 536.8 | 24.5 | 238.4 | 1201.7 | 14231.4 | 16.39 | 1.68 | 8.44 | 9.78 | 75.93 | 8106 | 779 | 3624 | 42920 |
| 2021 | 2464.4 | 1869.4 | 569.6 | 25.5 | 361.1 | 1291.5 | 16114.8 | 15.29 | 2.24 | 8.01 | 6.82 | 75.85 | 8560 | 1162 | 3889 | 48524 |
| 2022 | 2679.3 | 2028.7 | 622.4 | 28.2 | 481.7 | 1394.2 | 17670.8 | 15.16 | 2.73 | 7.89 | 5.56 | 75.72 | 9325 | 1541 | 4174 | 52907 |
| 2023 | 2940.7 | 2221.4 | 688.9 | 30.4 | 436.9 | 1438.3 | 18772.6 | 15.66 | 2.33 | 7.66 | 6.73 | 75.54 | 10017 | 1381 | 4271 | 55746 |
| 2024 | 3148.6 | 2383.3 | 734.4 | 30.8 | 415.4 | 1478.8 | 19822.5 | 15.88 | 2.1 | 7.46 | 7.58 | 75.7 | 10585 | 1299 | 4349 | 58301 |
| 2025 | 3326.3 | 2521.9 | 771.6 | 32.8 | 389.8 | 1524 | 20870.2 | 15.94 | 1.87 | 7.3 | 8.53 | 75.82 | 11159 | 1225 | 4459 | 61062 |
The housing account is mostly owners, and it is not a mortgage payment
Three-quarters of that 2025 housing bill is not rent paid to a landlord. It is the Bureau of Economic Analysis’s imputed rental value of owner-occupied nonfarm housing — $2.52 trillion, or 76 percent of housing-function spending. Tenant rent was $772 billion. Farm dwellings and group housing were a rounding error, about $33 billion. The imputation asks what the house would have rented for, not what the owner wrote on a check for principal, interest, taxes and insurance. It is the right way to compare owners and renters in the national accounts. It is a terrible way to score a mortgage-insurance pilot.
The executive order’s FHFA experiment, if it ever reaches eligible borrowers, would cancel a lender-protection premium. That premium is not the same line as imputed rent, and it is not the same line as homeowners’ insurance. Readers should not treat the $3.33 trillion housing total as a pile of cash the White House can rebate. They should treat it as evidence that the thing Americans call “housing costs” was already, before the war, a much larger slice of the consumption pie than the thing they call “gas.”
Groceries sat in between. Off-premises food and beverages — the supermarket bill, including alcohol and farm food consumed at home — totaled $1.52 trillion in 2025, about four times motor fuel and less than half of housing. Per person, the 2025 averages were $11,159 on housing and utilities, $4,459 on groceries, and $1,225 on gasoline and other energy goods, a slightly broader fuel line that also includes heating oil. The wartime diesel spike of 2026 will lift the fuel number. It would have to more than octuple the 2025 motor-fuel total to catch housing. That is not a forecast. It is arithmetic on last year’s books.
Three-quarters of the housing bill is owner-occupied

View exact chart values
| category | billions | share_of_housing_pct |
|---|---|---|
| Owner-occupied imputed rent | 2521.9 | 75.8 |
| Tenant rent | 771.6 | 23.2 |
| Other housing | 32.8 | 1 |
Fuel spiked in 2022. Housing never came back down.
Index the same series to 2019 and the wartime politics look even more lopsided. By 2025, housing spending was 50 percent above 2019. Groceries were up 41 percent. Total household spending was up 45 percent. Motor-fuel spending was up 19 percent — after a 2022 spike that took the index to 147, then a two-year fade to 119. In 2022, when pump prices last dominated the news, the fuel bill still peaked at $482 billion. Housing that year was already $2.68 trillion.
The 2020 collapse in driving is visible too. Motor-fuel spending fell to $238 billion, 28 percent below 2019, while housing kept rising. Then fuel snapped back. Housing did not pause for the snap-back. From 2019 through 2025 the housing-to-fuel ratio went from 6.7-to-1 to 8.5-to-1, with a wartime-looking 9.8-to-1 in the stay-at-home year. The Iran war will move 2026. It has not rewritten 2010–2025.
None of this says diesel at $6 is cheap, or that a tanker of Russian diesel the size of 7 percent of one American day will close the gap. A $150 million Defense Production Act pot is 0.04 percent of the 2025 motor-fuel bill. Even if every dollar became pump relief, which federal energy pushes do not, it would not show up in a national consumption account. The housing order is similarly small next to $3.33 trillion. The point is not that the memos are fake. It is that they are being asked to move objects of very different mass, and only one of those objects is currently on fire in the polls.
Since 2019, housing rose faster than the fuel bill

View exact chart values
| year | housing_idx | owner_idx | tenant_idx | motorfuel_idx | food_idx | total_idx |
|---|---|---|---|---|---|---|
| 2010 | 74.5 | 76.1 | 69.3 | 95 | 72.6 | 71.1 |
| 2011 | 76.1 | 77.1 | 72.6 | 117.7 | 75.7 | 74.1 |
| 2012 | 77.9 | 78.2 | 76.7 | 121 | 78.1 | 76.5 |
| 2013 | 80.4 | 80.7 | 79.4 | 120.4 | 80.4 | 78.9 |
| 2014 | 82.5 | 82.4 | 82.4 | 116.5 | 84 | 82.2 |
| 2015 | 85 | 84.7 | 85.5 | 90.5 | 87 | 85.2 |
| 2016 | 88.3 | 88.3 | 88.4 | 81.7 | 89.5 | 88.2 |
| 2017 | 91.5 | 92.1 | 89.7 | 92 | 93.3 | 92.1 |
| 2018 | 95.4 | 95.7 | 94.1 | 103.9 | 96.4 | 96.5 |
| 2019 | 100 | 100 | 100 | 100 | 100 | 100 |
| 2020 | 105.5 | 106.3 | 103 | 72.5 | 110.9 | 98.6 |
| 2021 | 111.5 | 112.2 | 109.3 | 109.9 | 119.2 | 111.6 |
| 2022 | 121.2 | 121.8 | 119.5 | 146.5 | 128.7 | 122.4 |
| 2023 | 133 | 133.4 | 132.2 | 132.9 | 132.8 | 130 |
| 2024 | 142.4 | 143.1 | 141 | 126.4 | 136.5 | 137.3 |
| 2025 | 150.5 | 151.4 | 148.1 | 118.6 | 140.7 | 144.6 |
Iowa feels the pump more. California feels the house.
The national ratio hides a map. In 2025, a person in Iowa spent $8,069 on housing and utilities and $1,750 on gasoline and other energy goods — a 4.6-to-1 split, the tightest among the states in this week’s national news. Maine was 6.4-to-1, with $11,298 on housing and utilities and $1,767 on the broader fuel line, which includes heating oil in a cold state. California went the other way: $13,333 on housing and utilities and $1,139 on gasoline and other energy goods, almost 12-to-1. Ohio, Michigan, Pennsylvania and Texas sat between about 7-to-1 and 8-to-1. Alaska’s fuel-and-heating-oil line was only $956 a person on this measure, against $10,211 of housing and utilities.
Those are not household averages. They are statewide spending divided by resident population. A farmer burning dyed diesel in a tractor is not in the household motor-fuel line the same way a commuter is. Iowa’s high per-person fuel number still tells you why a Sioux City rally hears diesel before it hears imputed rent. California’s housing number tells you why an Oakland voting case and a coastal housing order can share a news cycle with $6 diesel and still be about different wallets.
The 2026 war will raise the fuel bars. It will not, on one year of pump prices, turn Iowa into a place where gasoline outspends housing. If the White House wants a midterm affordability story that matches the official books, it is still mostly a housing story, with a fuel emergency bolted on. If it wants a story that matches the signs on the road, it is a fuel story, and the housing order is a second press release. Voters can believe both. The accounts cannot pretend they are the same size.
In Iowa, housing still beat fuel — but by less

View exact chart values
| state | housing_utilities | gasoline_energy | ratio |
|---|---|---|---|
| Iowa | 8069 | 1750 | 4.61 |
| Ohio | 8937 | 1228 | 7.28 |
| Michigan | 10007 | 1320 | 7.58 |
| Alaska | 10211 | 956 | 10.68 |
| Pennsylvania | 10235 | 1323 | 7.74 |
| Texas | 10353 | 1265 | 8.18 |
| United States | 11159 | 1225 | 9.11 |
| Maine | 11298 | 1767 | 6.39 |
| California | 13333 | 1139 | 11.71 |
Iowa and Maine spend more at the pump; California spends more on the house

View exact chart values
| state | gasoline_energy | housing_utilities | ratio |
|---|---|---|---|
| United States | 1225 | 11159 | 9.11 |
| California | 1139 | 13333 | 11.71 |
| Maine | 1767 | 11298 | 6.39 |
| Texas | 1265 | 10353 | 8.18 |
| Pennsylvania | 1323 | 10235 | 7.74 |
| Alaska | 956 | 10211 | 10.68 |
| Michigan | 1320 | 10007 | 7.58 |
| Ohio | 1228 | 8937 | 7.28 |
| Iowa | 1750 | 8069 | 4.61 |
Sources and methods
All figures are from the Bureau of Economic Analysis Personal Consumption Expenditures by State (SAPCE) annual accounts, release bea-sapce-2026-09-30, covering calendar years 2010–2025. Observation dates are calendar years, not the October 2026 edition date; 2025 is the last complete year and predates the February 2026 start of the U.S.-Israel war with Iran.
Housing is the SAPCE4 housing function: tenant-occupied rent, imputed rental of owner-occupied nonfarm housing, and other housing. It is not a cash mortgage bill and is not mortgage insurance. Motor vehicle fuels, lubricants and fluids are the SAPCE4 transportation function line. Groceries are SAPCE1 food and beverages purchased for off-premises consumption, which includes alcoholic beverages and farm food consumed at home.
Per-person comparisons use SAPCE2: housing and utilities (housing plus water, electricity and gas) and gasoline and other energy goods (motor fuels plus fuel oils and other fuels). Those per-person lines are broader than the national housing-function and motor-fuel-function totals and should not be mixed as if they were the same series. Values are statewide aggregates divided by resident population, not household averages.
Dollar figures are current (nominal) dollars. Missing observations were not treated as zero. No causal effect is inferred for the Defense Production Act, the housing executive order, or 2026 pump prices. The $150 million refining figure cited in the news is compared with 2025 motor-fuel spending only as a scale check.
Research completed 2026-10-24, for the October 23, 2026 news edition. The available source data may cover earlier periods; see the observation periods and source vintages above.