Research
The 2.2 percent expansion is real. It is also lopsided.
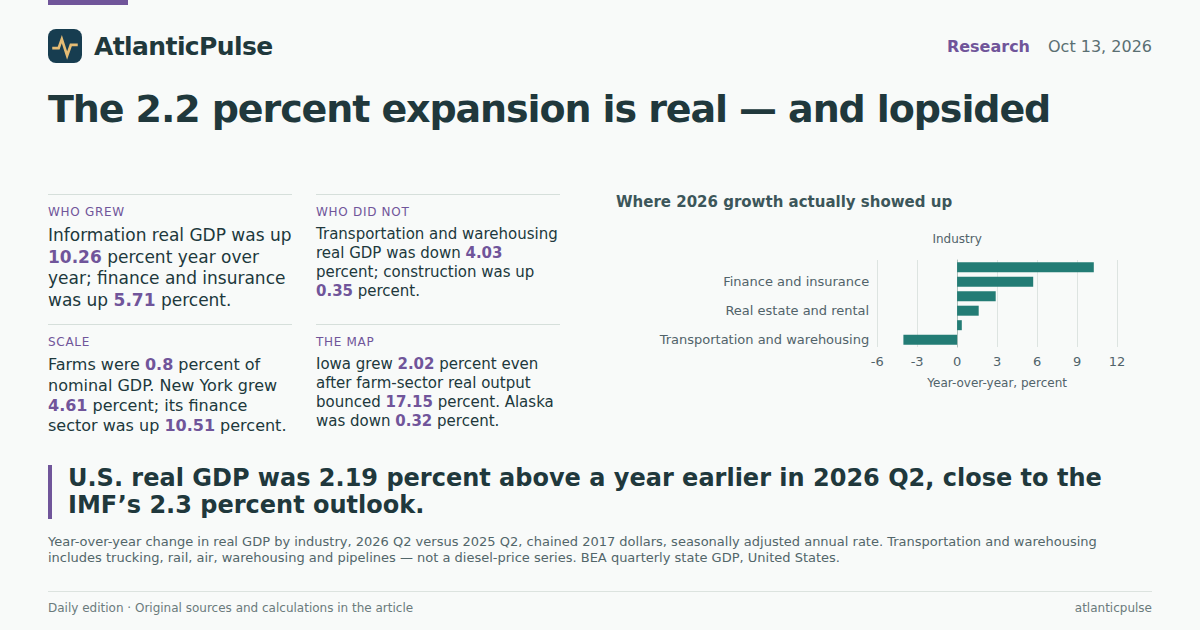
A 2.2 percent print, three weeks from an election
The International Monetary Fund's October outlook still has the United States growing 2.3 percent in both 2026 and 2027. That is a calendar-year forecast, not a quarterly score. The official books that already exist tell a nearby story. In the second quarter of 2026, U.S. real GDP ran at a seasonally adjusted annual rate of $24.4 trillion in chained 2017 dollars, 2.19 percent above the same quarter a year earlier. The first quarter was 2.64 percent higher than a year before. From the last quarter of 2019, real output is up 16.3 percent.
Those are not current-week observations. They are the Bureau of Economic Analysis's quarterly state GDP accounts, published in a September 30, 2026 release and running through June. They will not capture October's diesel deal, a 7 percent mortgage, or a single bank's earnings miss. They do show what the expansion looked like before those headlines: still positive, a little slower than early 2024, and nothing like a recession in the national total.
The useful question is not whether the 2.2 percent exists. It does. It is which industries and states produced it. Washington spent this week arguing over Russian diesel for farmers and truckers, a housing market that has stopped clearing, and another strong quarter on Wall Street. The GDP accounts sort those arguments by size.
U.S. real GDP, year over year

View exact chart values
| quarter | real_gdp_billions | yoy_percent |
|---|---|---|
| 2019 Q1 | 20431.6 | — |
| 2019 Q2 | 20602.3 | — |
| 2019 Q3 | 20843.3 | — |
| 2019 Q4 | 20985.4 | — |
| 2020 Q1 | 20709.2 | 1.36 |
| 2020 Q2 | 19078 | -7.4 |
| 2020 Q3 | 20558.9 | -1.36 |
| 2020 Q4 | 20791.9 | -0.92 |
| 2021 Q1 | 21106.6 | 1.92 |
| 2021 Q2 | 21474.1 | 12.56 |
| 2021 Q3 | 21641.7 | 5.27 |
| 2021 Q4 | 22001.6 | 5.82 |
| 2022 Q1 | 21945.7 | 3.98 |
| 2022 Q2 | 21976.3 | 2.34 |
| 2022 Q3 | 22124.4 | 2.23 |
| 2022 Q4 | 22272.5 | 1.23 |
| 2023 Q1 | 22456.9 | 2.33 |
| 2023 Q2 | 22577.6 | 2.74 |
| 2023 Q3 | 22828.8 | 3.18 |
| 2023 Q4 | 23033.2 | 3.42 |
| 2024 Q1 | 23116 | 2.93 |
| 2024 Q2 | 23320.1 | 3.29 |
| 2024 Q3 | 23501.8 | 2.95 |
| 2024 Q4 | 23641.8 | 2.64 |
| 2025 Q1 | 23650.2 | 2.31 |
| 2025 Q2 | 23884.6 | 2.42 |
| 2025 Q3 | 24113 | 2.6 |
| 2025 Q4 | 24125.5 | 2.05 |
| 2026 Q1 | 24274.4 | 2.64 |
| 2026 Q2 | 24408 | 2.19 |
Two industries did the lifting
Index real GDP to the second quarter of 2022, when the rate-hike cycle was already underway, and the mix is not subtle. By mid-2026 the information sector — software publishing, telecom, broadcasting, data processing and related services — stood at 141.1. Finance and insurance stood at 116.2. The all-industry total was 111.1. Construction was 103.8. Transportation and warehousing was 101.6. Farms, forestry, fishing and hunting were still a hair below that 2022 baseline, at 99.5.
Year over year, the same ranking holds. In 2026 Q2, information real GDP was 10.26 percent above a year earlier. Finance and insurance was up 5.71 percent. Those two sectors are not a rounding error. In current dollars they were 5.9 percent and 9.0 percent of U.S. GDP that quarter, or about $1.92 trillion and $2.93 trillion at annual rates. Real estate and rental remains larger still, at 13.6 percent of nominal output, but it grew only 1.62 percent in real terms — slower than the national average.
This is the pattern the IMF flagged when it warned that American growth is becoming dependent on a narrow set of technology firms and related investment. The BEA information sector is broader than chips and data centers, and chained-dollar indexes are not a census of AI spending. Even so, the official accounts already show an expansion that is much stronger in code, media and finance than in the physical industries politicians spent the week promising to soothe.
The expansion since 2022 has not been even

View exact chart values
| quarter | total | finance | real_estate | construction | transport | agriculture | information |
|---|---|---|---|---|---|---|---|
| 2019 Q1 | 93 | 90.4 | 86.9 | 104.7 | 94.1 | 92.4 | 76.1 |
| 2019 Q2 | 93.7 | 91.2 | 87.3 | 105.2 | 94.7 | 91.8 | 79.1 |
| 2019 Q3 | 94.8 | 91.6 | 88.3 | 105.9 | 95.9 | 90.6 | 81 |
| 2019 Q4 | 95.5 | 95 | 88.7 | 105.3 | 95.7 | 91.4 | 81.7 |
| 2020 Q1 | 94.2 | 91 | 88.9 | 103.8 | 95.1 | 95.8 | 80.6 |
| 2020 Q2 | 86.8 | 93.3 | 86.6 | 98.6 | 77.5 | 85.4 | 80 |
| 2020 Q3 | 93.6 | 94.2 | 89.5 | 104.2 | 86.9 | 96.7 | 84.7 |
| 2020 Q4 | 94.6 | 97.6 | 90.1 | 105.5 | 89.3 | 99.9 | 85.9 |
| 2021 Q1 | 96 | 98 | 91.6 | 106.7 | 96.4 | 99.7 | 89.2 |
| 2021 Q2 | 97.7 | 99.7 | 93.6 | 107.7 | 98.7 | 99 | 93 |
| 2021 Q3 | 98.5 | 100 | 95.2 | 105.7 | 101.7 | 99.5 | 95.4 |
| 2021 Q4 | 100.1 | 102.2 | 97.7 | 102.9 | 104 | 103 | 99.5 |
| 2022 Q1 | 99.9 | 100.8 | 99.1 | 104.2 | 100.9 | 100.6 | 98.2 |
| 2022 Q2 | 100 | 100 | 100 | 100 | 100 | 100 | 100 |
| 2022 Q3 | 100.7 | 100.8 | 100.4 | 96.3 | 100.7 | 100.4 | 102.2 |
| 2022 Q4 | 101.3 | 100.2 | 100.6 | 95.8 | 100.8 | 101.3 | 104.2 |
| 2023 Q1 | 102.2 | 104.9 | 100.8 | 95.8 | 100.6 | 106.8 | 106.3 |
| 2023 Q2 | 102.7 | 104.9 | 100.8 | 96.5 | 101.9 | 103.7 | 108.9 |
| 2023 Q3 | 103.9 | 107.7 | 101.3 | 99.3 | 102.3 | 101.4 | 113.6 |
| 2023 Q4 | 104.8 | 107.3 | 101.8 | 100.8 | 103.5 | 100.5 | 115.8 |
| 2024 Q1 | 105.2 | 106.1 | 102.3 | 102.4 | 104.2 | 99.4 | 116.8 |
| 2024 Q2 | 106.1 | 107.6 | 103.3 | 103.2 | 104.3 | 102.8 | 118.3 |
| 2024 Q3 | 106.9 | 106.6 | 104.3 | 103.5 | 105.5 | 98.9 | 120.3 |
| 2024 Q4 | 107.6 | 107.5 | 105.6 | 103.7 | 107.2 | 98 | 121.9 |
| 2025 Q1 | 107.6 | 108.2 | 107 | 102.3 | 105.8 | 97.4 | 124.3 |
| 2025 Q2 | 108.7 | 109.9 | 108.2 | 103.5 | 105.9 | 96.7 | 127.9 |
| 2025 Q3 | 109.7 | 112.8 | 108.4 | 103.4 | 106.7 | 99.4 | 131.2 |
| 2025 Q4 | 109.8 | 113.7 | 108.4 | 103.1 | 104.8 | 101.7 | 133 |
| 2026 Q1 | 110.5 | 114.6 | 108.8 | 103 | 104.5 | 98.1 | 138 |
| 2026 Q2 | 111.1 | 116.2 | 110 | 103.8 | 101.6 | 99.5 | 141.1 |
Where 2026 growth actually showed up

View exact chart values
| industry | yoy_percent |
|---|---|
| Transportation and warehousing | -4.03 |
| Construction | 0.35 |
| Real estate and rental | 1.62 |
| Farms and related | 2.9 |
| Finance and insurance | 5.71 |
| Information | 10.26 |
Freight shrank. Building barely grew. Farms are tiny.
Transportation and warehousing is the sector that actually moves diesel. In 2026 Q2 its real GDP was 4.03 percent below a year earlier, the only decline among the industries pulled for this article. That is trucking, rail, air, pipelines and warehousing together, not a pump-price series, and it does not prove that $6 diesel caused the drop. It does show that the industry Washington is trying to cheapen fuel for was already contracting in real terms before the diesel waiver was announced.
Construction, the industry that would have to build the houses that are not selling, grew 0.35 percent year over year. Real estate and rental, which includes imputed owner-occupied housing as well as landlords and lessors, grew 1.62 percent. Together those two sectors are about 18 percent of nominal GDP. They are not collapsing on this measure. They are not carrying the expansion either.
Farms, forestry, fishing and hunting were 0.8 percent of nominal GDP in 2026 Q2 — about $246 billion at an annual rate. Real output in that sector was 2.9 percent higher than a year earlier, a bounce after a weak stretch, not a large enough block of the economy to move the national print. A diesel deal sold as help for farmers is aimed at a politically loud industry that is, on the official books, smaller than a rounding error in information.
The states in this week's news
The national 2.19 percent is an average. Among the states that showed up in this week's national reporting, the spread is wide. New York's real GDP was 4.61 percent above a year earlier in 2026 Q2. California was up 3.59 percent. Kansas was up 2.33 percent, Iowa 2.02 percent, Ohio 1.89 percent, Minnesota 1.76 percent, Texas 1.69 percent. Alaska was down 0.32 percent. These are not the ten battlegrounds, and they are not a 50-state ranking. They are the places tied to the diesel fight, the bank-earnings tape, and the president's midterm travel.
New York's print is not a mystery. The state's finance and insurance sector was 10.51 percent above a year earlier, more than double the state's all-industry rate. Iowa's farm-sector real GDP jumped 17.15 percent year over year in 2026 Q2 after a deep contraction in 2023 and another down year in 2025. That is a bounce in real output, not a statement about farm household income, and it still left Iowa's total economy growing a shade slower than the United States. Alaska's minus sign follows a strong 2025; it is one quarter, not a verdict on an LNG pitch.
Read together, the state books match the industry books. Where finance and information are dense, the expansion is faster. Where the story is freight, housing, or a small farm sector, growth is closer to 2 percent or below. The IMF can still print 2.3 percent for the country. It cannot make that 2.3 percent feel the same in Youngstown and on Wall Street.
Selected states versus the national 2.2 percent

View exact chart values
| state | yoy_percent | real_billions |
|---|---|---|
| Alaska | -0.32 | 56.2 |
| Texas | 1.69 | 2376.5 |
| Minnesota | 1.76 | 399.2 |
| Ohio | 1.89 | 751.8 |
| Iowa | 2.02 | 208.8 |
| United States | 2.19 | 24408 |
| Kansas | 2.33 | 182.3 |
| California | 3.59 | 3515.2 |
| New York | 4.61 | 1962.1 |
Iowa’s farm bounce, New York’s finance boom

View exact chart values
| quarter | iowa_total_yoy | iowa_ag_yoy | ny_total_yoy | ny_finance_yoy |
|---|---|---|---|---|
| 2022 Q1 | — | — | — | — |
| 2022 Q2 | — | — | — | — |
| 2022 Q3 | — | — | — | — |
| 2022 Q4 | — | — | — | — |
| 2023 Q1 | -0.8 | -14.27 | -0.86 | -4.63 |
| 2023 Q2 | -0.48 | -17.59 | 0.4 | -0.19 |
| 2023 Q3 | 0.96 | -17.9 | 1.42 | 2.37 |
| 2023 Q4 | 2.6 | -17.54 | 1.82 | 2.88 |
| 2024 Q1 | 2.48 | 0.67 | 2.67 | 0.91 |
| 2024 Q2 | 2.88 | 1.53 | 4.52 | 6.1 |
| 2024 Q3 | 0.48 | -9.67 | 4.13 | 2.72 |
| 2024 Q4 | -1.26 | -7.42 | 4.16 | 4.58 |
| 2025 Q1 | -1.21 | -17.78 | 3.52 | 5.34 |
| 2025 Q2 | -0.87 | -8.85 | 1.78 | -0.73 |
| 2025 Q3 | -0.3 | 9.06 | 1.98 | 1.07 |
| 2025 Q4 | 0.67 | 22.12 | 2.65 | 3.46 |
| 2026 Q1 | 2.47 | 27.32 | 3.86 | 7.21 |
| 2026 Q2 | 2.02 | 17.15 | 4.61 | 10.51 |
What these books do not say
A year-over-year rate in quarterly GDP is not an annualized quarter-to-quarter number, and it is not the IMF's calendar-year forecast. Chained 2017 dollars should not be added across industries as if they were cash. Nominal shares in 2026 Q2 describe that quarter's mix, not a household budget. Transportation's decline does not isolate diesel from air travel, warehousing, or anything else in the sector. Information's surge does not isolate Nvidia from Netflix.
The series stop in June. October's diesel barrels, mortgage applications, and bank trading desks are not in them. What the books do say, without much drama, is that America was still expanding at midyear, that the expansion was already lopsided, and that the industries at the center of this week's political argument — freight, building, and farms — were not the ones doing the lifting.
Sources and methods
Observation window: BEA quarterly state GDP, seasonally adjusted annual rates, 2019 Q1 through 2026 Q2 for national industry series and 2022 Q1 through 2026 Q2 for selected states. The pinned snapshot is release bea-regional-state-quarterly-2026-09-30. These are not October 2026 observations.
Real GDP is millions of chained 2017 dollars. Nominal GDP is millions of current dollars. Industry shares use nominal levels in 2026 Q2. Year-over-year growth uses real levels in the same quarter a year earlier. The industry index sets 2022 Q2 equal to 100. Chained-dollar industry levels are not additive.
Selected states (Iowa, Ohio, New York, Texas, California, Alaska, Minnesota, Kansas) are those tied to this week's national reporting, not a complete ranking. Iowa 'farms' is agriculture, forestry, fishing and hunting real GDP, not farm proprietors' income. Information includes software, telecom, data processing and related industries, not a dedicated AI series. Transportation includes trucking plus air, rail, water, pipelines and warehousing.
No causal inference. A decline in transportation real GDP is not a measure of diesel prices. A rise in information GDP is not a count of data centers. The IMF 2.3 percent figure cited in accompanying news is a calendar-year growth forecast and is not taken from these extracts.
Null values were not treated as zero. Duplicate or suppressed observations were not present in the extracted national and state series used here. Status flags on those rows were empty.
Research completed 2026-10-14, for the October 13, 2026 news edition. The available source data may cover earlier periods; see the observation periods and source vintages above.