Research
The $19,000 home bill, and the $50 insurance line on the books
The cash bill and the consumption books are not the same ledger
A Zillow and Thumbtack tally circulating Thursday put typical Philadelphia-area homeowners at $18,834 a year for maintenance, property tax and insurance — about $1,570 a month after the mortgage, 31.7 percent above five years earlier. Nationally, the same exercise put insurance up 54 percent over five years, the sharpest of the three cash costs. In a parallel story, a 36-state coalition said General Motors will pay $220 million over allegations it sold Smart Driver trip and braking data to brokers who resold it to insurers, affecting more than 10 million Americans, including 123,143 people in Connecticut.
Those are cash-out-the-door numbers, or at least estimates of them. They are not what the Bureau of Economic Analysis books as household consumption. On the official state ledgers, housing is mostly the rent tenants pay plus an imputed rental value for owner-occupied homes — the income a homeowner could have collected by renting the place out. Property taxes are not consumption. Maintenance is mostly somewhere else. And “household insurance” is recorded as net premiums: what households pay, minus what insurers pay back in claims. That last point is why a $2,000 cash homeowners policy can show up as a few dozen dollars per resident in the accounts. The books are not wrong. They are answering a different question.
Two insurance lines, and the smaller one is the house
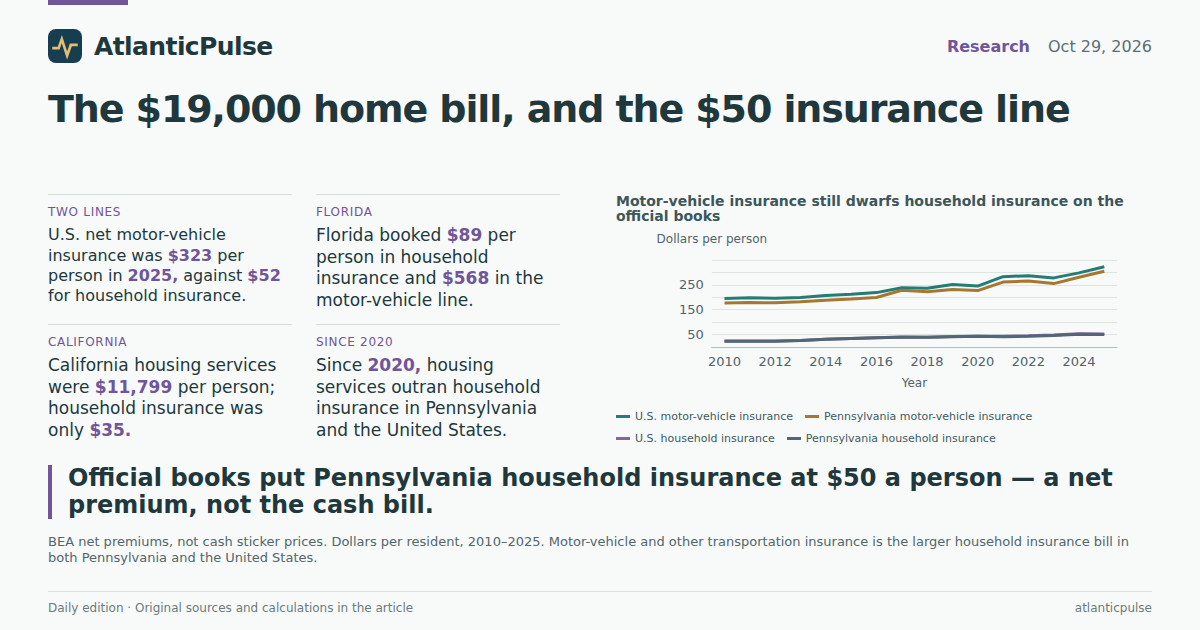
In 2025, the latest full year in the September 2026 BEA state consumption release, Americans spent $17.6 billion on net household insurance and $110.5 billion on net motor-vehicle and other transportation insurance. That is $52 per person for the house-and-contents line and $323 per person for the car — more than six times as much. Pennsylvania, the state attached to that Philadelphia carrying-cost story, sat almost on the national marks: $50 and $305. Combined, the two net insurance lines were 0.57 percent of Pennsylvania personal consumption and 0.61 percent of the U.S. total. Housing services, by contrast, were 13.9 percent of Pennsylvania spending and 15.9 percent nationally.
The history is not a hockey stick in either series, but it is not flat. From 2015 to 2025, U.S. net household insurance per person rose 50 percent and motor-vehicle insurance 52 percent — close to the 54 percent five-year cash-premium jump in the Zillow note, even though the level is net, not gross. Since 2020, the car line has moved faster than the house line: up 32 percent nationally and 35 percent in Pennsylvania, against 19 percent and 16 percent for household insurance. Connecticut, which is due more than $6 million of the GM settlement, already books $365 per person in net motor-vehicle insurance, above the U.S. average. If you came looking for the driving-data fight in the consumption accounts, that is the column to open.
Motor-vehicle insurance still dwarfs household insurance on the official books

View exact chart values
| year | household_insurance | motor_vehicle_insurance | pa_household_insurance | pa_motor_vehicle_insurance | pa_housing | us_housing |
|---|---|---|---|---|---|---|
| 2010 | 24 | 195 | 23 | 177 | 4948 | 5327 |
| 2011 | 24 | 198 | 23 | 179 | 4959 | 5397 |
| 2012 | 24 | 196 | 23 | 178 | 5089 | 5480 |
| 2013 | 26 | 199 | 26 | 182 | 5253 | 5615 |
| 2014 | 31 | 207 | 31 | 188 | 5283 | 5711 |
| 2015 | 34 | 212 | 34 | 193 | 5506 | 5839 |
| 2016 | 37 | 219 | 37 | 199 | 5571 | 6022 |
| 2017 | 39 | 238 | 40 | 228 | 5760 | 6195 |
| 2018 | 39 | 236 | 39 | 222 | 5919 | 6417 |
| 2019 | 42 | 251 | 41 | 231 | 6086 | 6695 |
| 2020 | 43 | 245 | 43 | 227 | 6434 | 7033 |
| 2021 | 43 | 283 | 41 | 261 | 6731 | 7421 |
| 2022 | 45 | 287 | 43 | 266 | 7194 | 8022 |
| 2023 | 48 | 278 | 46 | 255 | 7670 | 8733 |
| 2024 | 53 | 298 | 51 | 281 | 8308 | 9260 |
| 2025 | 52 | 323 | 50 | 305 | 8667 | 9732 |
Florida’s household-insurance bill stands apart

View exact chart values
| state | hh_per_person | auto_per_person | hou_per_person | ins_sum_per_person | hh_share_of_two | hh_chg_2020_25 | auto_chg_2020_25 | hh_chg_2015_25 | auto_chg_2015_25 | hou_chg_2020_25 | hou_chg_2015_25 | hh_millions | auto_millions | hou_millions | population |
|---|---|---|---|---|---|---|---|---|---|---|---|---|---|---|---|
| Florida | 89 | 568 | 12958 | 658 | 13.6 | 37.5 | 23.7 | 67 | 41 | 51.8 | 87.2 | 2099.6 | 13330.3 | 304031.2 | 23462518 |
| New York | 62 | 427 | 10824 | 489 | 12.7 | 37.2 | 55.6 | 88.5 | 125.4 | 32.9 | 65 | 1242.6 | 8545.8 | 216503.2 | 20002427 |
| Texas | 60 | 350 | 8934 | 410 | 14.7 | 15.8 | 26.7 | 46.9 | 45.6 | 40.6 | 70.6 | 1914.1 | 11095.7 | 283307.2 | 31709821 |
| Connecticut | 58 | 365 | — | 423 | 13.7 | 6.6 | 15.4 | 29 | 26.9 | — | — | 213.4 | 1345.4 | — | 3688496 |
| Colorado | 55 | 300 | — | 355 | 15.5 | 24.6 | 62.3 | 59.8 | 56.9 | — | — | 332.3 | 1805.1 | — | 6012561 |
| Pennsylvania | 50 | 305 | 8667 | 355 | 14 | 16 | 34.5 | 44.2 | 58.3 | 34.7 | 57.4 | 647.9 | 3988.8 | 113189.7 | 13059432 |
| Utah | 39 | 360 | — | 400 | 9.8 | 30.8 | 51.9 | 66.9 | 76.2 | — | — | 138.4 | 1275.5 | — | 3538904 |
| California | 35 | 259 | 11799 | 294 | 12 | 12.9 | 21.2 | 38.3 | 22.5 | 34.2 | 68.3 | 1389 | 10196.1 | 464361.4 | 39355309 |
| Arizona | 29 | 313 | — | 342 | 8.6 | 19.9 | 28.1 | 59.1 | 63.6 | — | — | 224.8 | 2383.7 | — | 7623818 |
Florida pays both bills. California’s housing is expensive; its household-insurance line is not.
Among the states named in today’s housing and insurer reporting, Florida is the outlier on both insurance ledgers. In 2025 it booked $89 per person in net household insurance — nearly three times Arizona’s $29 and well above Pennsylvania’s $50 — and $568 per person in net motor-vehicle insurance, against $323 nationally. New York, which the Zillow note ranked as the most expensive ownership market in that 30-metro set, is second on both insurance lines here: $62 and $427. Texas, whose Dallas and Houston premiums the same note said had jumped 75 and 69 percent over five years, sits at $60 and $350. Those are still per-person net premiums, not closing-table cash, but the ranking matches the places where homeowners have been complaining the loudest.
California breaks the pattern. Its housing services ran $11,799 per person in 2025, among the highest in this set, while net household insurance was only $35 — below Utah, below Pennsylvania, and a long way from Florida. That is not a claim that California homeowners enjoy cheap policies. It is a reminder that a net-premium series will look small wherever claims are large, coverage is thin, or both. Plot housing services against household insurance and Florida sits in the expensive-expensive corner; California sits expensive-cheap. Pennsylvania is cheaper than the United States on housing services ($8,667 versus $9,732) and almost identical on the household-insurance line. The scatter is small — six geographies with both series — but it is enough to stop treating “insurance” as a single statewide mood.
The driving-data fight is about a much larger insurance line

View exact chart values
| state | hh_per_person | auto_per_person | hou_per_person | ins_sum_per_person | hh_share_of_two | hh_chg_2020_25 | auto_chg_2020_25 | hh_chg_2015_25 | auto_chg_2015_25 | hou_chg_2020_25 | hou_chg_2015_25 | hh_millions | auto_millions | hou_millions | population |
|---|---|---|---|---|---|---|---|---|---|---|---|---|---|---|---|
| Florida | 89 | 568 | 12958 | 658 | 13.6 | 37.5 | 23.7 | 67 | 41 | 51.8 | 87.2 | 2099.6 | 13330.3 | 304031.2 | 23462518 |
| New York | 62 | 427 | 10824 | 489 | 12.7 | 37.2 | 55.6 | 88.5 | 125.4 | 32.9 | 65 | 1242.6 | 8545.8 | 216503.2 | 20002427 |
| Connecticut | 58 | 365 | — | 423 | 13.7 | 6.6 | 15.4 | 29 | 26.9 | — | — | 213.4 | 1345.4 | — | 3688496 |
| Utah | 39 | 360 | — | 400 | 9.8 | 30.8 | 51.9 | 66.9 | 76.2 | — | — | 138.4 | 1275.5 | — | 3538904 |
| Texas | 60 | 350 | 8934 | 410 | 14.7 | 15.8 | 26.7 | 46.9 | 45.6 | 40.6 | 70.6 | 1914.1 | 11095.7 | 283307.2 | 31709821 |
| Arizona | 29 | 313 | — | 342 | 8.6 | 19.9 | 28.1 | 59.1 | 63.6 | — | — | 224.8 | 2383.7 | — | 7623818 |
| Pennsylvania | 50 | 305 | 8667 | 355 | 14 | 16 | 34.5 | 44.2 | 58.3 | 34.7 | 57.4 | 647.9 | 3988.8 | 113189.7 | 13059432 |
| Colorado | 55 | 300 | — | 355 | 15.5 | 24.6 | 62.3 | 59.8 | 56.9 | — | — | 332.3 | 1805.1 | — | 6012561 |
| California | 35 | 259 | 11799 | 294 | 12 | 12.9 | 21.2 | 38.3 | 22.5 | 34.2 | 68.3 | 1389 | 10196.1 | 464361.4 | 39355309 |
California’s housing bill is high. Its household-insurance line is not

View exact chart values
| state | housing_per_person | hh_ins_per_person | auto_ins_per_person |
|---|---|---|---|
| United States | 9732 | 52 | 323 |
| Pennsylvania | 8667 | 50 | 305 |
| Texas | 8934 | 60 | 350 |
| Florida | 12958 | 89 | 568 |
| New York | 10824 | 62 | 427 |
| California | 11799 | 35 | 259 |
Since 2020, the housing service has outrun the insurance line
Index the Pennsylvania and U.S. per-person series to 2020 and the housing service is the one that pulled away. By 2025, U.S. housing services were 38 percent above 2020; Pennsylvania’s were 35 percent higher. Net household insurance was up 19 percent nationally and 16 percent in Pennsylvania. Motor-vehicle insurance lagged, then caught up, finishing 32 percent and 35 percent above 2020. That is the opposite of the cash-cost story in which insurance is the villain and housing the slow-moving backdrop. On the official books, the rent-equivalent of living in the house grew faster than the net premium attached to it.
Zoom out to the whole basket and the proportions barely budge. Pennsylvania’s housing-and-utilities consumption was $10,235 per person in 2025, against $11,159 nationally; total personal consumption was $62,438 and $61,062. Housing’s share of Pennsylvania spending was 13.9 percent in 2025, almost the same as in 2010. The two net insurance lines together never reached 0.7 percent of consumption in either geography across this window. A $220 million settlement is real money for a data-broker argument. It is a rounding error next to $110 billion of net motor-vehicle insurance, and it does not move the housing service that dominates the official housing column.
Since 2020, housing services outran household insurance

View exact chart values
| year | US_hh_idx | US_auto_idx | US_hou_idx | PA_hh_idx | PA_auto_idx | PA_hou_idx |
|---|---|---|---|---|---|---|
| 2015 | 79.7 | 86.6 | 83 | 80.4 | 84.9 | 85.6 |
| 2016 | 86.1 | 89.5 | 85.6 | 87.3 | 87.6 | 86.6 |
| 2017 | 90 | 97 | 88.1 | 92.7 | 100.4 | 89.5 |
| 2018 | 89.2 | 96.5 | 91.2 | 90.6 | 97.8 | 92 |
| 2019 | 96.4 | 102.7 | 95.2 | 96.6 | 101.5 | 94.6 |
| 2020 | 100 | 100 | 100 | 100 | 100 | 100 |
| 2021 | 98.8 | 115.6 | 105.5 | 96.7 | 115 | 104.6 |
| 2022 | 104.3 | 117.2 | 114.1 | 100.9 | 117 | 111.8 |
| 2023 | 111.4 | 113.4 | 124.2 | 107.2 | 112 | 119.2 |
| 2024 | 121.6 | 121.6 | 131.7 | 118.8 | 123.8 | 129.1 |
| 2025 | 119.2 | 132 | 138.4 | 116 | 134.5 | 134.7 |
What the books will not tell a closing table
None of this says the Philadelphia $18,834 is imaginary. A typical homeowner still writes checks for taxes, insurance and upkeep that never appear as a single BEA line. Net household insurance of $50 per Pennsylvanian is not a $50 premium; it is premiums minus claims, spread across every resident, renters included. Motor-vehicle insurance of $305 is likewise a net, statewide average, not the quote on a 2018 Civic. Housing services of $8,667 per person are mostly imputed rent, which is why they can rise even when a particular owner’s cash outlay does not. Convert those per-person figures into a household average and you are inventing a household size the tables do not contain.
The useful collision is conceptual. Today’s local reporting is about cash carrying costs and about insurers using driving data. The official books say the cash fight over homeowners insurance is a thin net-premium line, the driving-data fight sits on a much larger motor-vehicle line, and the housing service — rent plus the rent the owner is deemed to pay herself — is the number that actually moves the consumption accounts. Florida is where those stories overlap. Pennsylvania, on these ledgers, is closer to average than the Philadelphia closing table makes it feel. That is not a consolation. It is a map of which bill is which.
Sources and methods
Annual figures are from the BEA state personal consumption expenditures release dated 2026-09-30 (SAPCE tables through calendar 2025) and the BEA annual state personal income summary of the same vintage for Census midyear resident population. Observation years are calendar years, not current-day readings.
Per-person amounts divide millions of current dollars by population. Missing values were skipped and never treated as zero. “Net household insurance” and “net motor vehicle and other transportation insurance” are BEA net premiums (premiums less benefits), not cash sticker prices, property taxes or maintenance. “Housing” is tenant rent plus imputed owner-occupied rent, farm dwellings and group housing; it is not a mortgage or tax bill.
Comparisons are descriptive. They do not estimate causal effects of the GM settlement, insurer non-renewals, or Philadelphia carrying costs. Pennsylvania is the state attached to the Philadelphia metro estimate; that metro also includes New Jersey and Delaware counties, which are not in the Pennsylvania series. Per-person figures are not household averages.
Research completed 2026-10-30, for the October 29, 2026 news edition. The available source data may cover earlier periods; see the observation periods and source vintages above.