Research
The $15.7 million farm, and the much smaller industry already on Pennsylvania’s books
A reported $60,000 an acre, against a farm that still exists
Mervin Raudabaugh’s 261 acres in Silver Spring Township, Cumberland County, are not a metaphor. They are two cash-crop farms with road frontage near Interstate 81, which is exactly the kind of ground a data-center assembler wants. Reporting on the deal says developers talked $60,000 an acre, about $15.7 million. He took just under $1.9 million instead, selling development rights through a township preservation program so the next owner cannot flip the place into a server campus. That is not a $13.8 million donation of the same asset. He kept the land. He sold the option to pave it.
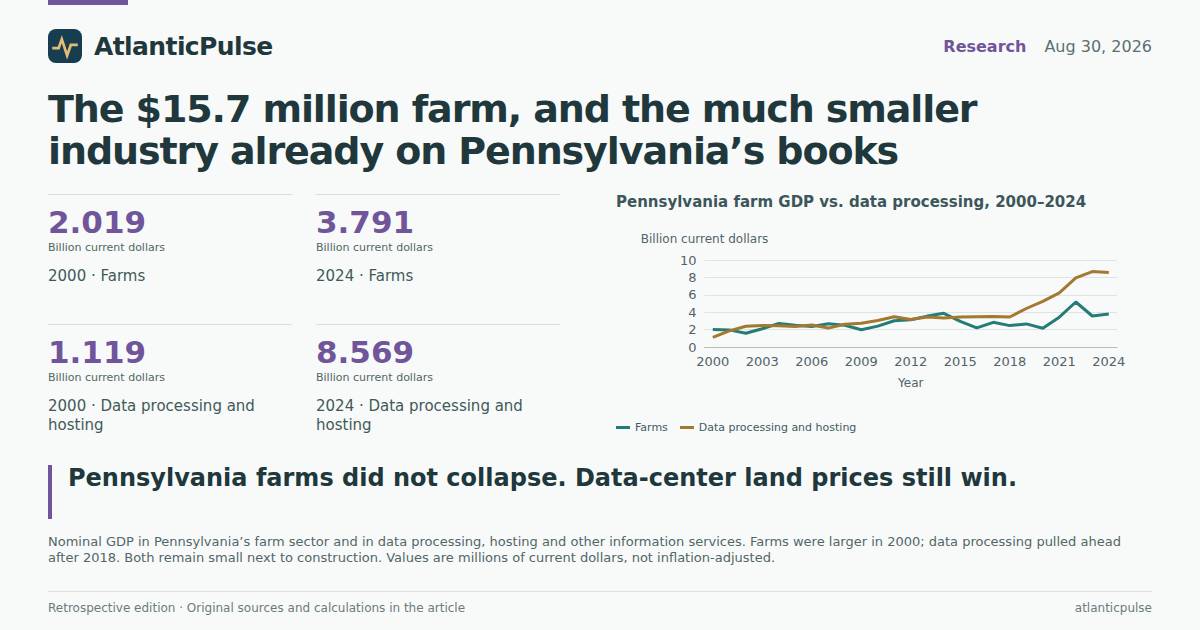
The official books cannot price one Cumberland County easement. They can say whether Pennsylvania farming had already collapsed before the offer arrived. In 2024, the latest year of industry GDP in the Bureau of Economic Analysis state accounts, Pennsylvania farms produced $3.79 billion of output. The whole state economy was $1.01 trillion. Farms were 0.38 percent of it. Construction alone was $41.2 billion, about eleven times the farm sector. Utilities were $15.2 billion. A 261-acre farm is not competing with the rest of Pennsylvania agriculture for survival. It is competing with a land price that capitalizes an industrial campus in a single check.
That is the useful part of the Raudabaugh story, and it is easy to get backwards. The farmer did not refuse a dying industry’s last check. He refused a use conversion that the crop ledger cannot match, year after year, because corn and soybeans do not bid like a hyperscale offtake agreement.
Pennsylvania farm GDP vs. data processing, 2000–2024

View exact chart values
| year | farm_gdp_billion | dataproc_gdp_billion | construction_gdp_billion | utilities_gdp_billion |
|---|---|---|---|---|
| 2000 | 2.019 | 1.119 | 16.91 | 8.262 |
| 2001 | 1.97 | 1.852 | 18.313 | 9.249 |
| 2002 | 1.58 | 2.388 | 18.817 | 8.847 |
| 2003 | 2.109 | 2.459 | 19.56 | 8.797 |
| 2004 | 2.711 | 2.437 | 20.254 | 8.998 |
| 2005 | 2.499 | 2.342 | 21.673 | 8.836 |
| 2006 | 2.367 | 2.522 | 23.099 | 9.543 |
| 2007 | 2.662 | 2.172 | 23.866 | 10.06 |
| 2008 | 2.489 | 2.612 | 23.144 | 10.115 |
| 2009 | 1.986 | 2.738 | 19.975 | 10.919 |
| 2010 | 2.408 | 3.051 | 21.204 | 11.895 |
| 2011 | 3.007 | 3.486 | 22.549 | 12.465 |
| 2012 | 3.132 | 3.146 | 23.151 | 11.773 |
| 2013 | 3.55 | 3.445 | 24.041 | 11.858 |
| 2014 | 3.869 | 3.35 | 25.663 | 12.273 |
| 2015 | 2.944 | 3.44 | 27.188 | 12.613 |
| 2016 | 2.212 | 3.482 | 28.198 | 12.774 |
| 2017 | 2.835 | 3.51 | 30.059 | 12.536 |
| 2018 | 2.464 | 3.444 | 31.318 | 12.444 |
| 2019 | 2.653 | 4.429 | 33.101 | 12.568 |
| 2020 | 2.148 | 5.249 | 31.186 | 12.494 |
| 2021 | 3.421 | 6.22 | 33.317 | 13.204 |
| 2022 | 5.169 | 7.945 | 36.147 | 14.933 |
| 2023 | 3.564 | 8.669 | 39.388 | 15.418 |
| 2024 | 3.791 | 8.569 | 41.19 | 15.205 |
Hosting overtook farms. Real farm output did not vanish.
Data processing, hosting and other information services — the BEA industry that includes internet access, search facilities and hosting, not a pure count of hyperscale halls — produced $8.57 billion in Pennsylvania in 2024. That is 2.3 times farm GDP, and 0.85 percent of the state. In 2000 the ranking ran the other way: farms $2.02 billion, data processing $1.12 billion. Hosting pulled ahead for good after 2018 and kept climbing through the pandemic years. Farms had a nominal spike in 2022, to $5.17 billion, then fell back.
Volume is the more honest farm test, because crop prices bounce. In chained 2017 dollars, Pennsylvania farm GDP in 2024 was $2.78 billion, only 4 percent above 2000. The index sits at 104. The 2022 bump shows up here too, then 2023 drops below the 2000 baseline. If the question is whether Pennsylvania stopped growing food, the real series says no. If the question is whether farmers got a booming production machine that could outbid data-center land assemblers, the real series also says no. Nominal farm GDP rose because prices did more of the work than acres and herds.
Farm proprietors’ income, which BEA tracks separately from corporate farms and from hired-labor pay, tells the same jumpy story. Pennsylvania farm proprietors took $612 million in 2000, $2.19 billion in 2022, $853 million in 2024 and $963 million in 2025. The 2025 figure is newer than industry GDP; it is still a fraction of one mid-sized industrial campus. West Virginia’s farm proprietors, for comparison, were $104 million in 2025. That is the income a preservation program is trying to keep on the land, not the income that clears $60,000 an acre.
Pennsylvania real farm output has barely moved

View exact chart values
| year | real_farm_gdp_chained2017_million | index_2000 |
|---|---|---|
| 2000 | 2682.6 | 100 |
| 2001 | 2394.3 | 89.3 |
| 2002 | 2103.8 | 78.4 |
| 2003 | 2475.7 | 92.3 |
| 2004 | 2691.7 | 100.3 |
| 2005 | 2972.5 | 110.8 |
| 2006 | 2977.7 | 111 |
| 2007 | 2491.7 | 92.9 |
| 2008 | 2307 | 86 |
| 2009 | 2458.3 | 91.6 |
| 2010 | 2536.5 | 94.6 |
| 2011 | 2347.2 | 87.5 |
| 2012 | 2366 | 88.2 |
| 2013 | 2434.3 | 90.7 |
| 2014 | 2882.8 | 107.5 |
| 2015 | 2713.6 | 101.2 |
| 2016 | 2443.5 | 91.1 |
| 2017 | 2834.7 | 105.7 |
| 2018 | 2595.6 | 96.8 |
| 2019 | 2842.3 | 106 |
| 2020 | 2396.6 | 89.3 |
| 2021 | 2693.3 | 100.4 |
| 2022 | 3079.6 | 114.8 |
| 2023 | 2447.4 | 91.2 |
| 2024 | 2783.8 | 103.8 |
The paychecks already moved. The land fight is still local.
Employee compensation makes the split blunter, with a caveat that matters on a family farm. Compensation counts hired labor, not the proprietor’s draw. In 2024 Pennsylvania farms paid $968 million in compensation; data processing paid $3.77 billion. Hosting’s wage bill was already larger in 2000. It widened sharply after 2018. Anyone looking only at payrolls would conclude that hosting had lapped farming years ago. Anyone looking at a 51-year dairyman would notice that his income does not sit in that compensation series.
Neighboring states show what “winning” the hosting race looks like on paper. In 2024 Virginia’s data-processing GDP was $13.5 billion against $1.64 billion from farms, a ratio of 8.3 to 1. New Jersey was 15.6 to 1. Maryland was about 3 to 1. Ohio still had farms slightly larger than hosting. West Virginia did too, barely: $424 million from farms, $378 million from data processing. Pennsylvania sits in the middle of that pack, not at the Loudoun County extreme. The West Virginia article that treated Loudoun as a cautionary tale was describing a state where hosting is already a visible slice of GDP. Pennsylvania is not there yet. Construction and utilities still dwarf both farms and hosting.
Where farms still outrun data processing — and where they do not

View exact chart values
| state | year | farm_gdp_million | dataproc_gdp_million | dataproc_minus_farm_million | dataproc_to_farm_ratio | farm_share_pct | dataproc_share_pct | total_gdp_million |
|---|---|---|---|---|---|---|---|---|
| Pennsylvania | 2024 | 3790.8 | 8568.5 | 4777.7 | 2.26 | 0.376 | 0.85 | 1007873.9 |
| West Virginia | 2024 | 424.1 | 378.4 | -45.7 | 0.89 | 0.398 | 0.355 | 106475.1 |
| Virginia | 2024 | 1636.6 | 13545.7 | 11909.1 | 8.28 | 0.215 | 1.778 | 761733.8 |
| Ohio | 2024 | 5565.6 | 5455.2 | -110.4 | 0.98 | — | — | — |
| Maryland | 2024 | 1281.4 | 3963.1 | 2681.7 | 3.09 | — | — | — |
| New Jersey | 2024 | 962.5 | 15047.7 | 14085.2 | 15.63 | — | — | — |
Farm paychecks vs. hosting paychecks in Pennsylvania

View exact chart values
| year | farm_compensation_million | dataproc_compensation_million |
|---|---|---|
| 2000 | 490.6 | 1931.7 |
| 2001 | 505.3 | 1881.7 |
| 2002 | 614.9 | 1446.5 |
| 2003 | 564.7 | 1400.6 |
| 2004 | 569.5 | 1243.8 |
| 2005 | 474.4 | 1255.6 |
| 2006 | 535.7 | 1252.9 |
| 2007 | 667.3 | 1163.6 |
| 2008 | 633.6 | 1115 |
| 2009 | 590.4 | 1076.6 |
| 2010 | 578.9 | 1056.8 |
| 2011 | 501.1 | 1159.5 |
| 2012 | 675.5 | 1237.4 |
| 2013 | 679 | 1327.3 |
| 2014 | 685.7 | 1338.3 |
| 2015 | 604.8 | 1456.7 |
| 2016 | 690.6 | 1490.3 |
| 2017 | 699.4 | 1595.6 |
| 2018 | 625 | 1765 |
| 2019 | 509.6 | 1984.5 |
| 2020 | 537.2 | 2318 |
| 2021 | 519.7 | 3022 |
| 2022 | 843.6 | 3452.8 |
| 2023 | 977 | 3812.1 |
| 2024 | 968.1 | 3770.2 |
West Virginia is selling a future that is not on the 2024 books
Gov. Patrick Morrisey’s plan to dedicate half of hyperscale data-center revenue to shrinking, then killing, West Virginia’s income tax is a fiscal story about money that has not arrived. In 2024 the state’s entire data-processing industry was $378 million of GDP. Mining except oil and gas — the coal-heavy slice of the accounts — was $8.78 billion, about twenty-three times hosting. Construction was $4.30 billion. Utilities were $2.85 billion. Farms, at $424 million, were still a hair larger than hosting. You can want server halls. You cannot, on these numbers, describe them as the industry that already replaced the mines.
The construction payroll is not a boom either, at least not yet. Seasonally adjusted state employment figures put West Virginia construction at 35,100 jobs in July 2026, up from 32,400 in July 2015. Pennsylvania construction was 261,400, up from 235,600. Those are real jobs. They are not a hyperscale gold rush showing up as a step-change in the payroll. If Morrisey’s 20-year development strategy works, the 2024 accounts will look quaint. If it does not, West Virginia will have traded local control and water fights for an industry that was still smaller than farms when the plan was unveiled.
None of this is a verdict on whether a particular campus should be built. Data-center GDP is not the same as a township’s property-tax roll, and hosting as BEA defines it is broader than a row of GPU halls. The honest statement is narrower. Pennsylvania’s farm sector is small, stable in real terms, and already outrun by hosting on paper. The land conversion is happening because industrial users can pay for a corridor, not because the crop accounts went to zero. West Virginia is asking voters to bank a hosting industry that, in the latest full year of GDP, had not yet outgrown the farms.
West Virginia’s books still run on mines, not server halls

View exact chart values
| sector | gdp_million |
|---|---|
| Data processing and hosting | 378.4 |
| Farms | 424.1 |
| Utilities | 2847.3 |
| Construction | 4303.5 |
| Mining except oil and gas | 8778 |
Sources and methods
This is retrospective enrichment using pinned catalogue snapshots, not an as-known-on-the-edition-date reconstruction. Research was compiled on 11 September 2026 against the 30 August 2026 State-News edition. BEA annual state GDP and income come from the bea-regional-state-annual-2026-04-09 release in a snapshot created 31 August 2026. BLS state employment comes from the 24 August 2026 SM snapshot. Later revisions may already sit in those files.
Industry GDP is annual and currently ends in calendar 2024. Farm proprietors’ income includes 2025. Employee compensation ends in 2024. Construction jobs are monthly, seasonally adjusted, through July 2026. One null observation in Pennsylvania farm GDP was skipped, not treated as zero; it is consistent with 2025 industry GDP not being in the SAGDP2 file. No duplicate year-geo rows were found in the mapped series.
Data processing, hosting and other information services (NAICS 518-519) includes internet access, search and hosting. It is not a census of hyperscale data-center campuses. Mining except oil and gas includes coal and other non-oil minerals; it is not identical to coal employment. Farm GDP is crop and animal production, not food manufacturing. Compensation of employees excludes farm proprietors’ income. Nominal GDP mixes prices and volume; the real farm series is the volume check. Shares use current-dollar industry GDP divided by current-dollar all-industry GDP for the same year and state. No causal effect is inferred from the comparisons. County-level land prices and tax collections are not in the indexed catalogue.
Research completed 2026-09-11, for the August 30, 2026 news edition. This is retrospective analysis, not a reconstruction of information available that day.