Research
The $103,000 visa, and the payrolls it would actually hit
A tax by another name
The Department of Homeland Security spent Tuesday trying to do with a rule what a federal judge would not let a proclamation do. After last year's $100,000 H-1B surcharge was blocked as an unconstitutional tax, the department proposed making a $103,265 extra fee permanent for every cap-subject petition — including many students already in the country who want to change status. Routine extensions for workers already here would generally be spared. The advertised point is to recover immigration-system costs and to make American hires look cheaper. The department's own analysis, as Fortune reported, estimated a “significant economic impact” on 76 percent of the small businesses it studied and $74.9 billion in costs over a decade.
That is a lot of money to hang on 85,000 visas. It is also a policy aimed at a labour market the government already measures, every month, in the establishment survey. The Current Employment Statistics programme does not count H-1B holders. It counts jobs on U.S. payrolls, by industry, whether the person in the chair is a citizen, a green-card holder, or someone whose employer just paid a six-figure cover charge. That limitation is the point. If the fee is supposed to rewire hiring in tech, consulting and universities, the first test is whether those payrolls are growing, shrinking, or simply getting more expensive.
The industries that live on the visa
Start with size. Computer systems design and related services — the NAICS 5415 bucket that includes custom programming, systems integration and related work — employed 2.37 million people on U.S. payrolls in July 2026, seasonally adjusted. That is not a niche. It is larger than many entire state labour markets. Custom computer programming, a subset of that industry and not an extra pile of jobs, accounted for 1.06 million as of June. Software publishers, which sit in the information supersector rather than professional services, employed 660,000 in June. Management, scientific and technical consulting employed 1.89 million in July. Private junior colleges, colleges, universities and professional schools employed 1.81 million in June. The broader professional, scientific and technical services sector, of which systems design and consulting are pieces, employed 10.84 million in July.
Those are the workplaces that, in practice, sponsor a large share of H-1B petitions. Indian IT firms, U.S. technology companies, consultancies and research universities all draw from the same 85,000-cap lottery. Universities are often cap-exempt; the proposed fee is written to hit cap-subject petitions, including some students changing status. The payroll numbers still matter for the pipeline. If the on-ramp from a U.S. degree to an H-1B looks closed, the department's own fee math starts from a smaller base of employers willing to pay.
What the survey cannot tell you is equally important. It cannot separate foreign-born from native-born workers. It cannot say how many of those 2.37 million systems-design jobs are H-1B jobs — most are not. It cannot say whether a firm that stops sponsoring will hire in Ohio, open a desk in Toronto, or leave the role unfilled. It can tell you whether the industries in the political argument are booming. They are not, at least not uniformly, and not lately.
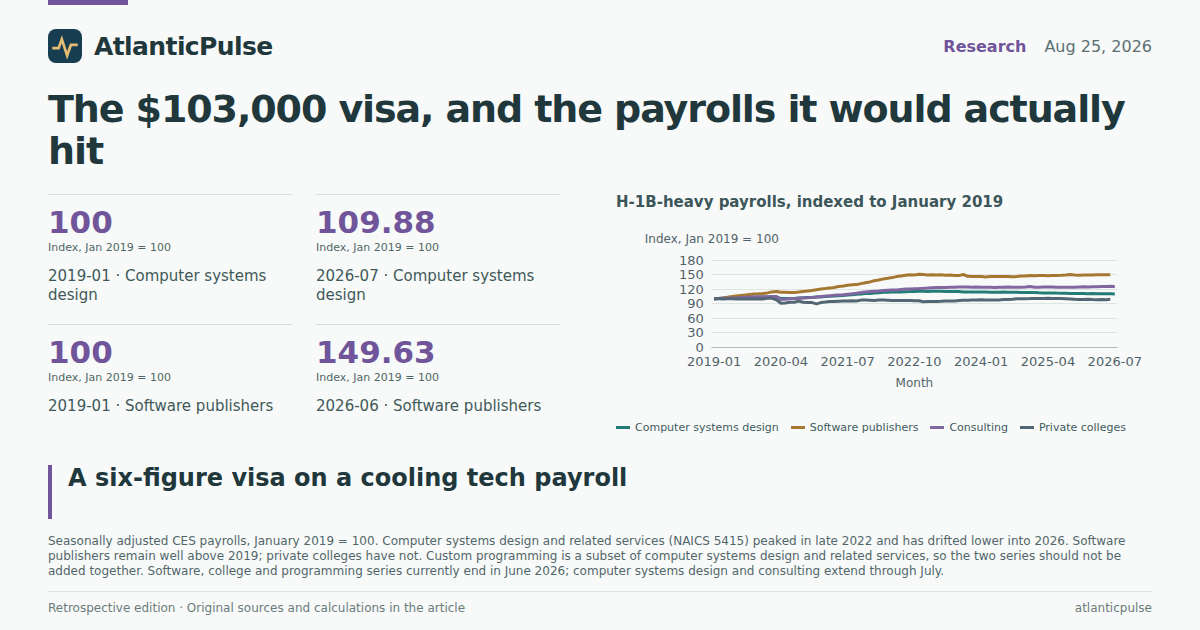
H-1B-heavy payrolls, indexed to January 2019

View exact chart values
| date | year_month | csd_thousands | csd_index_2019 | soft_thousands | soft_index_2019 | cons_thousands | cons_index_2019 | coll_thousands | coll_index_2019 | pst_thousands | pst_index_2019 | prog_thousands | prog_index_2019 |
|---|---|---|---|---|---|---|---|---|---|---|---|---|---|
| 2019-01-01 | 2019-01 | 2153.6 | 100 | 440.9 | 100 | 1503.6 | 100 | 1837.2 | 100 | 9404.5 | 100 | 952.7 | 100 |
| 2019-02-01 | 2019-02 | 2156.9 | 100.15 | 443.6 | 100.61 | 1510.2 | 100.44 | 1830.4 | 99.63 | 9427.6 | 100.25 | 956.1 | 100.36 |
| 2019-03-01 | 2019-03 | 2168.7 | 100.7 | 447.9 | 101.59 | 1515.6 | 100.8 | 1828.5 | 99.53 | 9459.5 | 100.58 | 959.9 | 100.76 |
| 2019-04-01 | 2019-04 | 2180.7 | 101.26 | 453 | 102.74 | 1519.1 | 101.03 | 1837.7 | 100.03 | 9476.1 | 100.76 | 965.8 | 101.38 |
| 2019-05-01 | 2019-05 | 2189.4 | 101.66 | 459.4 | 104.2 | 1523.2 | 101.3 | 1831.5 | 99.69 | 9504.7 | 101.07 | 968.5 | 101.66 |
| 2019-06-01 | 2019-06 | 2199.7 | 102.14 | 465.8 | 105.65 | 1528.3 | 101.64 | 1825.5 | 99.36 | 9536.6 | 101.4 | 973.5 | 102.18 |
| 2019-07-01 | 2019-07 | 2208.2 | 102.54 | 469.8 | 106.55 | 1535.9 | 102.15 | 1825.5 | 99.36 | 9559.5 | 101.65 | 977.1 | 102.56 |
| 2019-08-01 | 2019-08 | 2216.4 | 102.92 | 473.5 | 107.39 | 1546.4 | 102.85 | 1820.7 | 99.1 | 9577.5 | 101.84 | 978.4 | 102.7 |
| 2019-09-01 | 2019-09 | 2214.1 | 102.81 | 478.8 | 108.6 | 1551.9 | 103.21 | 1825.9 | 99.38 | 9588.4 | 101.96 | 977.9 | 102.65 |
| 2019-10-01 | 2019-10 | 2213.8 | 102.8 | 482.6 | 109.46 | 1557.2 | 103.56 | 1828.4 | 99.52 | 9601.6 | 102.1 | 977.7 | 102.62 |
| 2019-11-01 | 2019-11 | 2218.9 | 103.03 | 485.7 | 110.16 | 1560.4 | 103.78 | 1826.5 | 99.42 | 9627.8 | 102.37 | 979.4 | 102.8 |
| 2019-12-01 | 2019-12 | 2213.6 | 102.79 | 488.3 | 110.75 | 1562.9 | 103.94 | 1825 | 99.34 | 9637.2 | 102.47 | 980.2 | 102.89 |
| 2020-01-01 | 2020-01 | 2228.5 | 103.48 | 493.6 | 111.95 | 1562.3 | 103.9 | 1851 | 100.75 | 9667.1 | 102.79 | 986 | 103.5 |
| 2020-02-01 | 2020-02 | 2234.1 | 103.74 | 503 | 114.08 | 1569 | 104.35 | 1851.9 | 100.8 | 9704.8 | 103.19 | 989.1 | 103.82 |
| 2020-03-01 | 2020-03 | 2219.8 | 103.07 | 505.3 | 114.61 | 1567.9 | 104.28 | 1795.9 | 97.75 | 9685.1 | 102.98 | 985 | 103.39 |
| 2020-04-01 | 2020-04 | 2165.8 | 100.57 | 499.6 | 113.31 | 1474.1 | 98.04 | 1663.6 | 90.55 | 9161.6 | 97.42 | 963.6 | 101.14 |
| 2020-05-01 | 2020-05 | 2166.1 | 100.58 | 498.6 | 113.09 | 1488.1 | 98.97 | 1668.5 | 90.82 | 9209.1 | 97.92 | 962.3 | 101.01 |
| 2020-06-01 | 2020-06 | 2167.7 | 100.65 | 497.2 | 112.77 | 1502.7 | 99.94 | 1697.9 | 92.42 | 9278.1 | 98.66 | 962.9 | 101.07 |
| 2020-07-01 | 2020-07 | 2167.2 | 100.63 | 498.2 | 113 | 1506 | 100.16 | 1699.6 | 92.51 | 9301 | 98.9 | 965.4 | 101.33 |
| 2020-08-01 | 2020-08 | 2180.6 | 101.25 | 501.9 | 113.84 | 1514.3 | 100.71 | 1744.5 | 94.95 | 9351.6 | 99.44 | 972.8 | 102.11 |
| 2020-09-01 | 2020-09 | 2191.3 | 101.75 | 507.4 | 115.08 | 1523.4 | 101.32 | 1697.6 | 92.4 | 9403.3 | 99.99 | 977.9 | 102.65 |
| 2020-10-01 | 2020-10 | 2202.5 | 102.27 | 511.4 | 115.99 | 1532.8 | 101.94 | 1691.2 | 92.05 | 9445.5 | 100.44 | 982.7 | 103.15 |
| 2020-11-01 | 2020-11 | 2208.3 | 102.54 | 515.1 | 116.83 | 1538.1 | 102.29 | 1689.2 | 91.94 | 9474.5 | 100.74 | 984.6 | 103.35 |
| 2020-12-01 | 2020-12 | 2222.1 | 103.18 | 522.8 | 118.58 | 1553.7 | 103.33 | 1639.6 | 89.24 | 9534.9 | 101.39 | 994.4 | 104.38 |
| 2021-01-01 | 2021-01 | 2232.6 | 103.67 | 529.5 | 120.1 | 1571.8 | 104.54 | 1687.3 | 91.84 | 9603.8 | 102.12 | 994.5 | 104.39 |
| 2021-02-01 | 2021-02 | 2249 | 104.43 | 532.9 | 120.87 | 1582 | 105.21 | 1706.4 | 92.88 | 9657 | 102.68 | 999.9 | 104.95 |
| 2021-03-01 | 2021-03 | 2260.5 | 104.96 | 537.9 | 122 | 1595.3 | 106.1 | 1734.3 | 94.4 | 9710.4 | 103.25 | 1003.9 | 105.37 |
| 2021-04-01 | 2021-04 | 2272.3 | 105.51 | 542.4 | 123.02 | 1609.2 | 107.02 | 1729.8 | 94.15 | 9762.7 | 103.81 | 1007.2 | 105.72 |
| 2021-05-01 | 2021-05 | 2279.1 | 105.83 | 552.9 | 125.4 | 1619.4 | 107.7 | 1740.6 | 94.74 | 9812.4 | 104.34 | 1014.9 | 106.53 |
| 2021-06-01 | 2021-06 | 2296.9 | 106.65 | 557.3 | 126.4 | 1625.5 | 108.11 | 1749.8 | 95.24 | 9837.6 | 104.61 | 1021.7 | 107.24 |
| 2021-07-01 | 2021-07 | 2319.6 | 107.71 | 563.5 | 127.81 | 1643.7 | 109.32 | 1752.7 | 95.4 | 9924.5 | 105.53 | 1029.2 | 108.03 |
| 2021-08-01 | 2021-08 | 2332 | 108.28 | 567.6 | 128.74 | 1656.6 | 110.18 | 1760.4 | 95.82 | 9980 | 106.12 | 1035 | 108.64 |
| 2021-09-01 | 2021-09 | 2348.9 | 109.07 | 569.4 | 129.14 | 1672.9 | 111.26 | 1748.9 | 95.19 | 10044.8 | 106.81 | 1037.9 | 108.94 |
| 2021-10-01 | 2021-10 | 2361.2 | 109.64 | 578.3 | 131.16 | 1696.9 | 112.86 | 1784.3 | 97.12 | 10108.7 | 107.49 | 1048.9 | 110.1 |
| 2021-11-01 | 2021-11 | 2377.8 | 110.41 | 586.9 | 133.11 | 1714.1 | 114 | 1784.3 | 97.12 | 10177.2 | 108.22 | 1059 | 111.16 |
| 2021-12-01 | 2021-12 | 2389.5 | 110.95 | 594.1 | 134.75 | 1723.8 | 114.64 | 1778.5 | 96.8 | 10225.5 | 108.73 | 1066.9 | 111.99 |
| 2022-01-01 | 2022-01 | 2406.9 | 111.76 | 604.1 | 137.02 | 1735.6 | 115.43 | 1767.2 | 96.19 | 10264 | 109.14 | 1074.8 | 112.82 |
| 2022-02-01 | 2022-02 | 2413.6 | 112.07 | 611.1 | 138.6 | 1746.2 | 116.13 | 1784.5 | 97.13 | 10316.4 | 109.7 | 1083 | 113.68 |
| 2022-03-01 | 2022-03 | 2436.5 | 113.14 | 621 | 140.85 | 1759.3 | 117.01 | 1785.7 | 97.2 | 10378.7 | 110.36 | 1091.4 | 114.56 |
| 2022-04-01 | 2022-04 | 2441.6 | 113.37 | 626.9 | 142.19 | 1766.3 | 117.47 | 1779.2 | 96.84 | 10411.7 | 110.71 | 1099.3 | 115.39 |
| 2022-05-01 | 2022-05 | 2453.3 | 113.92 | 633.1 | 143.59 | 1770.2 | 117.73 | 1770.1 | 96.35 | 10450.3 | 111.12 | 1104.6 | 115.94 |
| 2022-06-01 | 2022-06 | 2458.3 | 114.15 | 641.9 | 145.59 | 1774.6 | 118.02 | 1768.4 | 96.26 | 10490.6 | 111.55 | 1114.1 | 116.94 |
| 2022-07-01 | 2022-07 | 2457.1 | 114.09 | 648.9 | 147.18 | 1787.7 | 118.89 | 1767.3 | 96.2 | 10543.3 | 112.11 | 1111.6 | 116.68 |
| 2022-08-01 | 2022-08 | 2462 | 114.32 | 653.7 | 148.26 | 1802.4 | 119.87 | 1762.3 | 95.92 | 10569.9 | 112.39 | 1117.6 | 117.31 |
| 2022-09-01 | 2022-09 | 2469.3 | 114.66 | 659.1 | 149.49 | 1803.9 | 119.97 | 1763.2 | 95.97 | 10593.7 | 112.65 | 1122.1 | 117.78 |
| 2022-10-01 | 2022-10 | 2479 | 115.11 | 657.4 | 149.1 | 1812.4 | 120.54 | 1760.7 | 95.84 | 10633 | 113.06 | 1127.7 | 118.37 |
| 2022-11-01 | 2022-11 | 2482.9 | 115.29 | 664.3 | 150.67 | 1820.8 | 121.1 | 1759.7 | 95.78 | 10659 | 113.34 | 1126.8 | 118.27 |
| 2022-12-01 | 2022-12 | 2483 | 115.3 | 660.2 | 149.74 | 1827.3 | 121.53 | 1717.8 | 93.5 | 10677.1 | 113.53 | 1125.6 | 118.15 |
| 2023-01-01 | 2023-01 | 2478.6 | 115.09 | 655.7 | 148.72 | 1836.8 | 122.16 | 1724.7 | 93.88 | 10693.4 | 113.71 | 1121.6 | 117.73 |
| 2023-02-01 | 2023-02 | 2481.3 | 115.22 | 658.9 | 149.44 | 1845.9 | 122.77 | 1732.7 | 94.31 | 10725 | 114.04 | 1123.2 | 117.9 |
| 2023-03-01 | 2023-03 | 2483.5 | 115.32 | 657.3 | 149.08 | 1846.8 | 122.83 | 1729.8 | 94.15 | 10739.1 | 114.19 | 1125.9 | 118.18 |
| 2023-04-01 | 2023-04 | 2482.4 | 115.27 | 658.3 | 149.31 | 1850.3 | 123.06 | 1736.4 | 94.51 | 10754.5 | 114.35 | 1128.1 | 118.41 |
| 2023-05-01 | 2023-05 | 2478.2 | 115.07 | 655.1 | 148.58 | 1855.6 | 123.41 | 1748.9 | 95.19 | 10776.6 | 114.59 | 1120.2 | 117.58 |
| 2023-06-01 | 2023-06 | 2472.9 | 114.83 | 657.2 | 149.06 | 1859.2 | 123.65 | 1752.5 | 95.39 | 10775.8 | 114.58 | 1116.6 | 117.2 |
| 2023-07-01 | 2023-07 | 2470.7 | 114.72 | 651.4 | 147.74 | 1861.5 | 123.8 | 1752.4 | 95.38 | 10786.9 | 114.7 | 1114.6 | 116.99 |
| 2023-08-01 | 2023-08 | 2467 | 114.55 | 651.3 | 147.72 | 1862.1 | 123.84 | 1764.4 | 96.04 | 10787.1 | 114.7 | 1106.3 | 116.12 |
| 2023-09-01 | 2023-09 | 2456.5 | 114.06 | 661.2 | 149.97 | 1865.8 | 124.09 | 1773.7 | 96.54 | 10784.4 | 114.67 | 1101 | 115.57 |
| 2023-10-01 | 2023-10 | 2454 | 113.95 | 645.1 | 146.31 | 1861.9 | 123.83 | 1779.6 | 96.86 | 10780.3 | 114.63 | 1093.9 | 114.82 |
| 2023-11-01 | 2023-11 | 2451.1 | 113.81 | 642.7 | 145.77 | 1860 | 123.7 | 1782.9 | 97.04 | 10778.1 | 114.61 | 1092.5 | 114.67 |
| 2023-12-01 | 2023-12 | 2449.8 | 113.75 | 643.6 | 145.97 | 1864.3 | 123.99 | 1784.8 | 97.15 | 10800.1 | 114.84 | 1091.2 | 114.54 |
| 2024-01-01 | 2024-01 | 2446.9 | 113.62 | 641.9 | 145.59 | 1860.8 | 123.76 | 1799.5 | 97.95 | 10807 | 114.91 | 1090.5 | 114.46 |
| 2024-02-01 | 2024-02 | 2444.6 | 113.51 | 639.8 | 145.11 | 1856.7 | 123.48 | 1789.4 | 97.4 | 10809.2 | 114.94 | 1090.2 | 114.43 |
| 2024-03-01 | 2024-03 | 2439.8 | 113.29 | 642 | 145.61 | 1856 | 123.44 | 1790.3 | 97.45 | 10790.1 | 114.73 | 1086.3 | 114.02 |
| 2024-04-01 | 2024-04 | 2441 | 113.35 | 643.9 | 146.04 | 1853.5 | 123.27 | 1787.3 | 97.28 | 10793.3 | 114.77 | 1085.2 | 113.91 |
| 2024-05-01 | 2024-05 | 2440.6 | 113.33 | 643.5 | 145.95 | 1859.3 | 123.66 | 1785.4 | 97.18 | 10817.6 | 115.03 | 1085.1 | 113.9 |
| 2024-06-01 | 2024-06 | 2444.7 | 113.52 | 644.2 | 146.11 | 1861.7 | 123.82 | 1800.4 | 98 | 10820.6 | 115.06 | 1088.8 | 114.29 |
| 2024-07-01 | 2024-07 | 2442.6 | 113.42 | 643.4 | 145.93 | 1862.2 | 123.85 | 1806.8 | 98.35 | 10805.9 | 114.9 | 1082.5 | 113.62 |
| 2024-08-01 | 2024-08 | 2437.2 | 113.17 | 641.7 | 145.54 | 1858.2 | 123.58 | 1816.4 | 98.87 | 10793.7 | 114.77 | 1082.7 | 113.65 |
| 2024-09-01 | 2024-09 | 2437.6 | 113.19 | 641.9 | 145.59 | 1857.3 | 123.52 | 1833.4 | 99.79 | 10795 | 114.79 | 1082.7 | 113.65 |
| 2024-10-01 | 2024-10 | 2433.4 | 112.99 | 646.9 | 146.72 | 1858.5 | 123.6 | 1830.5 | 99.64 | 10782.6 | 114.65 | 1080.4 | 113.4 |
| 2024-11-01 | 2024-11 | 2429.2 | 112.8 | 647.5 | 146.86 | 1862.3 | 123.86 | 1837 | 99.99 | 10788.3 | 114.71 | 1076.3 | 112.97 |
| 2024-12-01 | 2024-12 | 2431.4 | 112.9 | 651.4 | 147.74 | 1880 | 125.03 | 1840.1 | 100.16 | 10813.9 | 114.99 | 1079.7 | 113.33 |
| 2025-01-01 | 2025-01 | 2426.3 | 112.66 | 650.1 | 147.45 | 1859.2 | 123.65 | 1845.8 | 100.47 | 10792.7 | 114.76 | 1075.7 | 112.91 |
| 2025-02-01 | 2025-02 | 2416.7 | 112.22 | 652.2 | 147.92 | 1861.6 | 123.81 | 1845.6 | 100.46 | 10779.9 | 114.62 | 1070.2 | 112.33 |
| 2025-03-01 | 2025-03 | 2408.9 | 111.85 | 651.6 | 147.79 | 1864.3 | 123.99 | 1844.6 | 100.4 | 10782.3 | 114.65 | 1065.8 | 111.87 |
| 2025-04-01 | 2025-04 | 2411.3 | 111.97 | 650.6 | 147.56 | 1866.6 | 124.14 | 1849.6 | 100.67 | 10786.7 | 114.7 | 1067.7 | 112.07 |
| 2025-05-01 | 2025-05 | 2410.3 | 111.92 | 653.1 | 148.13 | 1864.3 | 123.99 | 1842.6 | 100.29 | 10783.8 | 114.67 | 1069.6 | 112.27 |
| 2025-06-01 | 2025-06 | 2399.9 | 111.44 | 652.7 | 148.04 | 1858.7 | 123.62 | 1840.1 | 100.16 | 10768 | 114.5 | 1066.8 | 111.98 |
| 2025-07-01 | 2025-07 | 2395.7 | 111.24 | 654.4 | 148.42 | 1859 | 123.64 | 1840.7 | 100.19 | 10772.5 | 114.55 | 1066.7 | 111.97 |
| 2025-08-01 | 2025-08 | 2394 | 111.16 | 656.3 | 148.85 | 1858.3 | 123.59 | 1836.7 | 99.97 | 10765.7 | 114.47 | 1066.5 | 111.94 |
| 2025-09-01 | 2025-09 | 2387.6 | 110.87 | 661.4 | 150.01 | 1860 | 123.7 | 1829 | 99.55 | 10760.6 | 114.42 | 1066 | 111.89 |
| 2025-10-01 | 2025-10 | 2379.7 | 110.5 | 657.6 | 149.15 | 1860 | 123.7 | 1818.9 | 99 | 10754.1 | 114.35 | 1066.3 | 111.92 |
| 2025-11-01 | 2025-11 | 2381.5 | 110.58 | 654.8 | 148.51 | 1868.3 | 124.26 | 1807 | 98.36 | 10790.8 | 114.74 | 1066.3 | 111.92 |
| 2025-12-01 | 2025-12 | 2380.6 | 110.54 | 656.8 | 148.97 | 1871.6 | 124.47 | 1806.1 | 98.31 | 10784.6 | 114.67 | 1066.8 | 111.98 |
| 2026-01-01 | 2026-01 | 2374.2 | 110.24 | 657.9 | 149.22 | 1871.1 | 124.44 | 1818.3 | 98.97 | 10790.4 | 114.74 | 1064.8 | 111.77 |
| 2026-02-01 | 2026-02 | 2379.1 | 110.47 | 656.6 | 148.92 | 1875.7 | 124.75 | 1800 | 97.98 | 10810 | 114.94 | 1066.1 | 111.9 |
| 2026-03-01 | 2026-03 | 2369.6 | 110.03 | 659.4 | 149.56 | 1875.2 | 124.71 | 1798.4 | 97.89 | 10795.6 | 114.79 | 1063.4 | 111.62 |
| 2026-04-01 | 2026-04 | 2369.5 | 110.03 | 659.8 | 149.65 | 1879.5 | 125 | 1807.1 | 98.36 | 10808.9 | 114.93 | 1062.8 | 111.56 |
| 2026-05-01 | 2026-05 | 2370 | 110.05 | 659.6 | 149.6 | 1878 | 124.9 | 1797.7 | 97.85 | 10815.8 | 115.01 | 1062.9 | 111.57 |
| 2026-06-01 | 2026-06 | 2369.2 | 110.01 | 659.7 | 149.63 | 1888.1 | 125.57 | 1812.3 | 98.64 | 10832.2 | 115.18 | 1063 | 111.58 |
| 2026-07-01 | 2026-07 | 2366.4 | 109.88 | — | — | 1886.6 | 125.47 | — | — | 10837.3 | 115.24 | — | — |
The boom peaked. The fee arrived anyway.
Indexed to January 2019, computer systems design payrolls climbed through the pandemic recovery, peaked near 2.48 million in late 2022, and have been giving jobs back ever since. By July 2026 they were 9.9 percent above January 2019 and 2.5 percent below January 2025. From July 2025 to July 2026 the industry shed another 1.2 percent. Custom programming, the slice most associated with outsourced software work, was 1.2 percent below its January 2025 level by June. That is a cooling industry being asked to pay a hotter price.
Software publishers are the exception that proves the split. Their payrolls are still about 50 percent above January 2019, and 1.5 percent above January 2025 as of June. Consulting is 25.5 percent above early 2019 and still edging up. Private colleges are the other way: 1.4 percent below January 2019 and 1.8 percent below January 2025. The professional-services sector as a whole is 15.2 percent larger than in 2019 and essentially flat since the start of 2025. A surcharge designed as if every H-1B workplace were a 2021 hiring frenzy is arriving after the frenzy in systems design has already broken.
None of that is a verdict on the 2025 proclamation, which a court blocked, or on the 2026 proposal, which has not taken effect. Layoffs in tech, higher interest rates, and a slower pace of non-AI software spending all happened in the same window. The honest statement is narrower and still useful. The industry most associated with H-1B staffing firms is already smaller than it was 18 months ago. Wages in that industry are not.
Average hourly earnings in H-1B-heavy industries

View exact chart values
| date | year_month | csd_ahe | soft_ahe | cons_ahe | pst_ahe |
|---|---|---|---|---|---|
| 2019-01-01 | 2019-01 | 48.17 | 59.87 | 41.69 | 42.04 |
| 2019-02-01 | 2019-02 | 48.18 | 59.75 | 41.6 | 42.09 |
| 2019-03-01 | 2019-03 | 48.7 | 60.09 | 41.51 | 42.19 |
| 2019-04-01 | 2019-04 | 48.65 | 59.85 | 41.34 | 42.21 |
| 2019-05-01 | 2019-05 | 48.88 | 59.57 | 41.38 | 42.38 |
| 2019-06-01 | 2019-06 | 48.83 | 59.52 | 41.5 | 42.49 |
| 2019-07-01 | 2019-07 | 48.88 | 59.33 | 41.7 | 42.67 |
| 2019-08-01 | 2019-08 | 48.96 | 59.09 | 41.79 | 42.82 |
| 2019-09-01 | 2019-09 | 49.05 | 56.24 | 42.11 | 42.89 |
| 2019-10-01 | 2019-10 | 48.87 | 56.29 | 41.96 | 42.87 |
| 2019-11-01 | 2019-11 | 48.92 | 56.29 | 42.13 | 43 |
| 2019-12-01 | 2019-12 | 48.92 | 56.43 | 42.19 | 43.09 |
| 2020-01-01 | 2020-01 | 48.91 | 57.62 | 42.44 | 43.14 |
| 2020-02-01 | 2020-02 | 48.82 | 56.97 | 42.55 | 43.27 |
| 2020-03-01 | 2020-03 | 48.93 | 56.34 | 42.63 | 43.34 |
| 2020-04-01 | 2020-04 | 48.87 | 55.92 | 43.04 | 43.61 |
| 2020-05-01 | 2020-05 | 49.13 | 56.38 | 43.07 | 43.45 |
| 2020-06-01 | 2020-06 | 49.1 | 55.77 | 43.27 | 43.43 |
| 2020-07-01 | 2020-07 | 49.31 | 57.04 | 43.31 | 43.55 |
| 2020-08-01 | 2020-08 | 49.49 | 56.74 | 43.85 | 43.79 |
| 2020-09-01 | 2020-09 | 49.64 | 55.65 | 44.03 | 43.94 |
| 2020-10-01 | 2020-10 | 49.93 | 57.56 | 43.9 | 44.14 |
| 2020-11-01 | 2020-11 | 50.11 | 55.67 | 43.76 | 44.28 |
| 2020-12-01 | 2020-12 | 50.32 | 55.82 | 43.96 | 44.43 |
| 2021-01-01 | 2021-01 | 50.5 | 56.39 | 43.48 | 44.5 |
| 2021-02-01 | 2021-02 | 50.63 | 56.44 | 43.73 | 44.74 |
| 2021-03-01 | 2021-03 | 50.66 | 56.09 | 43.92 | 44.55 |
| 2021-04-01 | 2021-04 | 50.99 | 56.23 | 43.84 | 44.84 |
| 2021-05-01 | 2021-05 | 51.23 | 54.35 | 44.36 | 45.08 |
| 2021-06-01 | 2021-06 | 51.48 | 54.33 | 44.55 | 45.36 |
| 2021-07-01 | 2021-07 | 52.25 | 55.6 | 44.83 | 45.54 |
| 2021-08-01 | 2021-08 | 52 | 54.16 | 44.69 | 45.55 |
| 2021-09-01 | 2021-09 | 52 | 54.4 | 44.9 | 45.68 |
| 2021-10-01 | 2021-10 | 52.88 | 54.27 | 45.33 | 46.31 |
| 2021-11-01 | 2021-11 | 53.05 | 54.04 | 45.28 | 46.44 |
| 2021-12-01 | 2021-12 | 53.43 | 54.63 | 45.55 | 46.59 |
| 2022-01-01 | 2022-01 | 53.97 | 53.36 | 45.48 | 47.32 |
| 2022-02-01 | 2022-02 | 54.66 | 53.13 | 46.17 | 47.54 |
| 2022-03-01 | 2022-03 | 54.79 | 53.11 | 45.6 | 47.64 |
| 2022-04-01 | 2022-04 | 55.38 | 54.31 | 46.2 | 48.06 |
| 2022-05-01 | 2022-05 | 55.49 | 55.26 | 45.95 | 48.17 |
| 2022-06-01 | 2022-06 | 55.87 | 55.85 | 46.29 | 48.27 |
| 2022-07-01 | 2022-07 | 55.89 | 55.59 | 46.31 | 48.44 |
| 2022-08-01 | 2022-08 | 55.81 | 56.45 | 46.51 | 48.61 |
| 2022-09-01 | 2022-09 | 56.06 | 57.25 | 46.35 | 48.78 |
| 2022-10-01 | 2022-10 | 56.03 | 56.92 | 46.42 | 48.86 |
| 2022-11-01 | 2022-11 | 56.03 | 56.77 | 46.97 | 49.16 |
| 2022-12-01 | 2022-12 | 55.75 | 57.57 | 46.96 | 48.91 |
| 2023-01-01 | 2023-01 | 56.2 | 58.37 | 47.66 | 49.83 |
| 2023-02-01 | 2023-02 | 56 | 58.84 | 47.84 | 49.8 |
| 2023-03-01 | 2023-03 | 56.12 | 59.11 | 48.53 | 49.97 |
| 2023-04-01 | 2023-04 | 56.05 | 58.51 | 48.84 | 50.13 |
| 2023-05-01 | 2023-05 | 56.06 | 58.74 | 49.06 | 50.2 |
| 2023-06-01 | 2023-06 | 55.95 | 59.59 | 48.55 | 50.26 |
| 2023-07-01 | 2023-07 | 56.55 | 59.06 | 49.24 | 50.79 |
| 2023-08-01 | 2023-08 | 56.34 | 59.16 | 49.17 | 50.42 |
| 2023-09-01 | 2023-09 | 56.2 | 59.54 | 49.41 | 50.52 |
| 2023-10-01 | 2023-10 | 56.5 | 60.37 | 49.62 | 50.68 |
| 2023-11-01 | 2023-11 | 56.2 | 60.69 | 49.55 | 50.71 |
| 2023-12-01 | 2023-12 | 56.61 | 60.64 | 49.74 | 50.48 |
| 2024-01-01 | 2024-01 | 57.11 | 60.47 | 50.23 | 51.04 |
| 2024-02-01 | 2024-02 | 57.08 | 60.22 | 50.09 | 51.04 |
| 2024-03-01 | 2024-03 | 57.45 | 60.5 | 50.22 | 51.3 |
| 2024-04-01 | 2024-04 | 58.01 | 60.89 | 50.19 | 51.53 |
| 2024-05-01 | 2024-05 | 58.01 | 61.14 | 50.35 | 51.68 |
| 2024-06-01 | 2024-06 | 58.62 | 61.5 | 50.41 | 51.96 |
| 2024-07-01 | 2024-07 | 59.06 | 62.56 | 50.5 | 52.2 |
| 2024-08-01 | 2024-08 | 59.45 | 62.3 | 50.3 | 52.18 |
| 2024-09-01 | 2024-09 | 59.76 | 62.58 | 50.58 | 52.58 |
| 2024-10-01 | 2024-10 | 59.9 | 64.2 | 51.06 | 52.77 |
| 2024-11-01 | 2024-11 | 60.42 | 63.56 | 50.76 | 52.99 |
| 2024-12-01 | 2024-12 | 60.64 | 63.87 | 51.32 | 53.2 |
| 2025-01-01 | 2025-01 | 60.59 | 63.92 | 50.81 | 53.36 |
| 2025-02-01 | 2025-02 | 60.95 | 64.26 | 50.86 | 53.51 |
| 2025-03-01 | 2025-03 | 61.29 | 64.54 | 50.6 | 53.66 |
| 2025-04-01 | 2025-04 | 61.21 | 65.29 | 50.44 | 53.75 |
| 2025-05-01 | 2025-05 | 61.58 | 64.85 | 50.3 | 53.98 |
| 2025-06-01 | 2025-06 | 61.86 | 64.51 | 50.68 | 54.17 |
| 2025-07-01 | 2025-07 | 61.78 | 64.68 | 50.83 | 54.35 |
| 2025-08-01 | 2025-08 | 62.19 | 65.13 | 51.18 | 54.57 |
| 2025-09-01 | 2025-09 | 63.07 | 64.93 | 51.36 | 54.79 |
| 2025-10-01 | 2025-10 | 63.05 | 65.16 | 51.09 | 54.96 |
| 2025-11-01 | 2025-11 | 62.87 | 64.97 | 51.38 | 54.95 |
| 2025-12-01 | 2025-12 | 63.05 | 65.33 | 51.2 | 55.04 |
| 2026-01-01 | 2026-01 | 62.86 | 65.63 | 51.69 | 55.34 |
| 2026-02-01 | 2026-02 | 63.34 | 66.1 | 51.71 | 55.63 |
| 2026-03-01 | 2026-03 | 63.12 | 66.28 | 51.55 | 55.58 |
| 2026-04-01 | 2026-04 | 62.75 | 67.13 | 51.7 | 55.72 |
| 2026-05-01 | 2026-05 | 63.28 | 66.47 | 51.61 | 55.8 |
| 2026-06-01 | 2026-06 | 63.69 | 66.77 | 51.63 | 55.91 |
The fee versus a year of pay
Average hourly earnings in computer systems design reached $63.69 in June 2026, up 5.1 percent since January 2025 and 32.2 percent since January 2019. Software publishers paid $66.77. Consulting paid $51.63. The broader professional-services sector paid $55.91. These are establishment averages, not H-1B wage attestations, and they are not adjusted for inflation. They are still the government's best monthly read on what these industries pay the people already on the books.
Multiply those hourly figures by 2,080 hours — a conventional full-time year — and the $103,265 fee is 78 percent of approximated average annual pay in computer systems design, 74 percent in software publishing, 89 percent across professional services, and 96 percent in consulting. That arithmetic is crude on purpose. It does not claim the typical H-1B worker earns the industry average, and it does not convert a one-time petition fee into a salary. It does show why DHS's own small-business analysis sounded alarmed. A surcharge that is in the same neighbourhood as a year of average pay is not a rounding error on a $2,000 filing. It is a decision to stop sponsoring, to offshore, or to concentrate sponsorship in the handful of firms that can write the cheque.
Pay has kept rising while headcount in systems design has fallen. That combination is the opposite of a market crying out for cheaper foreign labour in the aggregate. It is consistent with firms keeping higher-paid workers and hiring fewer people, with or without a visa lottery. Whether a six-figure fee would push the remaining hiring toward Americans, as Vice President J.D. Vance argues, or toward Bangalore and Vancouver, as Wharton's Britta Glennon's research on earlier restrictions suggests, is not a question the payroll survey can settle. It can only show the wage bill the fee would sit on top of.
Proposed $103,265 H-1B fee as a share of average annual pay

View exact chart values
| industry | hourly | as_of | annual_approx | fee_as_share_pct |
|---|---|---|---|---|
| Computer systems design and related | 63.69 | 2026-06-01 | 132475 | 78 |
| Software publishers | 66.77 | 2026-06-01 | 138882 | 74.4 |
| Management, scientific and technical consulting | 51.63 | 2026-06-01 | 107390 | 96.2 |
| Professional, scientific and technical services | 55.91 | 2026-06-01 | 116293 | 88.8 |
California still has the jobs. Texas has the growth.
The state numbers, which are not seasonally adjusted and should be read July-to-July, scramble the national story. In July 2026 California still had the largest computer-systems-design payroll among the nine states that publish the series here, at 315,000. That was 3.6 percent below July 2025 and 8.5 percent below July 2019. Massachusetts was down 3.0 percent on the year and 17.1 percent from July 2019. Illinois was down 4.1 percent on the year and 11.7 percent from 2019. New Jersey and Georgia also lost jobs over the past year.
Texas is the counterpoint: 292,000 jobs in July 2026, almost level with a year earlier and 44 percent above July 2019. Florida was up 7.0 percent on the year and 40 percent since 2019. Washington was slightly higher than a year earlier and 23 percent above 2019. New York was essentially unchanged on the year. The geography of H-1B use has always been coastal and Texan. The geography of recent job growth in this industry is Texan and Floridian. A national fee does not land on a national boom. It lands on California's shrinkage and Texas's plateau at the same price.
The state employment survey does not cover every state for this detailed industry, and these nine publishers are not a weighted national sample. They are, however, the places where an Infosys, a Google, or a university hospital is most likely to notice a six-figure invoice. If the policy works as advertised, the next year of these charts should show American hiring filling the hole in systems design. If it works as the offshoring research predicts, the hole simply moves. The payrolls will still be there to check.
Computer-systems payrolls in nine large states, July 2026

View exact chart values
| state | july_2026_thousands | july_2025_thousands | july_2019_thousands | yoy_pct | since_2019_july_pct |
|---|---|---|---|---|---|
| California | 314.7 | 326.5 | 344.1 | -3.6 | -8.5 |
| Texas | 291.5 | 291 | 203 | 0.2 | 43.6 |
| Florida | 148 | 138.3 | 105.5 | 7 | 40.3 |
| New York | 125.1 | 125 | 118.4 | 0.1 | 5.7 |
| Georgia | 81 | 85.2 | 73.2 | -4.9 | 10.7 |
| Illinois | 79.6 | 83 | 90.1 | -4.1 | -11.7 |
| New Jersey | 73.9 | 77.1 | 74.9 | -4.2 | -1.3 |
| Washington | 73 | 72.6 | 59.2 | 0.6 | 23.3 |
| Massachusetts | 71.4 | 73.6 | 86.1 | -3 | -17.1 |
Year-over-year change in computer-systems jobs, July 2025 to July 2026

View exact chart values
| state | yoy_pct | july_2026_thousands |
|---|---|---|
| Georgia | -4.9 | 81 |
| New Jersey | -4.2 | 73.9 |
| Illinois | -4.1 | 79.6 |
| California | -3.6 | 314.7 |
| Massachusetts | -3 | 71.4 |
| New York | 0.1 | 125.1 |
| Texas | 0.2 | 291.5 |
| Washington | 0.6 | 73 |
| Florida | 7 | 148 |
Sources and methods
This is retrospective enrichment using pinned local snapshots, not a reconstruction of what was knowable on the edition date of 25 August 2026. Calculations were run on 11 September 2026 against BLS Current Employment Statistics and State and Area Employment snapshots created 24 August 2026 (release identifiers bls-ce-snapshot-2026-08-24 and bls-sm-snapshot-2026-08-24). Later revisions may be present.
National series are seasonally adjusted monthly CES payrolls and average hourly earnings of all employees. Computer systems design and related services (NAICS 5415) and management consulting extend through July 2026; software publishers, custom computer programming, private colleges, and all wage series currently end in June 2026. Custom programming is a subset of computer systems design and related services and is not added to that total. Software publishers sit in the information supersector.
State figures are not seasonally adjusted statewide SAE employment in computer systems design and related services. Comparisons use July 2026 versus July 2025 and July 2019. The nine states are those with a usable monthly series in this extract; they are not a complete national map and do not sum to the CES national total.
Average annual pay is approximated as seasonally adjusted average hourly earnings times 2,080 hours. That is a full-time-year convention, not a measured annual salary, not an H-1B prevailing wage, and not a household income. CES does not identify visa status, nativity, or occupation mix within an industry. Missing observations were not treated as zero. No causal effect of the 2025 H-1B proclamation or the 2026 proposed rule is inferred from these descriptive comparisons.
Research completed 2026-09-11, for the August 25, 2026 news edition. This is retrospective analysis, not a reconstruction of information available that day.