Research
Texas already runs a thin Medicaid book. $9.8 billion is not a rounding error.
The $27 million question
Texas hospitals greeted the new fiscal year with an unusually specific number: $27 million a day in extra Medicaid funding, or about $9.8 billion over the next year, that the federal government has not approved. The money is not the ordinary Medicaid check that pays for a child’s clinic visit. It is the extra reimbursement Texas hospitals use to cover the gap between outdated state rates and actual costs, mostly through the Comprehensive Hospital Increase Reimbursement Program. Four million Texans are on Medicaid, most of them children. Harris Health’s chief executive called the Houston-area hit catastrophic. Governor Greg Abbott has already written Washington describing an economic gun to the head.
That dispute is about a particular financing pipeline, not about whether Texas has a Medicaid program. It does. The useful question for readers is how large the official Medicaid book already is, how it compares with other big states, and whether $9.8 billion is a rounding error next to the hospital economy that would have to absorb a cut. Those are accounting questions. They are not a verdict on who is right about hospital taxes.
What the official books actually count
The Bureau of Economic Analysis publishes annual state estimates of personal current transfer receipts for Medicaid. The series includes CHIP spending under title XIX of the Social Security Act. The unit is thousands of dollars. It is money counted as received by persons, not a CMS ledger of hospital supplemental payments, and it is not the CHIRP match that Texas hospitals say is frozen. Using it to size the $9.8 billion claim is a magnitude test, not a substitution of one dataset for the other.
Population comes from the same BEA personal-income accounts, in persons, so a per-person figure is a simple ratio: Medicaid transfers divided by residents. That is not a household average, not an enrollment rate, and not a measure of who is eligible. Hospital output is private hospital GDP by state, in millions of current dollars of value added. Household hospital spending is BEA personal consumption expenditures on hospital services. Jobs are BLS State and Area Employment counts for private hospitals, not seasonally adjusted annual averages. None of those series is a substitute for the withheld CHIRP dollars. Together they show the size of the system that would feel them.
A thinner transfer book, then a 2024 drop
In 2024, Texas Medicaid transfers were $45.95 billion. That is a large number until it is set beside the country. The United States booked $938.19 billion. Texas had 9.2 percent of the U.S. population and 4.9 percent of Medicaid transfers. Per person, Texas received $1,467; the national figure was $2,759, so Texas ran at 53 percent of the U.S. average. Those transfers were 2.1 percent of Texas personal income.
The gap is not new. Texas has sat below the national per-person line in every year of this extract, from 2000 through 2024. The more surprising move is recent. Texas transfers peaked at $56.89 billion in 2022, eased to $55.73 billion in 2023, then fell to $45.95 billion in 2024. Indexed to 2013, just before the Affordable Care Act’s coverage expansion took full effect in participating states, Texas stood at 156 in 2024 while the United States stood at 213. The extract does not say why 2024 fell. It does say the decline is in the books, and that it happened while the national series was still rising.
Texas Medicaid transfers per person stayed far below the U.S. average

View exact chart values
| year | tx_medicaid_billions | us_medicaid_billions | tx_per_capita | us_per_capita | tx_pop_millions |
|---|---|---|---|---|---|
| 2000 | 11.01 | 199.49 | 526 | 707 | 20.94 |
| 2001 | 12.08 | 227.26 | 567 | 797 | 21.32 |
| 2002 | 14 | 250.01 | 645 | 869 | 21.69 |
| 2003 | 15.18 | 264.53 | 689 | 912 | 22.03 |
| 2004 | 16.11 | 289.81 | 719 | 990 | 22.39 |
| 2005 | 18.1 | 304.41 | 794 | 1030 | 22.78 |
| 2006 | 17.71 | 299.1 | 758 | 1002 | 23.36 |
| 2007 | 21.09 | 324.19 | 885 | 1076 | 23.83 |
| 2008 | 21.11 | 338.33 | 868 | 1113 | 24.31 |
| 2009 | 23.82 | 369.61 | 960 | 1205 | 24.8 |
| 2010 | 26.69 | 396.87 | 1058 | 1283 | 25.24 |
| 2011 | 28.17 | 406.02 | 1099 | 1302 | 25.63 |
| 2012 | 27.68 | 417.54 | 1062 | 1328 | 26.05 |
| 2013 | 29.44 | 439.98 | 1114 | 1389 | 26.43 |
| 2014 | 32.49 | 490.87 | 1208 | 1538 | 26.9 |
| 2015 | 35.58 | 535.91 | 1299 | 1665 | 27.39 |
| 2016 | 38.52 | 562.78 | 1384 | 1735 | 27.83 |
| 2017 | 36.79 | 573.73 | 1305 | 1757 | 28.19 |
| 2018 | 39.06 | 589.77 | 1370 | 1795 | 28.51 |
| 2019 | 38.32 | 614.03 | 1328 | 1859 | 28.86 |
| 2020 | 42.56 | 657.58 | 1456 | 1983 | 29.24 |
| 2021 | 48.38 | 736.48 | 1636 | 2218 | 29.57 |
| 2022 | 56.89 | 814.35 | 1889 | 2438 | 30.12 |
| 2023 | 55.73 | 878.17 | 1814 | 2608 | 30.72 |
| 2024 | 45.95 | 938.19 | 1467 | 2759 | 31.32 |
Texas is not a small Medicaid state. It is a cheap one per person.
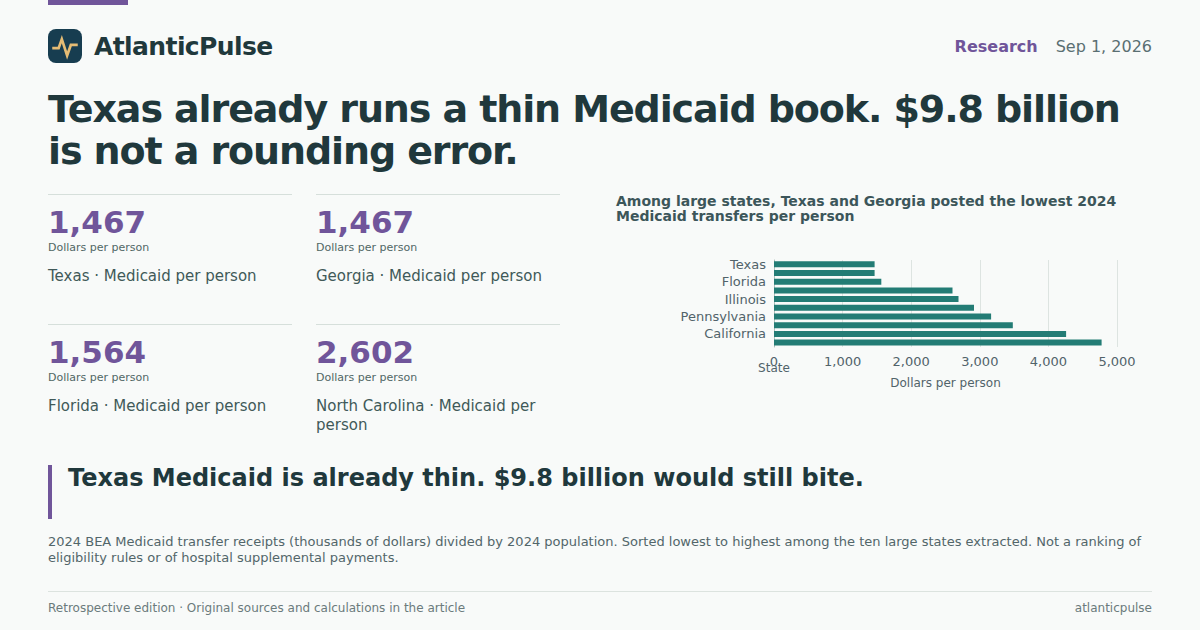
Among the ten large states extracted here, Texas ranked third in total 2024 transfers, behind California ($167.6 billion) and New York ($95.5 billion) and just ahead of Pennsylvania. Totals follow population. Per person, the ranking flips. Texas and Georgia both posted $1,467. Florida was $1,564. Then the field jumps: North Carolina $2,602, Illinois $2,689, Ohio $2,915, Pennsylvania $3,165, Minnesota $3,481, California $4,258, New York $4,775. Minnesota, whose own budget fight over accelerating Medicaid spending was in the same day’s news, still ran more than twice Texas’s per-person transfers.
The article from Texas hospitals named Florida as another state that refused to expand Medicaid under the Affordable Care Act and later had its own delay in extra hospital funding. In this BEA series, Florida looks like Texas: large population, modest per-person transfers. Georgia looks the same. That is a descriptive cluster, not proof that non-expansion is the only cause, and the extract does not classify expansion status. It is enough to say that the two states in the hospital story, Texas and Florida, already sit at the bottom of this per-person table.
Among large states, Texas and Georgia posted the lowest 2024 Medicaid transfers per person

View exact chart values
| state | medicaid_billions | per_capita | population_millions |
|---|---|---|---|
| Texas | 45.9 | 1467 | 31.32 |
| Georgia | 16.4 | 1467 | 11.2 |
| Florida | 36.4 | 1564 | 23.27 |
| North Carolina | 28.8 | 2602 | 11.05 |
| Illinois | 34.2 | 2689 | 12.7 |
| Ohio | 34.6 | 2915 | 11.86 |
| Pennsylvania | 41.3 | 3165 | 13.05 |
| Minnesota | 20.2 | 3481 | 5.8 |
| California | 167.6 | 4258 | 39.36 |
| New York | 95.5 | 4775 | 20 |
The hospital economy that would absorb a cut
Private hospital value added in Texas was $43.52 billion in 2024, or 1.6 percent of the state’s $2.77 trillion GDP. Household consumption of hospital services was much larger: $109.89 billion. Those two figures measure different things. GDP is value added inside hospital establishments. PCE is what households, through insurance and out-of-pocket payments, are counted as spending on hospital care. Medicaid transfers sit in a third ledger. In 2024 they were $45.95 billion, almost the same size as hospital GDP and well below hospital PCE. None of the three is hospital revenue, and none is CHIRP.
The payroll is not small. Texas private hospitals employed 378,100 people in 2025 on an annual-average basis, up 118,800 from 259,300 in 2005. The 2020–21 dip was brief. Jobs were already above the pre-pandemic line by 2022 and kept climbing through 2025, including through the 2024 drop in Medicaid transfers. Employment is not proof that hospitals can shrug off a funding freeze. It is proof that the industry that would have to cut, delay, or reshuffle is a 378,000-job corner of the Texas labor market, not a boutique.
Households already spend less on health care in Texas than in the rest of the country, at least on BEA’s per-person PCE measure. In 2024, health-care consumption per person was $7,807 in Texas against $9,747 nationally, $9,545 in Florida, $11,054 in California, and $12,221 in New York. Texas was at 80 percent of the U.S. average. A thinner Medicaid transfer book and a thinner household health-care bill are consistent with each other. They are not the same thing, and they do not tell you whether a given hospital in Lubbock or Houston can eat a $27 million-a-day shortfall.
Texas hospital payrolls kept growing even as 2024 Medicaid transfers fell

View exact chart values
| year | jobs_thousands |
|---|---|
| 2005 | 259.3 |
| 2006 | 263.8 |
| 2007 | 269.9 |
| 2008 | 276 |
| 2009 | 284.3 |
| 2010 | 290.6 |
| 2011 | 295.4 |
| 2012 | 301 |
| 2013 | 305 |
| 2014 | 306.7 |
| 2015 | 314.9 |
| 2016 | 323.9 |
| 2017 | 327.9 |
| 2018 | 329.2 |
| 2019 | 333.4 |
| 2020 | 329.2 |
| 2021 | 328 |
| 2022 | 335.7 |
| 2023 | 354.6 |
| 2024 | 368.9 |
| 2025 | 378.1 |
Household hospital spending in Texas is more than twice hospital value added

View exact chart values
| year | hospital_gdp_billions | hospital_pce_billions | medicaid_billions |
|---|---|---|---|
| 2000 | 13.07 | 26.21 | 11.01 |
| 2001 | 14.48 | 29.43 | 12.08 |
| 2002 | 16.11 | 33.32 | 14 |
| 2003 | 16.6 | 34.62 | 15.18 |
| 2004 | 17.28 | 36.88 | 16.11 |
| 2005 | 16.23 | 39.98 | 18.1 |
| 2006 | 17.22 | 42.65 | 17.71 |
| 2007 | 18.04 | 45.33 | 21.09 |
| 2008 | 19.67 | 48.7 | 21.11 |
| 2009 | 22.13 | 52.81 | 23.82 |
| 2010 | 23.16 | 55.42 | 26.69 |
| 2011 | 24.13 | 57.44 | 28.17 |
| 2012 | 24.85 | 61.02 | 27.68 |
| 2013 | 25.79 | 62.92 | 29.44 |
| 2014 | 26.78 | 66 | 32.49 |
| 2015 | 29 | 70.97 | 35.58 |
| 2016 | 30.08 | 72.88 | 38.52 |
| 2017 | 31.06 | 73.93 | 36.79 |
| 2018 | 31.98 | 76.16 | 39.06 |
| 2019 | 33.34 | 81.43 | 38.32 |
| 2020 | 34.13 | 78.09 | 42.56 |
| 2021 | 36.73 | 90.73 | 48.38 |
| 2022 | 37.71 | 95.12 | 56.89 |
| 2023 | 40.66 | 102.59 | 55.73 |
| 2024 | 43.52 | 109.89 | 45.95 |
How large is $9.8 billion next to that
Put the disputed extra funding on the same scale. $27 million a day annualizes to about $9.86 billion, matching the $9.8 billion figure hospitals are using. Against 2024 BEA stocks, that sum is 21.3 percent of Texas Medicaid transfers, 22.5 percent of private hospital GDP, and 8.9 percent of household hospital spending. Those percentages are ratios of unlike objects. CHIRP is a hospital rate supplement. BEA Medicaid is a transfer to persons. Hospital GDP is value added. Treating 21 percent as a precise hit to either ledger would be a category error. Treating $9.8 billion as small because Texas is a $2.8 trillion economy would be the opposite error.
On the hospital GDP ledger, $9.8 billion is more than one-fifth of what Texas hospitals produced in 2024. On the transfer ledger, it is more than one-fifth of all Medicaid money BEA attributes to Texas residents. Texas already collects about half the national Medicaid transfer per person and, in 2024, collected less than it did in 2022 and 2023. A further $9.8 billion withheld from hospital supplements is not a rounding error on that book. It is also not, in these data, a forecast of closures. The official series stop at describing size.
$9.8 billion is a large slice of Texas hospital value added — and of official Medicaid transfers

View exact chart values
| item | billions |
|---|---|
| Disputed extra Medicaid hospital funding | 9.8 |
| Texas BEA Medicaid transfers, 2024 | 45.9 |
| Texas hospital GDP, 2024 | 43.52 |
| Texas household hospital PCE, 2024 | 109.89 |
Sources and methods
This is retrospective enrichment using pinned local snapshots, not an as-known-on-2026-09-01 reconstruction. Research extracts were retrieved on 2026-09-11. The historical edition date is 2026-09-01. Later releases and revisions may be present in the snapshots.
Medicaid figures are BEA annual personal current transfer receipts for Medicaid, including CHIP under title XIX (SAINC35), in thousands of dollars, calendar years 2000–2024. The 2024 observation is the latest complete year in that series. Population is BEA SAINC1 persons; 2025 population exists in the snapshot but was not used as a Medicaid denominator because 2025 Medicaid is not in the extract. Per-person amounts are transfers divided by population, not household averages or enrollment rates.
State comparisons use 2024 values for Texas, California, Florida, New York, Pennsylvania, Ohio, Illinois, Georgia, North Carolina, and Minnesota. Dictionary presence of other states is not a claim that every state was extracted. Totals and per-person ranks apply only to this set.
Hospital GDP is BEA SAGDP2 private hospitals (NAICS 622), millions of current dollars, through 2024 in the calculated tables. Total GDP for Texas is available through 2025; hospital GDP for 2025 was not used because it was not present as a usable 2025 value in the calculation. Hospital PCE is BEA SAPCE3 household consumption of hospital services, millions of current dollars, through 2024. Per capita health-care PCE is SAPCE2, dollars, through 2024, covering outpatient plus hospital and nursing-home services, which is broader than hospitals alone.
Hospital jobs are BLS SAE series SMU48000006562200001, Texas statewide private hospitals, all employees in thousands, not seasonally adjusted annual averages, 2005–2025. Missing observations were not treated as zero. Duplicate SAE series IDs were not mixed; only this series was used.
The $9.8 billion and $27 million-a-day figures are from contemporaneous hospital-association reporting in the edition, not from BEA or BLS. Ratios of that reported sum to 2024 BEA stocks are descriptive magnitude comparisons. They do not identify CHIRP payments inside the BEA Medicaid series, do not convert aggregate dollars into hospital or household averages, and do not support causal claims about expansion policy, service cuts, or employment. Observed, estimated, and reported values are kept distinct. No seasonal adjustment was applied to annual series.
Research completed 2026-09-11, for the September 1, 2026 news edition. This is retrospective analysis, not a reconstruction of information available that day.
- BEA personal current transfer receipts, Medicaid: Source 1, Source 2
- BEA state population (persons): Source 1, Source 2
- BEA GDP by state, hospitals and all industries: Source 1, Source 2
- BEA personal consumption expenditures by state, hospitals and health care: Source 1, Source 2
- BLS State and Area Employment, Texas hospitals: Source 1, Source 2