Research
Phoenix’s shelters are full. Arizona’s housing bill already is, too.
The unofficial hotline
ProPublica’s reporting from Phoenix this week is grim in a very ordinary way. Family shelters around the metro are full. Nearly 200 families sat on the county waitlist in late September. The official count of people in homeless families reached 2,103 this year, the highest since 2015. Calling 211, the designated intake line, can mean months. Caseworkers, teachers and even the official system itself have been sending people to Austin Davis, a 26-year-old poet whose phone has become the backup plan. In a county of nearly five million, that is not a staffing quirk. It is a housing system that has already priced families out of the queue.
The question the official books can answer is not why any one family lost a lease. It is whether Arizona’s housing costs, construction payrolls and the tiny national emergency-housing workforce look like a market that still has slack — or like one that has already spent the slack and kept going. The data stop in 2024 for spending and prices, and in July 2026 for jobs. They do not count tents in parks. They do count the bill.
The housing line crossed the national average
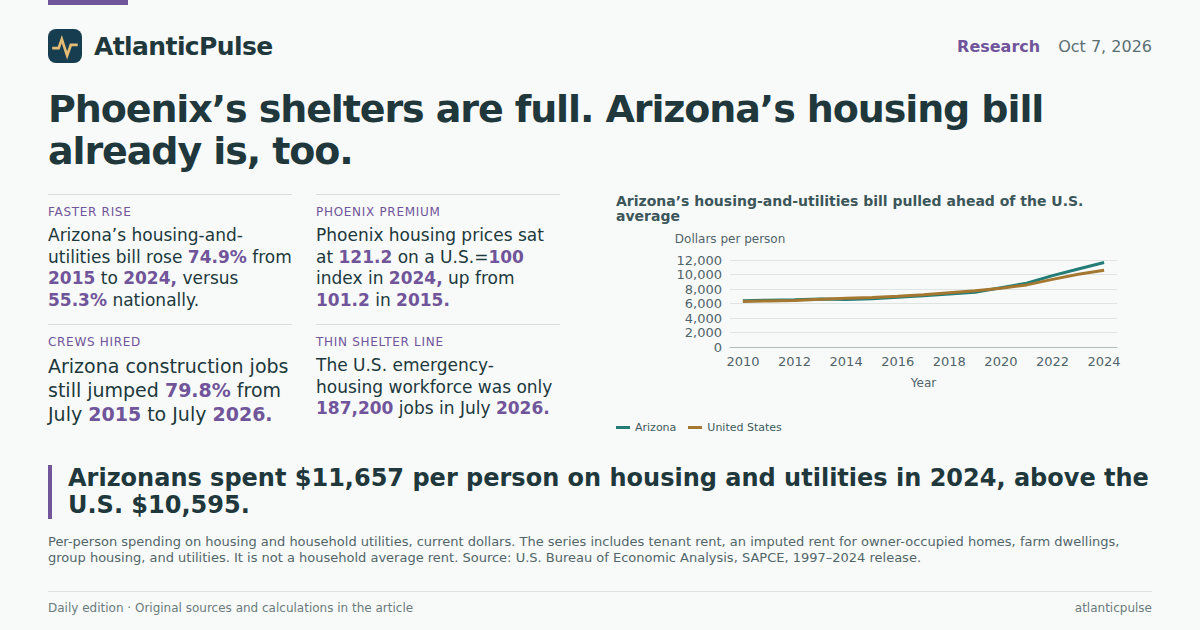
In 2015, Arizonans spent $6,664 per person on housing and household utilities, a little below the U.S. figure of $6,824. By 2024 that Arizona line had reached $11,657, against $10,595 for the country. That is a 74.9 percent increase in nine years, against 55.3 percent nationally. Housing and utilities now take 20.7 percent of Arizona’s per-person consumption, versus 18.1 percent in the United States. The gap opened after 2020 and did not close.
Those dollars are not a typical rent check. The Bureau of Economic Analysis includes tenant rent, an imputed rent for owner-occupied homes — what the house could have rented for — plus farm dwellings, group housing, water, electricity and gas. Owner-imputed rent still dominates: in 2024 it was $61.2 billion in Arizona against $17.0 billion of tenant rent, a 21.8 percent tenant share, close to the U.S. 23.8 percent. The cash crisis in a storage unit and the imputed rent on a paid-off house live in the same total. That is a feature of the accounts, not a reason to ignore them. A state whose housing bill is rising faster than the nation’s is not a cheap desert anymore, even if much of the bill is an accounting rent on houses people already own.
Compared with neighbors in 2024, Arizona is no longer the bargain bin. New Mexico spent $8,880 per person on housing and utilities. Texas spent $9,999. Nevada spent $10,974. California spent $12,842. Arizona sits above Nevada and the national average, below only California in that set. The same year’s housing price parities, estimated from tenant-occupied housing and indexed so the United States is about 100, put New Mexico at 73.6, Texas at 96.5, Arizona at 106.8, Nevada at 114.1 and California at 154.3.
Arizona’s housing-and-utilities bill pulled ahead of the U.S. average

View exact chart values
| year | az_housing_pc | us_housing_pc | az_share_pct | us_share_pct | az_index_2015 | us_index_2015 |
|---|---|---|---|---|---|---|
| 2010 | 6392 | 6296 | 20.8 | 19 | 95.9 | 92.3 |
| 2011 | 6452 | 6360 | 20.4 | 18.5 | 96.8 | 93.2 |
| 2012 | 6525 | 6409 | 20.2 | 18.2 | 97.9 | 93.9 |
| 2013 | 6628 | 6585 | 20 | 18.3 | 99.5 | 96.5 |
| 2014 | 6533 | 6722 | 19.2 | 18.1 | 98 | 98.5 |
| 2015 | 6664 | 6824 | 19 | 17.9 | 100 | 100 |
| 2016 | 6856 | 6996 | 19.1 | 17.8 | 102.9 | 102.5 |
| 2017 | 7066 | 7196 | 18.7 | 17.7 | 106 | 105.5 |
| 2018 | 7317 | 7486 | 18.6 | 17.6 | 109.8 | 109.7 |
| 2019 | 7558 | 7758 | 18.6 | 17.7 | 113.4 | 113.7 |
| 2020 | 8185 | 8106 | 20.1 | 18.9 | 122.8 | 118.8 |
| 2021 | 8780 | 8560 | 19 | 17.6 | 131.8 | 125.4 |
| 2022 | 9855 | 9324 | 19.5 | 17.6 | 147.9 | 136.6 |
| 2023 | 10763 | 10022 | 20.1 | 17.9 | 161.5 | 146.9 |
| 2024 | 11657 | 10595 | 20.7 | 18.1 | 174.9 | 155.3 |
In 2024 Arizona spent more per person on housing than Texas, Nevada or the U.S.

View exact chart values
| state | housing_pc | housing_rpp |
|---|---|---|
| New Mexico | 8880 | 73.6 |
| Texas | 9999 | 96.5 |
| United States | 10595 | 100.6 |
| Nevada | 10974 | 114.1 |
| Arizona | 11657 | 106.8 |
| California | 12842 | 154.3 |
Phoenix is the expensive part of an already dearer state
Statewide Arizona was cheaper than the nation on housing as recently as 2015, when its housing regional price parity was 93.8. By 2024 it was 106.8. The Phoenix-Mesa-Chandler metro, where Davis’s park meals and hotel rooms are concentrated, moved from 101.2 to 121.2. A fifth above the national housing price level is not “the cheap Sun Belt.” It is a metro that has repriced itself while the county’s family-shelter waitlist filled up.
Real incomes did not close that gap. Arizona’s real per capita personal income, in 2017 dollars, was $52,890 in 2024, against $59,195 for the United States. Arizona’s real income rose 26.0 percent from 2015; the nation’s rose 19.8 percent. That is catch-up on a lower base, not a surplus. Put the current-dollar housing bill next to those real incomes and Arizona’s housing-and-utilities spending equaled 22.0 percent of real per capita income in 2024, against 17.9 percent nationally. The comparison mixes current dollars with inflation-adjusted income, so it is a ratio, not a budget share. It still points the same direction as the consumption accounts: housing is taking more of what Arizonans have.
Phoenix housing prices moved from about average to more than a fifth above the nation

View exact chart values
| year | arizona | phoenix | united_states | nevada | new_mexico | california |
|---|---|---|---|---|---|---|
| 2010 | 96.9 | 103 | 100.4 | — | — | — |
| 2011 | 94.8 | 103 | 100.4 | — | — | — |
| 2012 | 95.2 | 102.7 | 100.4 | — | — | — |
| 2013 | 93.6 | 100 | 100.4 | — | — | — |
| 2014 | 92.7 | 101.4 | 100.4 | — | — | — |
| 2015 | 93.8 | 101.2 | 100.4 | 98.7 | 78.8 | 158 |
| 2016 | 92.4 | 100.6 | 100.4 | 97.8 | 79.3 | 160.1 |
| 2017 | 93.5 | 103.3 | 100.4 | 100.2 | 77.9 | 162.5 |
| 2018 | 94.3 | 104.4 | 100.4 | 102.6 | 75.1 | 163.8 |
| 2019 | 93.6 | 106.4 | 100.4 | 105.6 | 74 | 164.6 |
| 2020 | 97.9 | 111.2 | 100.6 | 105.9 | 75.4 | 166.3 |
| 2021 | 102.3 | 116.1 | 100.6 | 107.9 | 72.9 | 165 |
| 2022 | 106.2 | 122.8 | 100.6 | 111.7 | 75.7 | 160.1 |
| 2023 | 108.6 | 124.3 | 100.6 | 113.3 | 75.2 | 157.8 |
| 2024 | 106.8 | 121.2 | 100.6 | 114.1 | 73.6 | 154.3 |
The crews showed up. The waitlist did too.
If the story were simply that Arizona forgot to build, the payrolls would show it. They do not. Arizona construction employment, seasonally adjusted, rose from 126,300 in July 2015 to 227,100 in July 2026 — a 79.8 percent increase. Total nonfarm jobs in the state rose 24.8 percent over the same span, from 2.63 million to 3.29 million. Construction’s share of the state’s payroll went from 4.80 percent to 6.91 percent. In Phoenix-Mesa-Chandler, the annual average of not-seasonally-adjusted construction jobs climbed from 97,600 in 2015 to 179,700 in 2025.
That is a boom by any payroll test. It is also not a family shelter. Construction employment counts people pouring slabs and hanging drywall, including commercial and infrastructure work. It does not tell you the rent on a two-bedroom in Mesa, whether those units are priced for a school employee, or how many emergency beds UMOM set aside when the temperature hit 117 degrees. The books can say the crews were hired. They cannot say the waitlist should have gone to zero. Treating a 80 percent jump in construction jobs as proof that housing got cheaper is the sort of leap the accounts do not support — and the 2024 spending figures contradict.
Arizona construction payrolls grew much faster than the rest of the job market

View exact chart values
| year | period | az_construction_thousands | az_nonfarm_thousands | az_const_share_pct | phoenix_nonfarm_thousands | phoenix_const_annual_avg |
|---|---|---|---|---|---|---|
| 2015 | 2015-07 | 126.3 | 2631.9 | 4.8 | 1913.9 | 97.6 |
| 2016 | 2016-07 | 135.2 | 2717.3 | 4.98 | 1987 | 104 |
| 2017 | 2017-07 | 145.3 | 2779.1 | 5.23 | 2042.7 | 112.4 |
| 2018 | 2018-07 | 157.8 | 2859 | 5.52 | 2108.8 | 123 |
| 2019 | 2019-07 | 170.9 | 2936.3 | 5.82 | 2175.4 | 133.1 |
| 2020 | 2020-07 | 171.4 | 2786.7 | 6.15 | 2069.3 | 135.6 |
| 2021 | 2021-07 | 179.4 | 2985.1 | 6.01 | 2224.6 | 140.2 |
| 2022 | 2022-07 | 197 | 3122.9 | 6.31 | 2341.6 | 154 |
| 2023 | 2023-07 | 215.7 | 3210.4 | 6.72 | 2414.9 | 170 |
| 2024 | 2024-07 | 225.8 | 3255.9 | 6.94 | 2453.8 | 182.1 |
| 2025 | 2025-07 | 223.8 | 3262.7 | 6.86 | 2462.2 | 179.7 |
| 2026 | 2026-07 | 227.1 | 3285.8 | 6.91 | 2484.8 | — |
The workforce on the other end of 211
The people who answer the official channel are a thin line even at the national scale. U.S. employment in community housing, emergency, and relief services was 123,300 in July 2015 and 187,200 in July 2026, seasonally adjusted. Add community food programs and the broader industry still employed only 236,600 people last July. That is smaller than Arizona’s construction payroll alone. These are national counts; the extract does not isolate Maricopa County’s shelter staff. They are still the right order of magnitude for the system Davis is substituting for: a specialized workforce that grew, then flattened, and remains tiny next to the housing bill.
None of this proves that a 45-day data-center moratorium, a gas-tax holiday, or a poet in a park caused or cured family homelessness. It does show why a full shelter and a months-long 211 wait are not mysterious in 2026 Arizona. The state spent more per person on housing than the nation. Phoenix’s tenant-based housing prices sit more than 20 percent above the U.S. level. Real incomes remain lower than the national average. Construction jobs multiplied and still did not buy a cheap metro. And the official emergency-housing workforce, even counted for the entire country, would not fill a modest football stadium. Davis’s phone is not a parallel government. It is what you get when the housing accounts have already moved and the intake line has not.
The national emergency-housing workforce is still smaller than a mid-size city payroll

View exact chart values
| year | period | community_food_housing_relief_thousands | community_housing_emergency_thousands |
|---|---|---|---|
| 2010 | 2010-07 | 142.6 | 114.1 |
| 2011 | 2011-07 | 145.3 | 114.6 |
| 2012 | 2012-07 | 144 | 114.1 |
| 2013 | 2013-07 | 145.7 | 116 |
| 2014 | 2014-07 | 151 | 120.3 |
| 2015 | 2015-07 | 156.3 | 123.3 |
| 2016 | 2016-07 | 161.5 | 125.7 |
| 2017 | 2017-07 | 168.8 | 133.6 |
| 2018 | 2018-07 | 175.5 | 139.5 |
| 2019 | 2019-07 | 185.5 | 149.2 |
| 2020 | 2020-07 | 188.4 | 149.6 |
| 2021 | 2021-07 | 190.3 | 149.1 |
| 2022 | 2022-07 | 202.5 | 158.6 |
| 2023 | 2023-07 | 221.5 | 171.9 |
| 2024 | 2024-07 | 234.6 | 183.8 |
| 2025 | 2025-07 | 234.2 | 186.1 |
| 2026 | 2026-07 | 236.6 | 187.2 |
Sources and methods
Spending and price figures are annual BEA state personal consumption expenditures (SAPCE, 1997–2024 release) and regional price parities (SARPP/MARPP, 2008–2024). Jobs are BLS State and Area Employment and Current Employment Statistics from a snapshot through July 2026. Observation years are calendar years or July months as labeled; they are not current-day readings.
Housing and utilities PCE is per person in current dollars. It includes tenant rent, imputed rental of owner-occupied housing, farm dwellings, group housing, and household utilities. It is not a household average rent and is not cash rent paid by homeless families. Tenant and owner-imputed series are millions of current dollars; their shares are of those two components only.
Housing RPPs are indexes relative to the United States. BEA estimates housing price levels from tenant-occupied housing. Statewide Arizona and Phoenix-Mesa-Chandler metro series are not interchangeable. Real per capita personal income is in constant 2017 dollars; ratios of current-dollar housing PCE to real income are descriptive, not a true budget share.
Arizona construction and total nonfarm jobs are seasonally adjusted statewide July snapshots. Phoenix construction figures used in the text are not-seasonally-adjusted annual averages; 2026 annual averages were not yet in the extract. Community housing, emergency, and relief services employment is a national CES series and is not Arizona-specific. Missing observations were not treated as zero. Duplicate period keys kept the first observation. No causal effect is inferred from these comparisons.
Research completed 2026-10-08, for the October 7, 2026 news edition. The available source data may cover earlier periods; see the observation periods and source vintages above.