Research
One-Third Missing: The Payroll Math Behind the Pentagon's 'Significant Lead Time' Warning
The war report read like an invoice. The payrolls read like a capacity problem.
The Pentagon's first inspector general review of Operation Epic Fury arrived on Tuesday as a document about money: $33.4 billion spent through June 29, $22.3 billion of it in expended munitions, $3.7 billion in destroyed equipment, up to 30 MQ-9 Reapers gone, an F-35A damaged by enemy fire (Sunday Guardian). A day later the Congressional Budget Office put the war's direct cost at $38 billion through July, running at $2–3 billion a month (Roll Call). But buried in both assessments is a less dollar-shaped finding: the watchdog's language about "strategic inventory shortfalls" and "industrial base bottlenecks" — solid rocket motors, high-grade explosives, skilled manufacturing workers — and its admission that the defense industrial base needs "significant lead time" to rebuild what the war consumed.
"Significant lead time" is one of those phrases that sounds like bureaucracy and is actually a claim about people. Missiles and aircraft are not rebuilt by appropriations alone; they are built by workers at factories, and the official record of that workforce is kept in the Bureau of Labor Statistics' Current Employment Statistics (BLS CES). So we pulled the full payroll history for the industries that would do this rebuilding — aerospace products and parts overall, and its aircraft, engine, other-parts and guided-missile segments — and asked a simple question: how big is the factory workforce that would have to replace what 16 months of war consumed?
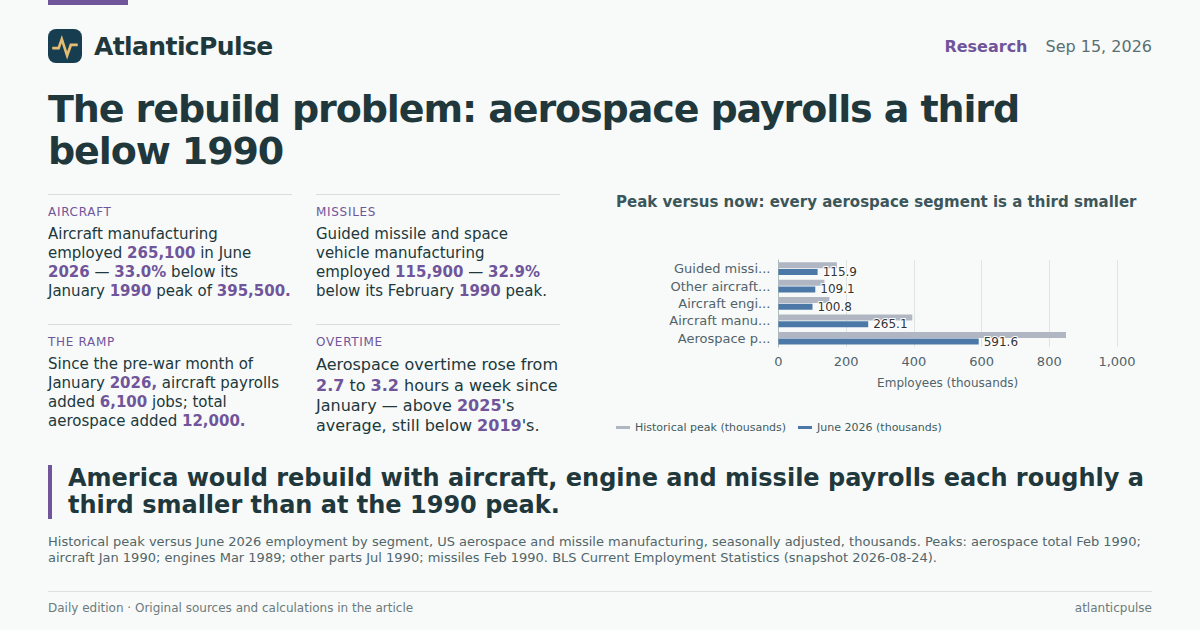
The answer is: the smallest it has been in the modern record. Total US aerospace manufacturing employment peaked at 849,500 in February 1990. In June 2026 it stood at 591,600 — about 30 percent below that peak. And this is after four years of genuinely strong hiring; the problem is where the industry started the climb.
The aircraft-building workforce America would rebuild with

View exact chart values
| date | aerospace_thousands |
|---|---|
| 1990-01 | 849.3 |
| 1990-02 | 849.5 |
| 1990-03 | 847.3 |
| 1990-04 | 848.2 |
| 1990-05 | 848.6 |
| 1990-06 | 849.4 |
| 1990-07 | 846.1 |
| 1990-08 | 839.8 |
| 1990-09 | 835 |
| 1990-10 | 829.8 |
| 1990-11 | 824.2 |
| 1990-12 | 821.4 |
| 1991-01 | 818.4 |
| 1991-02 | 808.5 |
| 1991-03 | 803.8 |
| 1991-04 | 797.1 |
| 1991-05 | 791.7 |
| 1991-06 | 784.2 |
| 1991-07 | 779.2 |
| 1991-08 | 775.3 |
| 1991-09 | 769.5 |
| 1991-10 | 765.1 |
| 1991-11 | 759.6 |
| 1991-12 | 754.8 |
| 1992-01 | 750.6 |
| 1992-02 | 742.6 |
| 1992-03 | 736.3 |
| 1992-04 | 726.4 |
| 1992-05 | 721.6 |
| 1992-06 | 715.4 |
| 1992-07 | 709.3 |
| 1992-08 | 700.1 |
| 1992-09 | 692.2 |
| 1992-10 | 683.5 |
| 1992-11 | 677.1 |
| 1992-12 | 671.2 |
| 1993-01 | 663.7 |
| 1993-02 | 658.2 |
| 1993-03 | 650.3 |
| 1993-04 | 643.5 |
| 1993-05 | 634.3 |
| 1993-06 | 626.3 |
| 1993-07 | 618.9 |
| 1993-08 | 610.8 |
| 1993-09 | 607.6 |
| 1993-10 | 600.3 |
| 1993-11 | 591.8 |
| 1993-12 | 582.3 |
| 1994-01 | 576.4 |
| 1994-02 | 569.8 |
| 1994-03 | 565 |
| 1994-04 | 559.4 |
| 1994-05 | 556.9 |
| 1994-06 | 552.3 |
| 1994-07 | 547 |
| 1994-08 | 544.5 |
| 1994-09 | 541.3 |
| 1994-10 | 539.5 |
| 1994-11 | 537.3 |
| 1994-12 | 535.6 |
| 1995-01 | 532.4 |
| 1995-02 | 529.6 |
| 1995-03 | 528.4 |
| 1995-04 | 526.6 |
| 1995-05 | 523.5 |
| 1995-06 | 520.6 |
| 1995-07 | 514.1 |
| 1995-08 | 512.5 |
| 1995-09 | 510.6 |
| 1995-10 | 486.6 |
| 1995-11 | 480.5 |
| 1995-12 | 506.9 |
| 1996-01 | 508.1 |
| 1996-02 | 508.3 |
| 1996-03 | 508.5 |
| 1996-04 | 509.5 |
| 1996-05 | 511.4 |
| 1996-06 | 506.6 |
| 1996-07 | 511.1 |
| 1996-08 | 512.1 |
| 1996-09 | 514.9 |
| 1996-10 | 523.1 |
| 1996-11 | 526.7 |
| 1996-12 | 529.3 |
| 1997-01 | 533.1 |
| 1997-02 | 537.4 |
| 1997-03 | 540.6 |
| 1997-04 | 545.3 |
| 1997-05 | 548.7 |
| 1997-06 | 553.9 |
| 1997-07 | 558.2 |
| 1997-08 | 562.5 |
| 1997-09 | 564.8 |
| 1997-10 | 568.5 |
| 1997-11 | 571.3 |
| 1997-12 | 574.5 |
| 1998-01 | 576.1 |
| 1998-02 | 579.2 |
| 1998-03 | 579.7 |
| 1998-04 | 580.6 |
| 1998-05 | 580.5 |
| 1998-06 | 580.2 |
| 1998-07 | 581 |
| 1998-08 | 580.1 |
| 1998-09 | 578.6 |
| 1998-10 | 577.8 |
| 1998-11 | 575.6 |
| 1998-12 | 573.2 |
| 1999-01 | 571 |
| 1999-02 | 565.5 |
| 1999-03 | 564.8 |
| 1999-04 | 556.8 |
| 1999-05 | 553 |
| 1999-06 | 548.2 |
| 1999-07 | 543.9 |
| 1999-08 | 539.8 |
| 1999-09 | 535.3 |
| 1999-10 | 531.5 |
| 1999-11 | 529 |
| 1999-12 | 526.5 |
| 2000-01 | 526.7 |
| 2000-02 | 510.9 |
| 2000-03 | 524.5 |
| 2000-04 | 521.5 |
| 2000-05 | 520.9 |
| 2000-06 | 519.5 |
| 2000-07 | 516.7 |
| 2000-08 | 513.3 |
| 2000-09 | 510.3 |
| 2000-10 | 511.2 |
| 2000-11 | 511.3 |
| 2000-12 | 513.1 |
| 2001-01 | 511 |
| 2001-02 | 512.3 |
| 2001-03 | 513.2 |
| 2001-04 | 513.4 |
| 2001-05 | 513.8 |
| 2001-06 | 514.6 |
| 2001-07 | 513.4 |
| 2001-08 | 514.1 |
| 2001-09 | 513.3 |
| 2001-10 | 510.7 |
| 2001-11 | 504.4 |
| 2001-12 | 496.2 |
| 2002-01 | 491.8 |
| 2002-02 | 485.8 |
| 2002-03 | 478.9 |
| 2002-04 | 473.7 |
| 2002-05 | 473.7 |
| 2002-06 | 469.9 |
| 2002-07 | 468.1 |
| 2002-08 | 468.4 |
| 2002-09 | 462.4 |
| 2002-10 | 459.7 |
| 2002-11 | 455.9 |
| 2002-12 | 454.7 |
| 2003-01 | 453.5 |
| 2003-02 | 452.5 |
| 2003-03 | 447.8 |
| 2003-04 | 447.7 |
| 2003-05 | 445.7 |
| 2003-06 | 440.6 |
| 2003-07 | 438.4 |
| 2003-08 | 436.2 |
| 2003-09 | 435.3 |
| 2003-10 | 436.1 |
| 2003-11 | 435.7 |
| 2003-12 | 435 |
| 2004-01 | 436.2 |
| 2004-02 | 436 |
| 2004-03 | 438 |
| 2004-04 | 439.6 |
| 2004-05 | 438.6 |
| 2004-06 | 440.5 |
| 2004-07 | 441.9 |
| 2004-08 | 443.9 |
| 2004-09 | 443.9 |
| 2004-10 | 443.9 |
| 2004-11 | 447 |
| 2004-12 | 448.9 |
| 2005-01 | 446.3 |
| 2005-02 | 449.3 |
| 2005-03 | 450.4 |
| 2005-04 | 452.7 |
| 2005-05 | 455.2 |
| 2005-06 | 457.4 |
| 2005-07 | 459.7 |
| 2005-08 | 459.7 |
| 2005-09 | 442 |
| 2005-10 | 460.6 |
| 2005-11 | 461.9 |
| 2005-12 | 465.3 |
| 2006-01 | 465.7 |
| 2006-02 | 469.1 |
| 2006-03 | 467 |
| 2006-04 | 471 |
| 2006-05 | 472 |
| 2006-06 | 474.2 |
| 2006-07 | 474.9 |
| 2006-08 | 475.9 |
| 2006-09 | 479.2 |
| 2006-10 | 481.2 |
| 2006-11 | 478.7 |
| 2006-12 | 479.1 |
| 2007-01 | 481.4 |
| 2007-02 | 485.2 |
| 2007-03 | 484 |
| 2007-04 | 483.5 |
| 2007-05 | 485.6 |
| 2007-06 | 487.3 |
| 2007-07 | 488.2 |
| 2007-08 | 491.4 |
| 2007-09 | 492.3 |
| 2007-10 | 494.1 |
| 2007-11 | 497.6 |
| 2007-12 | 498.5 |
| 2008-01 | 502.7 |
| 2008-02 | 501.3 |
| 2008-03 | 503.9 |
| 2008-04 | 506.9 |
| 2008-05 | 509.9 |
| 2008-06 | 511.8 |
| 2008-07 | 510.1 |
| 2008-08 | 507.4 |
| 2008-09 | 512.7 |
| 2008-10 | 486.1 |
| 2008-11 | 512 |
| 2008-12 | 512.4 |
| 2009-01 | 509.9 |
| 2009-02 | 508.4 |
| 2009-03 | 506.4 |
| 2009-04 | 500.4 |
| 2009-05 | 496.3 |
| 2009-06 | 491.1 |
| 2009-07 | 487.8 |
| 2009-08 | 483.8 |
| 2009-09 | 483.5 |
| 2009-10 | 482.4 |
| 2009-11 | 479.1 |
| 2009-12 | 478 |
| 2010-01 | 480.6 |
| 2010-02 | 478 |
| 2010-03 | 477.8 |
| 2010-04 | 477.5 |
| 2010-05 | 476.5 |
| 2010-06 | 475.8 |
| 2010-07 | 477 |
| 2010-08 | 478.1 |
| 2010-09 | 478.2 |
| 2010-10 | 477.7 |
| 2010-11 | 478.4 |
| 2010-12 | 477.8 |
| 2011-01 | 479.6 |
| 2011-02 | 480.1 |
| 2011-03 | 482 |
| 2011-04 | 482.6 |
| 2011-05 | 483 |
| 2011-06 | 486.4 |
| 2011-07 | 488.7 |
| 2011-08 | 489.9 |
| 2011-09 | 490.8 |
| 2011-10 | 491.6 |
| 2011-11 | 492.1 |
| 2011-12 | 493.1 |
| 2012-01 | 493.6 |
| 2012-02 | 494.2 |
| 2012-03 | 494 |
| 2012-04 | 495.9 |
| 2012-05 | 493.8 |
| 2012-06 | 495.6 |
| 2012-07 | 499.9 |
| 2012-08 | 501 |
| 2012-09 | 502.2 |
| 2012-10 | 503.5 |
| 2012-11 | 504 |
| 2012-12 | 504.9 |
| 2013-01 | 503.8 |
| 2013-02 | 503.6 |
| 2013-03 | 502.5 |
| 2013-04 | 501.4 |
| 2013-05 | 499.7 |
| 2013-06 | 497.1 |
| 2013-07 | 487.5 |
| 2013-08 | 490.4 |
| 2013-09 | 489.8 |
| 2013-10 | 489.4 |
| 2013-11 | 489.2 |
| 2013-12 | 490 |
| 2014-01 | 489.6 |
| 2014-02 | 489 |
| 2014-03 | 490.4 |
| 2014-04 | 492.9 |
| 2014-05 | 492.3 |
| 2014-06 | 492.3 |
| 2014-07 | 490.8 |
| 2014-08 | 490.9 |
| 2014-09 | 489.6 |
| 2014-10 | 489.6 |
| 2014-11 | 489.7 |
| 2014-12 | 488.9 |
| 2015-01 | 487.5 |
| 2015-02 | 491.4 |
| 2015-03 | 491.6 |
| 2015-04 | 489.4 |
| 2015-05 | 488.8 |
| 2015-06 | 488.4 |
| 2015-07 | 488.7 |
| 2015-08 | 489.3 |
| 2015-09 | 491.1 |
| 2015-10 | 490.7 |
| 2015-11 | 491.6 |
| 2015-12 | 491.4 |
| 2016-01 | 491.7 |
| 2016-02 | 491.6 |
| 2016-03 | 492.4 |
| 2016-04 | 493.2 |
| 2016-05 | 492.6 |
| 2016-06 | 489.8 |
| 2016-07 | 492.3 |
| 2016-08 | 490.6 |
| 2016-09 | 489.6 |
| 2016-10 | 488.8 |
| 2016-11 | 486.8 |
| 2016-12 | 484.4 |
| 2017-01 | 485.5 |
| 2017-02 | 486.5 |
| 2017-03 | 485.8 |
| 2017-04 | 485.4 |
| 2017-05 | 485.4 |
| 2017-06 | 486.9 |
| 2017-07 | 488 |
| 2017-08 | 488.6 |
| 2017-09 | 489.9 |
| 2017-10 | 489.6 |
| 2017-11 | 491.2 |
| 2017-12 | 493.2 |
| 2018-01 | 495.3 |
| 2018-02 | 495.6 |
| 2018-03 | 497.6 |
| 2018-04 | 498.3 |
| 2018-05 | 502 |
| 2018-06 | 505.6 |
| 2018-07 | 508.5 |
| 2018-08 | 513.5 |
| 2018-09 | 516.5 |
| 2018-10 | 519.4 |
| 2018-11 | 523 |
| 2018-12 | 524 |
| 2019-01 | 525.5 |
| 2019-02 | 527.2 |
| 2019-03 | 527.8 |
| 2019-04 | 529.8 |
| 2019-05 | 532.7 |
| 2019-06 | 534 |
| 2019-07 | 536.3 |
| 2019-08 | 536.9 |
| 2019-09 | 538.4 |
| 2019-10 | 540.6 |
| 2019-11 | 540.8 |
| 2019-12 | 543 |
| 2020-01 | 541.6 |
| 2020-02 | 540.3 |
| 2020-03 | 540.6 |
| 2020-04 | 518.9 |
| 2020-05 | 514.5 |
| 2020-06 | 503 |
| 2020-07 | 502.1 |
| 2020-08 | 495.5 |
| 2020-09 | 489.8 |
| 2020-10 | 482 |
| 2020-11 | 480 |
| 2020-12 | 476.2 |
| 2021-01 | 474.3 |
| 2021-02 | 485.6 |
| 2021-03 | 481.5 |
| 2021-04 | 481.7 |
| 2021-05 | 476.7 |
| 2021-06 | 481.1 |
| 2021-07 | 479.3 |
| 2021-08 | 479.4 |
| 2021-09 | 481 |
| 2021-10 | 480.8 |
| 2021-11 | 482.5 |
| 2021-12 | 482.7 |
| 2022-01 | 485.1 |
| 2022-02 | 487.1 |
| 2022-03 | 490.6 |
| 2022-04 | 492.8 |
| 2022-05 | 495.4 |
| 2022-06 | 498.6 |
| 2022-07 | 501.3 |
| 2022-08 | 505.4 |
| 2022-09 | 507.8 |
| 2022-10 | 511.7 |
| 2022-11 | 513.8 |
| 2022-12 | 517.2 |
| 2023-01 | 517.4 |
| 2023-02 | 522.3 |
| 2023-03 | 524.3 |
| 2023-04 | 524.6 |
| 2023-05 | 529.4 |
| 2023-06 | 537 |
| 2023-07 | 540.1 |
| 2023-08 | 542.7 |
| 2023-09 | 544.7 |
| 2023-10 | 548.1 |
| 2023-11 | 552.7 |
| 2023-12 | 556.3 |
| 2024-01 | 559.5 |
| 2024-02 | 561.5 |
| 2024-03 | 562.4 |
| 2024-04 | 566.1 |
| 2024-05 | 566.4 |
| 2024-06 | 568.2 |
| 2024-07 | 569.2 |
| 2024-08 | 568.3 |
| 2024-09 | 570.8 |
| 2024-10 | 530.8 |
| 2024-11 | 566.9 |
| 2024-12 | 568.4 |
| 2025-01 | 565.1 |
| 2025-02 | 565 |
| 2025-03 | 565.2 |
| 2025-04 | 565.5 |
| 2025-05 | 563.6 |
| 2025-06 | 566.8 |
| 2025-07 | 568.5 |
| 2025-08 | 568.7 |
| 2025-09 | 566.3 |
| 2025-10 | 569.3 |
| 2025-11 | 575.1 |
| 2025-12 | 577.6 |
| 2026-01 | 579.6 |
| 2026-02 | 579.9 |
| 2026-03 | 583.5 |
| 2026-04 | 585.4 |
| 2026-05 | 588.1 |
| 2026-06 | 591.6 |
Every segment the war touched is roughly a third smaller than at the Cold War's end
The shrinkage is not confined to one niche. Aircraft manufacturing, the core of the fighter-and-tanker supply chain, peaked at 395,500 jobs in January 1990; it stood at 265,100 in June 2026, exactly 33.0 percent below. Aircraft engine and parts plants are 33.1 percent below their early-1989 peak. The guided missile and space vehicle industry — the people who build interceptors — is 32.9 percent below its February 1990 peak. Only the catch-all "other aircraft parts and equipment" segment has come closest to recovering, and it is still about a fifth smaller than in July 1990. Whatever Washington's war plans assume, they assume a factory base that, measured in payroll jobs, is roughly two-thirds the size of the one that ended the Cold War.
It is worth being precise about what employment does and does not measure. A factory can raise output with overtime, automation, imported components or subcontractors, and CES payrolls capture none of those. But that cuts both ways: a workforce one-third smaller is also the pool from which any surge must be staffed, and experienced aerospace workers are precisely the "skilled manufacturing workers" the Inspector General flagged as hard to recruit. The payroll record can't tell us how fast America can rebuild its magazines. It tells us who would be doing the rebuilding, and how many of them there are.
Aircraft lines and missile lines: both industries shrank together

View exact chart values
| date | aircraft_index | missile_space_index |
|---|---|---|
| 1990-01 | 100 | 100 |
| 1990-02 | 99.9 | 100.2 |
| 1990-03 | 99.3 | 100 |
| 1990-04 | 99.6 | 99.7 |
| 1990-05 | 99.7 | 99.2 |
| 1990-06 | 99.8 | 98.9 |
| 1990-07 | 99 | 98.3 |
| 1990-08 | 98.3 | 97.3 |
| 1990-09 | 97.7 | 95.8 |
| 1990-10 | 96.8 | 95.2 |
| 1990-11 | 96.2 | 94.5 |
| 1990-12 | 96 | 93.7 |
| 1991-01 | 95.9 | 92.9 |
| 1991-02 | 94.1 | 92.2 |
| 1991-03 | 93.7 | 91.5 |
| 1991-04 | 93.1 | 90.7 |
| 1991-05 | 92.4 | 89.9 |
| 1991-06 | 91.7 | 88.8 |
| 1991-07 | 91.5 | 87.8 |
| 1991-08 | 91.3 | 87 |
| 1991-09 | 90.8 | 86.2 |
| 1991-10 | 90.5 | 85.7 |
| 1991-11 | 90.1 | 84.9 |
| 1991-12 | 89.7 | 84.3 |
| 1992-01 | 89.7 | 83.5 |
| 1992-02 | 88.8 | 82.3 |
| 1992-03 | 88.1 | 81.2 |
| 1992-04 | 87.2 | 80 |
| 1992-05 | 86.8 | 78.8 |
| 1992-06 | 86.3 | 77.6 |
| 1992-07 | 85.6 | 76.7 |
| 1992-08 | 84.7 | 75.6 |
| 1992-09 | 84 | 74.8 |
| 1992-10 | 83.1 | 73.3 |
| 1992-11 | 82.6 | 72.4 |
| 1992-12 | 81.9 | 71.5 |
| 1993-01 | 81 | 70.5 |
| 1993-02 | 80.7 | 68.9 |
| 1993-03 | 80 | 68.4 |
| 1993-04 | 79.3 | 67.5 |
| 1993-05 | 78.7 | 66.6 |
| 1993-06 | 77.8 | 65.8 |
| 1993-07 | 77.2 | 64.8 |
| 1993-08 | 76.6 | 63.9 |
| 1993-09 | 75.9 | 63 |
| 1993-10 | 75.1 | 62.4 |
| 1993-11 | 74.2 | 61.5 |
| 1993-12 | 73.4 | 60.1 |
| 1994-01 | 72.9 | 59.3 |
| 1994-02 | 71.9 | 59 |
| 1994-03 | 71.2 | 58.2 |
| 1994-04 | 70.5 | 57.8 |
| 1994-05 | 70.2 | 57.4 |
| 1994-06 | 69.8 | 56.7 |
| 1994-07 | 69.2 | 55.9 |
| 1994-08 | 68.8 | 55.6 |
| 1994-09 | 68.4 | 55.3 |
| 1994-10 | 68.1 | 54.9 |
| 1994-11 | 67.5 | 55.4 |
| 1994-12 | 67 | 54.9 |
| 1995-01 | 66.4 | 54.8 |
| 1995-02 | 66.2 | 53.8 |
| 1995-03 | 66 | 53.6 |
| 1995-04 | 65.5 | 53.2 |
| 1995-05 | 64.9 | 52.3 |
| 1995-06 | 64.4 | 51.9 |
| 1995-07 | 62.7 | 51.7 |
| 1995-08 | 62.5 | 51.2 |
| 1995-09 | 62.2 | 50.5 |
| 1995-10 | 56.4 | 50.1 |
| 1995-11 | 56.3 | 49.3 |
| 1995-12 | 62.1 | 48.8 |
| 1996-01 | 62.5 | 48.3 |
| 1996-02 | 62.5 | 48.1 |
| 1996-03 | 62.5 | 47.9 |
| 1996-04 | 62.8 | 47.7 |
| 1996-05 | 63 | 47.6 |
| 1996-06 | 61.6 | 47.6 |
| 1996-07 | 62.5 | 47.3 |
| 1996-08 | 62.4 | 47.3 |
| 1996-09 | 62.7 | 47.5 |
| 1996-10 | 64.4 | 47.4 |
| 1996-11 | 64.9 | 47.5 |
| 1996-12 | 65.2 | 47.4 |
| 1997-01 | 66 | 47.4 |
| 1997-02 | 66.4 | 47.6 |
| 1997-03 | 66.8 | 47.7 |
| 1997-04 | 67.3 | 47.6 |
| 1997-05 | 67.7 | 47.9 |
| 1997-06 | 68.3 | 48 |
| 1997-07 | 68.9 | 48.1 |
| 1997-08 | 69.3 | 48.3 |
| 1997-09 | 69.6 | 48.5 |
| 1997-10 | 70.1 | 48.7 |
| 1997-11 | 70.5 | 49 |
| 1997-12 | 70.8 | 49.1 |
| 1998-01 | 70.9 | 49.1 |
| 1998-02 | 71.1 | 49.1 |
| 1998-03 | 71.1 | 49.2 |
| 1998-04 | 71.2 | 49.2 |
| 1998-05 | 71.4 | 49.1 |
| 1998-06 | 71.5 | 48.9 |
| 1998-07 | 71.5 | 48.7 |
| 1998-08 | 71.4 | 48.5 |
| 1998-09 | 71.3 | 47.7 |
| 1998-10 | 71.2 | 47.5 |
| 1998-11 | 70.9 | 47.6 |
| 1998-12 | 70.7 | 47.2 |
| 1999-01 | 70.3 | 46.9 |
| 1999-02 | 69.7 | 46.9 |
| 1999-03 | 69.2 | 46.1 |
| 1999-04 | 68.2 | 46.2 |
| 1999-05 | 67.5 | 45.9 |
| 1999-06 | 66.8 | 45.9 |
| 1999-07 | 66.1 | 45.9 |
| 1999-08 | 65.3 | 45.8 |
| 1999-09 | 64.7 | 45.6 |
| 1999-10 | 64.1 | 45.4 |
| 1999-11 | 63.6 | 45.6 |
| 1999-12 | 63.3 | 45.1 |
| 2000-01 | 63.1 | 46.3 |
| 2000-02 | 58.9 | 46.4 |
| 2000-03 | 62.5 | 46.7 |
| 2000-04 | 62.2 | 46.4 |
| 2000-05 | 61.8 | 46.3 |
| 2000-06 | 61.6 | 46.1 |
| 2000-07 | 61.3 | 45.5 |
| 2000-08 | 61.2 | 45.1 |
| 2000-09 | 61.1 | 43.3 |
| 2000-10 | 60.9 | 44.3 |
| 2000-11 | 60.8 | 44.7 |
| 2000-12 | 61 | 44.7 |
| 2001-01 | 61 | 44.4 |
| 2001-02 | 61.2 | 44.3 |
| 2001-03 | 61.4 | 44.2 |
| 2001-04 | 61.5 | 44.4 |
| 2001-05 | 61.5 | 44.5 |
| 2001-06 | 61.6 | 44.5 |
| 2001-07 | 61.3 | 44.5 |
| 2001-08 | 61.4 | 44.6 |
| 2001-09 | 61.4 | 44.7 |
| 2001-10 | 60.8 | 44.4 |
| 2001-11 | 60.2 | 44 |
| 2001-12 | 58.7 | 43.7 |
| 2002-01 | 58.2 | 43.5 |
| 2002-02 | 57.1 | 43.7 |
| 2002-03 | 56.3 | 43.4 |
| 2002-04 | 55.5 | 43.1 |
| 2002-05 | 56.1 | 42.9 |
| 2002-06 | 55.7 | 42.7 |
| 2002-07 | 55.7 | 42.8 |
| 2002-08 | 55.9 | 42.6 |
| 2002-09 | 54.7 | 42.4 |
| 2002-10 | 54.6 | 42 |
| 2002-11 | 54.2 | 41.6 |
| 2002-12 | 54.2 | 41.5 |
| 2003-01 | 54.1 | 41.4 |
| 2003-02 | 54.1 | 41.4 |
| 2003-03 | 53.6 | 40.5 |
| 2003-04 | 53.8 | 40.6 |
| 2003-05 | 53.3 | 40.5 |
| 2003-06 | 52.5 | 40.3 |
| 2003-07 | 52.4 | 40.3 |
| 2003-08 | 52.1 | 40.4 |
| 2003-09 | 52.1 | 40.5 |
| 2003-10 | 52.1 | 40.8 |
| 2003-11 | 52.1 | 41 |
| 2003-12 | 52.1 | 40.9 |
| 2004-01 | 52.3 | 41.1 |
| 2004-02 | 52.3 | 40.5 |
| 2004-03 | 52.4 | 41.1 |
| 2004-04 | 52.5 | 41.1 |
| 2004-05 | 52.3 | 41.2 |
| 2004-06 | 52.3 | 41.5 |
| 2004-07 | 52.4 | 41.5 |
| 2004-08 | 52.4 | 41.8 |
| 2004-09 | 52.4 | 41.8 |
| 2004-10 | 52.3 | 41.9 |
| 2004-11 | 52.6 | 42.3 |
| 2004-12 | 52.6 | 42.6 |
| 2005-01 | 52.4 | 42.5 |
| 2005-02 | 52.7 | 42.8 |
| 2005-03 | 52.9 | 42.9 |
| 2005-04 | 53.2 | 43.9 |
| 2005-05 | 53.5 | 43.8 |
| 2005-06 | 53.8 | 43.9 |
| 2005-07 | 54.2 | 43.9 |
| 2005-08 | 54.4 | 43.8 |
| 2005-09 | 50 | 43.9 |
| 2005-10 | 54.4 | 43.9 |
| 2005-11 | 54.7 | 43.7 |
| 2005-12 | 54.9 | 43.7 |
| 2006-01 | 55 | 43.9 |
| 2006-02 | 55.4 | 44.1 |
| 2006-03 | 54.9 | 43.7 |
| 2006-04 | 55.7 | 43.9 |
| 2006-05 | 55.7 | 43.7 |
| 2006-06 | 56 | 43.8 |
| 2006-07 | 56 | 43.9 |
| 2006-08 | 56.2 | 44 |
| 2006-09 | 56.8 | 44 |
| 2006-10 | 57.3 | 44.1 |
| 2006-11 | 56.8 | 43.7 |
| 2006-12 | 56.9 | 43 |
| 2007-01 | 57.3 | 43.3 |
| 2007-02 | 57.5 | 44.3 |
| 2007-03 | 57.4 | 43.7 |
| 2007-04 | 57.2 | 43.6 |
| 2007-05 | 57.7 | 43.6 |
| 2007-06 | 58 | 43.7 |
| 2007-07 | 58.2 | 43.8 |
| 2007-08 | 58.6 | 43.7 |
| 2007-09 | 58.7 | 43.7 |
| 2007-10 | 58.8 | 43.9 |
| 2007-11 | 59.2 | 44.3 |
| 2007-12 | 59.5 | 44.3 |
| 2008-01 | 60.1 | 44.2 |
| 2008-02 | 59.8 | 44.2 |
| 2008-03 | 60.2 | 44.7 |
| 2008-04 | 60.5 | 44.7 |
| 2008-05 | 61 | 44.8 |
| 2008-06 | 61.3 | 45 |
| 2008-07 | 60.6 | 45 |
| 2008-08 | 59.8 | 45.1 |
| 2008-09 | 60.9 | 45.2 |
| 2008-10 | 54.4 | 45.5 |
| 2008-11 | 60.8 | 45.8 |
| 2008-12 | 60.9 | 46.2 |
| 2009-01 | 60.7 | 45.8 |
| 2009-02 | 60.9 | 45.8 |
| 2009-03 | 60.8 | 45.9 |
| 2009-04 | 60.2 | 45.8 |
| 2009-05 | 59.9 | 45.6 |
| 2009-06 | 59.1 | 45.5 |
| 2009-07 | 58.6 | 45.6 |
| 2009-08 | 58.7 | 45.5 |
| 2009-09 | 58.5 | 45.2 |
| 2009-10 | 58.6 | 45 |
| 2009-11 | 58.4 | 44.5 |
| 2009-12 | 58.2 | 44.6 |
| 2010-01 | 58.3 | 44.6 |
| 2010-02 | 58 | 44.3 |
| 2010-03 | 57.9 | 44 |
| 2010-04 | 57.7 | 44.1 |
| 2010-05 | 57.4 | 44.2 |
| 2010-06 | 57.1 | 44.3 |
| 2010-07 | 57.6 | 44 |
| 2010-08 | 57.7 | 44 |
| 2010-09 | 57.7 | 44 |
| 2010-10 | 57.6 | 43.8 |
| 2010-11 | 57.7 | 43.8 |
| 2010-12 | 57.8 | 43.7 |
| 2011-01 | 58.1 | 43.9 |
| 2011-02 | 58.4 | 43.9 |
| 2011-03 | 58.5 | 43.9 |
| 2011-04 | 58.7 | 43.7 |
| 2011-05 | 58.9 | 43.4 |
| 2011-06 | 59.3 | 43.3 |
| 2011-07 | 59.6 | 43.2 |
| 2011-08 | 59.9 | 43.3 |
| 2011-09 | 60 | 43.1 |
| 2011-10 | 60.1 | 42.7 |
| 2011-11 | 60 | 42.5 |
| 2011-12 | 60 | 42.4 |
| 2012-01 | 60 | 42.4 |
| 2012-02 | 59.9 | 42.3 |
| 2012-03 | 59.9 | 42.2 |
| 2012-04 | 60.1 | 42.4 |
| 2012-05 | 59.5 | 42.5 |
| 2012-06 | 59.6 | 42.6 |
| 2012-07 | 60.7 | 42.2 |
| 2012-08 | 61 | 42.3 |
| 2012-09 | 61.2 | 42.4 |
| 2012-10 | 61.4 | 42.6 |
| 2012-11 | 61.5 | 42.7 |
| 2012-12 | 61.6 | 42.8 |
| 2013-01 | 61.5 | 42.7 |
| 2013-02 | 61.6 | 42.7 |
| 2013-03 | 61.5 | 42.6 |
| 2013-04 | 61.4 | 42.6 |
| 2013-05 | 61.1 | 42.6 |
| 2013-06 | 61.2 | 42.6 |
| 2013-07 | 59 | 42.6 |
| 2013-08 | 59.6 | 42.5 |
| 2013-09 | 59.5 | 42.5 |
| 2013-10 | 59.4 | 42.5 |
| 2013-11 | 59.3 | 42.3 |
| 2013-12 | 59.4 | 42.2 |
| 2014-01 | 59.2 | 42.1 |
| 2014-02 | 59.1 | 42 |
| 2014-03 | 59.2 | 41.8 |
| 2014-04 | 59.9 | 41.8 |
| 2014-05 | 59.7 | 41.6 |
| 2014-06 | 59.8 | 41.4 |
| 2014-07 | 59.5 | 41.2 |
| 2014-08 | 59.4 | 41.1 |
| 2014-09 | 59.3 | 40.8 |
| 2014-10 | 59.3 | 40.7 |
| 2014-11 | 59.3 | 40.7 |
| 2014-12 | 59.3 | 40.3 |
| 2015-01 | 59.2 | 40.3 |
| 2015-02 | 59.3 | 41.1 |
| 2015-03 | 59.3 | 41.2 |
| 2015-04 | 58.9 | 40.5 |
| 2015-05 | 58.7 | 40.5 |
| 2015-06 | 58.7 | 40.4 |
| 2015-07 | 58.8 | 40.4 |
| 2015-08 | 58.8 | 40.5 |
| 2015-09 | 59.1 | 40.7 |
| 2015-10 | 59 | 40.7 |
| 2015-11 | 59 | 40.7 |
| 2015-12 | 59 | 40.9 |
| 2016-01 | 59 | 40.9 |
| 2016-02 | 59 | 40.8 |
| 2016-03 | 59 | 41.2 |
| 2016-04 | 59.2 | 41.2 |
| 2016-05 | 59.1 | 41.6 |
| 2016-06 | 58.7 | 41.8 |
| 2016-07 | 58.9 | 42 |
| 2016-08 | 58.6 | 42.2 |
| 2016-09 | 58.2 | 42.3 |
| 2016-10 | 57.9 | 42.7 |
| 2016-11 | 57.5 | 42.6 |
| 2016-12 | 57 | 42.9 |
| 2017-01 | 56.9 | 43.1 |
| 2017-02 | 56.7 | 43.4 |
| 2017-03 | 56.6 | 43.3 |
| 2017-04 | 56.4 | 43.5 |
| 2017-05 | 56.2 | 43.5 |
| 2017-06 | 56.1 | 43.6 |
| 2017-07 | 55.9 | 43.9 |
| 2017-08 | 55.9 | 44 |
| 2017-09 | 56.1 | 44.3 |
| 2017-10 | 56 | 44.4 |
| 2017-11 | 56.3 | 44.5 |
| 2017-12 | 56.3 | 44.5 |
| 2018-01 | 56.7 | 44.7 |
| 2018-02 | 56.9 | 44.7 |
| 2018-03 | 57.1 | 45 |
| 2018-04 | 56.9 | 45.5 |
| 2018-05 | 57.4 | 45.9 |
| 2018-06 | 58 | 46.5 |
| 2018-07 | 58.2 | 46.9 |
| 2018-08 | 59.1 | 47.2 |
| 2018-09 | 59.5 | 47.6 |
| 2018-10 | 59.9 | 47.9 |
| 2018-11 | 60.2 | 48.4 |
| 2018-12 | 60.3 | 48.8 |
| 2019-01 | 60.2 | 49.2 |
| 2019-02 | 60.2 | 49.7 |
| 2019-03 | 60 | 49.8 |
| 2019-04 | 60.2 | 50.1 |
| 2019-05 | 61 | 50.3 |
| 2019-06 | 61.2 | 50.3 |
| 2019-07 | 61.5 | 50.3 |
| 2019-08 | 61.4 | 50.5 |
| 2019-09 | 61.5 | 50.7 |
| 2019-10 | 61.6 | 51.3 |
| 2019-11 | 61.5 | 51.2 |
| 2019-12 | 61.8 | 51.3 |
| 2020-01 | 61.7 | 51.6 |
| 2020-02 | 61.5 | 51.6 |
| 2020-03 | 61.4 | 51.7 |
| 2020-04 | 60.5 | 51.7 |
| 2020-05 | 58.8 | 51.7 |
| 2020-06 | 57.4 | 51.7 |
| 2020-07 | 57.7 | 52.2 |
| 2020-08 | 56.5 | 52.4 |
| 2020-09 | 55.3 | 52.3 |
| 2020-10 | 54.1 | 52.1 |
| 2020-11 | 53.5 | 52.6 |
| 2020-12 | 52.9 | 52.6 |
| 2021-01 | 52.6 | 53.4 |
| 2021-02 | 55.2 | 53.6 |
| 2021-03 | 54.5 | 53.9 |
| 2021-04 | 54.9 | 54.1 |
| 2021-05 | 53.7 | 54.3 |
| 2021-06 | 54.8 | 54.5 |
| 2021-07 | 54.4 | 54.5 |
| 2021-08 | 54.5 | 54.5 |
| 2021-09 | 54.5 | 54.6 |
| 2021-10 | 54.6 | 54.6 |
| 2021-11 | 54.9 | 54.5 |
| 2021-12 | 55 | 54.6 |
| 2022-01 | 54.9 | 54.6 |
| 2022-02 | 55.2 | 54.9 |
| 2022-03 | 55.7 | 55.3 |
| 2022-04 | 56 | 55.7 |
| 2022-05 | 56.2 | 56.3 |
| 2022-06 | 56.4 | 56.8 |
| 2022-07 | 56.8 | 57.4 |
| 2022-08 | 57 | 58.2 |
| 2022-09 | 57.6 | 58.5 |
| 2022-10 | 58.3 | 59 |
| 2022-11 | 58.5 | 59.6 |
| 2022-12 | 58.7 | 60 |
| 2023-01 | 58.9 | 60 |
| 2023-02 | 59.2 | 60.6 |
| 2023-03 | 59.2 | 61 |
| 2023-04 | 59.2 | 61.5 |
| 2023-05 | 59.8 | 61.7 |
| 2023-06 | 61.1 | 62.5 |
| 2023-07 | 61.6 | 63 |
| 2023-08 | 62.1 | 62.9 |
| 2023-09 | 62.4 | 63.3 |
| 2023-10 | 63.1 | 63.7 |
| 2023-11 | 63.6 | 64 |
| 2023-12 | 64 | 64.2 |
| 2024-01 | 64.6 | 64.3 |
| 2024-02 | 64.8 | 64.4 |
| 2024-03 | 64.9 | 64.3 |
| 2024-04 | 65.6 | 64.5 |
| 2024-05 | 65.7 | 64.4 |
| 2024-06 | 65.7 | 64 |
| 2024-07 | 65.9 | 63.9 |
| 2024-08 | 66.1 | 63.5 |
| 2024-09 | 66.6 | 63.8 |
| 2024-10 | 56.6 | 63.8 |
| 2024-11 | 65.3 | 63.9 |
| 2024-12 | 65.7 | 64 |
| 2025-01 | 65.1 | 63.7 |
| 2025-02 | 64.9 | 64.1 |
| 2025-03 | 64.9 | 64.2 |
| 2025-04 | 64.7 | 64 |
| 2025-05 | 64.9 | 64 |
| 2025-06 | 64.7 | 64.3 |
| 2025-07 | 64.9 | 64.6 |
| 2025-08 | 63.9 | 64.7 |
| 2025-09 | 63.5 | 64.8 |
| 2025-10 | 63.9 | 65 |
| 2025-11 | 65 | 65.3 |
| 2025-12 | 65.3 | 65.8 |
| 2026-01 | 65.5 | 66 |
| 2026-02 | 65.6 | 66.3 |
| 2026-03 | 65.9 | 66.6 |
| 2026-04 | 66.2 | 67 |
| 2026-05 | 66.5 | 67.1 |
| 2026-06 | 67 | 67.2 |
Peak versus now: every aerospace segment is a third smaller

View exact chart values
| segment | peak_thousands | peak_period | latest_thousands | latest_period | pct_below_peak |
|---|---|---|---|---|---|
| Aerospace products & parts (total) | 849.5 | 1990-02 | 591.6 | 2026-06 | 30.4 |
| Aircraft manufacturing | 395.5 | 1990-01 | 265.1 | 2026-06 | 33 |
| Aircraft engines & parts | 150.7 | 1989-03 | 100.8 | 2026-06 | 33.1 |
| Other aircraft parts & equipment | 135.9 | 1990-07 | 109.1 | 2026-06 | 19.7 |
| Guided missile & space vehicles | 172.8 | 1990-02 | 115.9 | 2026-06 | 32.9 |
The rebuild base, segment by segment
As of June 2026, the workforce that would absorb a munitions-and-aircraft rebuild looks like this: 265,100 in aircraft manufacturing, 115,900 in guided missile and space vehicles, 109,100 in other aircraft parts, and 100,800 in engines and parts — 591,600 across aerospace as a whole. For scale, the CBO's estimate that the military has expended half to two-thirds of its missile-defense interceptors since June 2025 lands on an industry that employs fewer people today than the aircraft segment alone did in any single year of the 1990s. That is the arithmetic behind the watchdog's "bottlenecks" language, and behind CBO's separate finding that rebuilding just the interceptor inventory will take five years even at accelerated procurement rates.
The rebuild base, segment by segment (June 2026)

View exact chart values
| segment | employees_thousands | period |
|---|---|---|
| Aerospace products & parts (total) | 591.6 | 2026-06 |
| Aircraft manufacturing | 265.1 | 2026-06 |
| Aircraft engines & parts | 100.8 | 2026-06 |
| Other aircraft parts & equipment | 109.1 | 2026-06 |
| Guided missile & space vehicles | 115.9 | 2026-06 |
The overtime gauge says: ramping, not surging
If the war were already straining the rebuild base, the first place it would show up is hours. The official overtime series for aerospace manufacturing runs from March 2006, and it tells a careful story. After the war began in late February 2026, average weekly overtime climbed for five consecutive months — from 2.7 hours in January to 2.8, 2.9, 3.1, 3.1 and 3.2 by June. That is a real ramp, and it is consistent with factories adding hours to existing crews rather than standing up new lines. But it is worth stating what it is not: June's 3.2 hours is above the industry's 2025 pre-war average of 2.96, yet still below the 2019 average of 3.33 and far below the 4.1 recorded at the 2011 peak. The workforce is running warmer than last year, not red-lined.
Employment tells the same measured story. Since the pre-war month of January 2026, aircraft manufacturing added 6,100 jobs (+2.4 percent) and total aerospace added 12,000 (+2.1 percent) — steady, and genuinely welcome after the industry added 26,500 jobs since January 2025. But against a war that consumed $22.3 billion of munitions in four months and damaged aircraft from fighters to tankers to drones, a monthly hiring pace measured in the low thousands is a trickle into a very large bucket. Nothing in these series suggests a crash mobilization is underway; equally, nothing suggests the constraint the Inspector General described has been lifted.
After the war began, the overtime needle moved — modestly

View exact chart values
| date | ot_hours |
|---|---|
| 2006-03 | 3.5 |
| 2006-04 | 3.6 |
| 2006-05 | 3.6 |
| 2006-06 | 3.6 |
| 2006-07 | 3.7 |
| 2006-08 | 3.7 |
| 2006-09 | 3.5 |
| 2006-10 | 3.6 |
| 2006-11 | 3.6 |
| 2006-12 | 3.6 |
| 2007-01 | 3.7 |
| 2007-02 | 3.7 |
| 2007-03 | 3.7 |
| 2007-04 | 3.6 |
| 2007-05 | 3.7 |
| 2007-06 | 3.7 |
| 2007-07 | 3.7 |
| 2007-08 | 3.7 |
| 2007-09 | 3.8 |
| 2007-10 | 3.7 |
| 2007-11 | 3.9 |
| 2007-12 | 3.9 |
| 2008-01 | 3.8 |
| 2008-02 | 3.6 |
| 2008-03 | 3.8 |
| 2008-04 | 4 |
| 2008-05 | 3.9 |
| 2008-06 | 3.9 |
| 2008-07 | 3.8 |
| 2008-08 | 3.8 |
| 2008-09 | 3.3 |
| 2008-10 | 4 |
| 2008-11 | 3.7 |
| 2008-12 | 3.7 |
| 2009-01 | 3.8 |
| 2009-02 | 3.7 |
| 2009-03 | 3.5 |
| 2009-04 | 3.5 |
| 2009-05 | 3.5 |
| 2009-06 | 3.5 |
| 2009-07 | 3.4 |
| 2009-08 | 3.4 |
| 2009-09 | 3.4 |
| 2009-10 | 3.4 |
| 2009-11 | 3.4 |
| 2009-12 | 3.5 |
| 2010-01 | 3.5 |
| 2010-02 | 3.5 |
| 2010-03 | 3.6 |
| 2010-04 | 3.5 |
| 2010-05 | 3.4 |
| 2010-06 | 3.5 |
| 2010-07 | 3.6 |
| 2010-08 | 3.7 |
| 2010-09 | 3.8 |
| 2010-10 | 3.7 |
| 2010-11 | 3.7 |
| 2010-12 | 3.7 |
| 2011-01 | 3.6 |
| 2011-02 | 3.8 |
| 2011-03 | 3.9 |
| 2011-04 | 4.1 |
| 2011-05 | 4.1 |
| 2011-06 | 3.9 |
| 2011-07 | 4.1 |
| 2011-08 | 3.9 |
| 2011-09 | 3.8 |
| 2011-10 | 3.8 |
| 2011-11 | 3.9 |
| 2011-12 | 3.8 |
| 2012-01 | 3.7 |
| 2012-02 | 3.9 |
| 2012-03 | 3.7 |
| 2012-04 | 3.5 |
| 2012-05 | 3.6 |
| 2012-06 | 3.5 |
| 2012-07 | 3.3 |
| 2012-08 | 3.4 |
| 2012-09 | 3.4 |
| 2012-10 | 3.4 |
| 2012-11 | 3.3 |
| 2012-12 | 3.4 |
| 2013-01 | 3.7 |
| 2013-02 | 3.5 |
| 2013-03 | 3.5 |
| 2013-04 | 3.6 |
| 2013-05 | 3.3 |
| 2013-06 | 3.3 |
| 2013-07 | 3.1 |
| 2013-08 | 3.3 |
| 2013-09 | 3.2 |
| 2013-10 | 3.2 |
| 2013-11 | 3.2 |
| 2013-12 | 3.1 |
| 2014-01 | 3.1 |
| 2014-02 | 3.1 |
| 2014-03 | 3.1 |
| 2014-04 | 3.1 |
| 2014-05 | 3.2 |
| 2014-06 | 3.2 |
| 2014-07 | 3.2 |
| 2014-08 | 3.2 |
| 2014-09 | 3.2 |
| 2014-10 | 3 |
| 2014-11 | 3.1 |
| 2014-12 | 3.2 |
| 2015-01 | 3.1 |
| 2015-02 | 3.1 |
| 2015-03 | 3.1 |
| 2015-04 | 3 |
| 2015-05 | 3 |
| 2015-06 | 3 |
| 2015-07 | 3.1 |
| 2015-08 | 3.2 |
| 2015-09 | 3 |
| 2015-10 | 3.2 |
| 2015-11 | 3.1 |
| 2015-12 | 3 |
| 2016-01 | 3.2 |
| 2016-02 | 3.2 |
| 2016-03 | 3.1 |
| 2016-04 | 3.1 |
| 2016-05 | 3.2 |
| 2016-06 | 3.2 |
| 2016-07 | 3.1 |
| 2016-08 | 3.1 |
| 2016-09 | 3.1 |
| 2016-10 | 3 |
| 2016-11 | 3.1 |
| 2016-12 | 3 |
| 2017-01 | 3 |
| 2017-02 | 3 |
| 2017-03 | 2.9 |
| 2017-04 | 3.1 |
| 2017-05 | 3.2 |
| 2017-06 | 3.2 |
| 2017-07 | 3.3 |
| 2017-08 | 3.3 |
| 2017-09 | 3.2 |
| 2017-10 | 3.4 |
| 2017-11 | 3.5 |
| 2017-12 | 3.2 |
| 2018-01 | 3.3 |
| 2018-02 | 3.2 |
| 2018-03 | 3.1 |
| 2018-04 | 3.4 |
| 2018-05 | 3.3 |
| 2018-06 | 3.3 |
| 2018-07 | 3.3 |
| 2018-08 | 3.3 |
| 2018-09 | 3.4 |
| 2018-10 | 3.4 |
| 2018-11 | 3.3 |
| 2018-12 | 3.5 |
| 2019-01 | 3.3 |
| 2019-02 | 3.6 |
| 2019-03 | 3.8 |
| 2019-04 | 3.6 |
| 2019-05 | 3.1 |
| 2019-06 | 3.4 |
| 2019-07 | 3.2 |
| 2019-08 | 3.2 |
| 2019-09 | 3.2 |
| 2019-10 | 3.2 |
| 2019-11 | 3.2 |
| 2019-12 | 3.2 |
| 2020-01 | 2.6 |
| 2020-02 | 2.7 |
| 2020-03 | 2.7 |
| 2020-04 | 1.3 |
| 2020-05 | 1.7 |
| 2020-06 | 1.8 |
| 2020-07 | 2 |
| 2020-08 | 2.2 |
| 2020-09 | 2.2 |
| 2020-10 | 2.2 |
| 2020-11 | 2.2 |
| 2020-12 | 2.1 |
| 2021-01 | 2.3 |
| 2021-02 | 2.2 |
| 2021-03 | 2.3 |
| 2021-04 | 2.4 |
| 2021-05 | 2.2 |
| 2021-06 | 2.6 |
| 2021-07 | 2.6 |
| 2021-08 | 2.6 |
| 2021-09 | 2.7 |
| 2021-10 | 2.7 |
| 2021-11 | 2.7 |
| 2021-12 | 2.8 |
| 2022-01 | 2.8 |
| 2022-02 | 2.9 |
| 2022-03 | 2.9 |
| 2022-04 | 3 |
| 2022-05 | 2.9 |
| 2022-06 | 3 |
| 2022-07 | 3.1 |
| 2022-08 | 3 |
| 2022-09 | 3 |
| 2022-10 | 3 |
| 2022-11 | 3 |
| 2022-12 | 3 |
| 2023-01 | 3 |
| 2023-02 | 3 |
| 2023-03 | 2.9 |
| 2023-04 | 2.9 |
| 2023-05 | 3 |
| 2023-06 | 3 |
| 2023-07 | 3 |
| 2023-08 | 3 |
| 2023-09 | 3 |
| 2023-10 | 2.8 |
| 2023-11 | 3 |
| 2023-12 | 2.9 |
| 2024-01 | 2.9 |
| 2024-02 | 2.8 |
| 2024-03 | 2.6 |
| 2024-04 | 2.8 |
| 2024-05 | 2.8 |
| 2024-06 | 2.8 |
| 2024-07 | 2.7 |
| 2024-08 | 3 |
| 2024-09 | 3 |
| 2024-10 | 2.5 |
| 2024-11 | 2.4 |
| 2024-12 | 2.7 |
| 2025-01 | 2.9 |
| 2025-02 | 3.1 |
| 2025-03 | 3.3 |
| 2025-04 | 2.9 |
| 2025-05 | 3.1 |
| 2025-06 | 3 |
| 2025-07 | 2.9 |
| 2025-08 | 2.9 |
| 2025-09 | 2.9 |
| 2025-10 | 3 |
| 2025-11 | 3 |
| 2025-12 | 2.8 |
| 2026-01 | 2.7 |
| 2026-02 | 2.8 |
| 2026-03 | 2.9 |
| 2026-04 | 3.1 |
| 2026-05 | 3.1 |
| 2026-06 | 3.2 |
The reader's takeaway
Put the two documents side by side. The war report says the United States burned through weapons faster than the industrial base can comfortably replace, and warns that some sophisticated weapons cannot be replaced quickly regardless of how fast money moves. The payroll record says the industrial base doing that replacing is the smallest it has been in the modern record — every segment roughly a third below its 1990 peak — and that the response so far, in jobs and hours, has been a modest ramp rather than a surge. That is not an argument that the rebuild is impossible; aerospace hiring has been one of manufacturing's genuine success stories of the past four years, and overtime has been climbing since the war began. It is an argument about time. "Significant lead time," in payroll terms, looks like this: an industry hiring a few thousand people a month, asking its existing crews for about a quarter-hour more a week, and sitting a third below the workforce it had when it last had to build for a major war.
Two cautions belong next to that picture. First, these are jobs, not output: June 2026 figures are preliminary BLS estimates, and neither CES nor any payroll series can tell you how many interceptors left a factory line. Second, timing is not causation — the hiring and overtime moves after February 28, 2026 are consistent with war-driven demand, but they also reflect an industry that was already growing, and this analysis cannot separate the two. What it can say is simpler: the bill for Operation Epic Fury is denominated in dollars, but it will be paid in factory shifts, and the official record shows there are fewer of those workers available than at any comparable point in the series' history.
Sources and methods
All payroll, hours and overtime figures come from the pinned, read-only BLS Current Employment Statistics snapshot (built 2026-08-24) through the indexed research catalogue: national series, seasonally adjusted, monthly, last observation June 2026. The July 2026 reference month is not present in this vintage; the most recent months are preliminary BLS estimates subject to revision.
Aerospace total is NAICS 3364 'aerospace product and parts manufacturing'; segment series are 336411 aircraft, 336412 engines and parts, 336413 other aircraft parts, and 336419 guided missile and space vehicles. Published values are used as-is, including small benchmark-month dips visible in the published seasonally adjusted series (e.g., October 2024).
CES measures jobs and hours, not output, orders or factory capacity; it cannot rule out faster rebuilds through overtime, imports, subcontracting or capital investment. Descriptive comparisons only: the timing of payroll and overtime changes after February 28, 2026 does not establish a causal effect of the war.
War cost and loss figures cited for context ($33.4B Inspector General estimate through June 29; $38B CBO estimate through July; up to 30 MQ-9 Reapers; F-35A damage) come from stored reporting on the Pentagon Inspector General review and the CBO estimate, not from BLS data. Peak dates are computed over each series' available extract window (engines from January 1989; all others from January 1990).
Research completed 2026-09-16, for the September 15, 2026 news edition. The available source data may cover earlier periods; see the observation periods and source vintages above.