Research
Ohio’s data-center boom is easier to hear in a gym than to find on the payroll
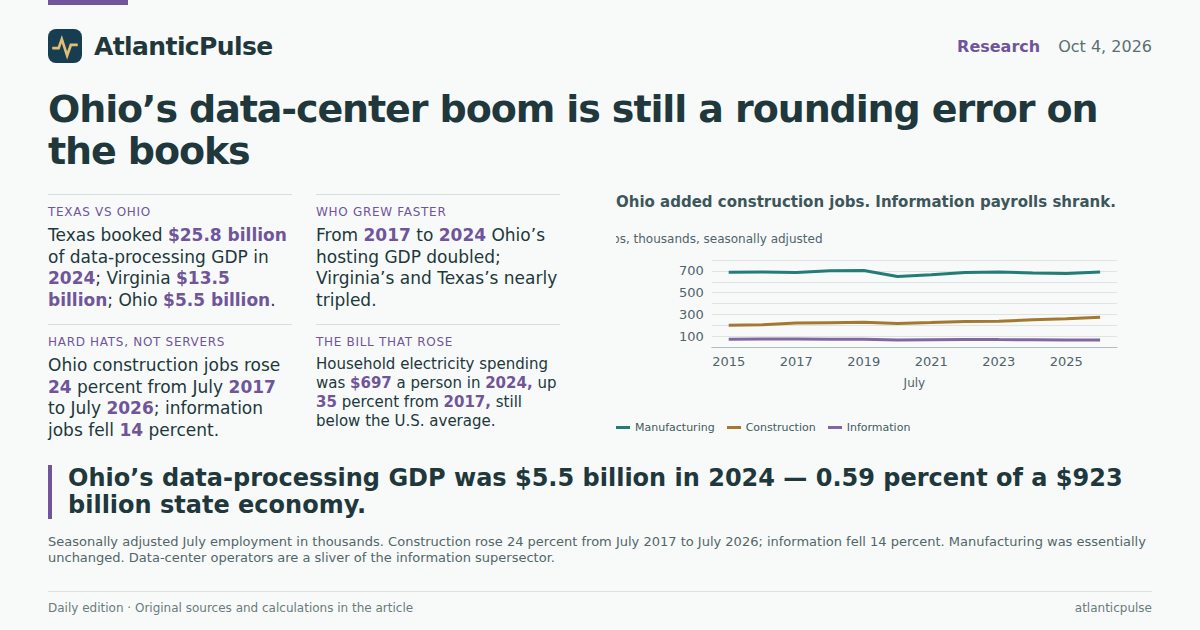
The gym went quiet. The books did not boom.
President Donald Trump spent several minutes in a Vandalia school gym on Saturday insisting Ohio cannot “just turn them off” — the warehouse campuses that power artificial intelligence — because “they’ll go to China.” The room, loud for almost everything else, went quiet. Data centers have become a bipartisan irritant in the Senate race between appointed Republican Jon Husted and former senator Sherrod Brown, who has hammered the tax breaks Husted helped deliver as lieutenant governor. Voters hear about power bills, farmland and water. The White House hears about China.
The official ledgers are less cinematic. They do not count megawatts on a particular campus, and they do not tell you whether a substation is eating a cornfield. They do say whether the industry that includes hosting and data processing is large in Ohio, whether it has grown faster than in other data-center states, and whether local payrolls in information, construction and utilities have moved with the political noise. The short version is unkind to both the boom talk and the boom panic: Ohio’s hosting industry is real, and it is still a rounding error next to the factories the state already has.
Texas’s data-processing GDP is nearly five times Ohio’s

View exact chart values
| state | gdp_millions | year | share_of_us_pct | rank |
|---|---|---|---|---|
| Texas | 25794.7 | 2024 | 4.88 | 1 |
| Virginia | 13545.7 | 2024 | 2.56 | 2 |
| North Carolina | 7308.4 | 2024 | 1.38 | 3 |
| Ohio | 5455.2 | 2024 | 1.03 | 4 |
A $5.5 billion industry in a $923 billion state
In 2024, the latest year when Bureau of Economic Analysis state GDP figures overlap, Ohio booked $5.5 billion of current-dollar output in data processing, hosting and other information services. That is internet access, search and hosting lumped together — a broader bucket than “AI data center,” and the closest official industry the books give us. It was 1.0 percent of the U.S. total in that industry. Texas booked $25.8 billion, nearly five times Ohio. Virginia, the country’s other data-center capital, booked $13.5 billion. North Carolina, another growth market, booked $7.3 billion.
Put Ohio’s $5.5 billion next to the rest of the state and the proportions get ruder. Statewide GDP was $923 billion in 2024. Manufacturing alone was $132 billion — 24 times the hosting industry. Construction was $38 billion, seven times hosting. Utilities, the sector that actually keeps the lights on, were $13.9 billion, still 2.6 times hosting. Data processing and hosting were 0.6 percent of Ohio’s economy. You can fit a lot of political advertising into six-tenths of a percent. You cannot fit a transformation of the industrial base.
The industry has grown. Ohio’s data-processing GDP a little more than doubled from 2017, when it was $2.7 billion, to 2024. Indexed to 2017, Ohio sits at 205. The United States is at 247. Virginia and Texas are at 284. North Carolina, starting from a higher 2017 base, lagged Ohio. So the state did participate in the hosting boom. It did not lead it, and it did not come close to catching the two states whose names already dominate the data-center map.
Ohio’s data-processing output doubled. Virginia and Texas nearly tripled.

View exact chart values
| year | ohio_index | virginia_index | texas_index | north_carolina_index | united_states_index |
|---|---|---|---|---|---|
| 2017 | 100 | 100 | 100 | 100 | 100 |
| 2018 | 99.1 | 94.3 | 99.3 | 100 | 105.8 |
| 2019 | 119.9 | 132.7 | 129.3 | 84.6 | 128 |
| 2020 | 121.3 | 146.3 | 148.3 | 84.1 | 147.4 |
| 2021 | 138.9 | 167.1 | 182.7 | 97.9 | 172.3 |
| 2022 | 171 | 217.1 | 233.1 | 130.3 | 194.6 |
| 2023 | 190.8 | 253.3 | 275.9 | 154.4 | 220 |
| 2024 | 205 | 283.8 | 283.8 | 176 | 247 |
Factories still dwarf the hosting industry on Ohio’s books

View exact chart values
| sector | gdp_millions | share_pct |
|---|---|---|
| Manufacturing | 131595.4 | 14.26 |
| Construction | 38235.3 | 4.14 |
| Utilities | 13940.4 | 1.51 |
| Data processing and hosting | 5455.2 | 0.59 |
The jobs that moved were in hard hats, not server rooms
Payrolls make the same point more sharply. In July 2026, the latest month in the Bureau of Labor Statistics state employment files, Ohio had 5.69 million nonfarm jobs. Manufacturing still employed 689,000 people, 12 percent of the total. Professional and business services employed 729,000. Construction employed 273,000. The entire information supersector — publishing, telecom, data processing and the rest — employed 63,200, or 1.1 percent of the state’s jobs. Annual utilities employment, a not-seasonally-adjusted series that runs only through 2025, was 18,500.
Those lines have not moved together. From July 2017 to July 2026, construction payrolls rose 24 percent. Information payrolls fell 14 percent, from 73,500 to 63,200. Manufacturing was essentially unchanged, up half a percent. Professional and business services were flat. Utilities jobs were 3 percent lower in 2025 than in 2017. If data centers were supposed to show up as a swarm of local tech jobs, they have not. If they were supposed to show up as extra construction crews, they might have: Ohio added about 53,000 construction jobs over that span. The books cannot tell you how many of those crews were pouring slabs for server halls rather than warehouses, hospitals or houses. They can tell you the information office was not the place the new badges went.
Nationally, the hosting workforce is larger than Ohio’s entire information supersector and still modest. Computing-infrastructure, data-processing and web-hosting employment stood at 463,500 in July 2026, up 45 percent from July 2017, according to the national payroll survey. That series peaked near 489,000 in July 2023 and has since slipped. Utilities employment, by contrast, kept grinding higher, to 608,100. A country can add a lot of computing load without adding a lot of people to watch the racks.
Ohio added construction jobs. Information payrolls shrank.

View exact chart values
| year | manufacturing | construction | information | professional_business | total_nonfarm |
|---|---|---|---|---|---|
| 2015 | 688.2 | 200.2 | 72.1 | 726.7 | 5433.3 |
| 2016 | 688.3 | 204.7 | 72.8 | 736.5 | 5487.4 |
| 2017 | 685.6 | 219.8 | 73.5 | 730.9 | 5522.3 |
| 2018 | 700.5 | 223.2 | 71.9 | 737.9 | 5566.1 |
| 2019 | 704.2 | 226.9 | 71.3 | 742.9 | 5598.9 |
| 2020 | 647.8 | 216.2 | 64 | 685.8 | 5187.6 |
| 2021 | 665 | 224.7 | 66.9 | 727.7 | 5409.1 |
| 2022 | 684.8 | 233.8 | 69.5 | 754.1 | 5548.3 |
| 2023 | 690.2 | 237.6 | 68 | 750.7 | 5627.1 |
| 2024 | 681.6 | 249.9 | 67.3 | 737.3 | 5656.9 |
| 2025 | 675.5 | 259.5 | 65.5 | 729.2 | 5672.6 |
| 2026 | 688.7 | 273.2 | 63.2 | 729 | 5690 |
The residential power bill did rise. It is still not the country’s highest.
The political fight is about electricity prices, and here the household books are not imaginary. Ohio residents spent $8.3 billion on electricity in 2024, or $697 per person, according to BEA consumption figures. That is the residential bill, not the industrial load a hyperscale campus draws off a dedicated feeder. It is also not a rate. It is what households actually spent.
The amount has jumped. In 2017, Ohio’s per-person electricity spending was $516. By 2024 it was $697, a 35 percent increase. The statewide total rose 37 percent. Relative to incomes, it is still a thin slice: $697 was 1.1 percent of Ohio’s 2024 per capita personal income of $64,587. Relative to other data-center states, Ohio is not the outlier the rally made it sound. The U.S. average was $745 per person. Virginia was $720. Texas, which dwarfs Ohio in hosting output, was $810. North Carolina was $694, a rounding error from Ohio.
None of that proves data centers caused the increase, and the books do not let you say they did. Household electricity spending also jumped during the 2022 energy spike, when no one was giving stump speeches about server farms. What the figures do support is narrower, and more useful for a voter staring at a bill: Ohio’s residential electricity outlay per person has risen sharply since 2017, it remains below the national average, and the industry being blamed is still a sliver of the state’s output and an even thinner sliver of its jobs.
Ohio household electricity bills rose 35 percent a person after 2017

View exact chart values
| year | ohio_dollars_per_person | us_dollars_per_person | ohio_pce_millions |
|---|---|---|---|
| 2010 | 505 | 539 | 5827.7 |
| 2011 | 501 | 535 | 5787.1 |
| 2012 | 498 | 519 | 5764.7 |
| 2013 | 513 | 534 | 5959.8 |
| 2014 | 532 | 552 | 6195.1 |
| 2015 | 546 | 552 | 6374 |
| 2016 | 539 | 546 | 6310.3 |
| 2017 | 516 | 544 | 6051.3 |
| 2018 | 564 | 580 | 6637 |
| 2019 | 541 | 567 | 6380.1 |
| 2020 | 521 | 578 | 6144.6 |
| 2021 | 547 | 604 | 6438.1 |
| 2022 | 639 | 697 | 7516.5 |
| 2023 | 652 | 703 | 7696.5 |
| 2024 | 697 | 745 | 8266.2 |
What the quiet actually measured
The Vandalia silence was not a hallucination. Construction payrolls are up. Household power bills are up. The hosting industry on Ohio’s books is more than twice as large as it was in 2017. Those are facts a candidate can use without inventing a new economy. They are also facts that do not add up to “so much money to be made” in the way a rally needs it to add up. A $5.5 billion hosting industry does not replace a $132 billion factory base. Sixty-three thousand information jobs do not replace 689,000 manufacturing jobs. Eighteen thousand utility workers cannot staff a political transformation.
Husted’s pitch, and Trump’s, is that Ohio has to take the campuses or China will. Brown’s pitch is that Ohioans are footing the bill for tax breaks they never asked for. The official record is more boring than either. Ohio took some of the boom, later and smaller than Texas or Virginia. The jobs that grew were in construction. The jobs that shrank were in information. The residential electricity bill rose about $180 a person over seven years and is still not the nation’s highest. If the gym went quiet, it may be because voters can feel a power bill and cannot see a server-farm middle class. The books, for once, are on their side.
Sources and methods
Research uses the pinned catalogue snapshots, not live refreshes. BEA annual state GDP and personal income are from the April 9, 2026 regional release (history through 2025 in the file; the overlapping latest year used here is 2024). BEA state PCE is from the September 26, 2025 SAPCE release (through 2024). BLS state and national payrolls are from the August 24, 2026 CES/SAE snapshots and run through July 2026. Provider lag is normal; these are not current-day observations.
Data processing, hosting and other information services (NAICS 518-519) includes internet access, search and hosting, not only AI data centers. Information supersector employment is broader still. Household electricity in PCE is residential spending, not industrial data-center load, and is not a utility rate. Utilities employment for Ohio is an annual not-seasonally-adjusted series through 2025; other Ohio payrolls are seasonally adjusted July snapshots. Manufacturing GDP is the sum of durable and nondurable goods. Values are nominal except where noted. Missing observations were not treated as zero. No causal effect is inferred from the comparisons.
Research completed 2026-10-05, for the October 4, 2026 news edition. The available source data may cover earlier periods; see the observation periods and source vintages above.