Research
Nvidia is booming. America’s chip factories are not hiring.
A blowout quarter, a groundbreaking, and a missing hiring boom
On Wednesday Nvidia reported $96.22 billion in quarterly revenue, more than double a year earlier, and told Wall Street that demand still outruns supply. Jensen Huang’s line of the week was that “compute is revenue.” A day later SK hynix held a groundbreaking in West Lafayette, Indiana, for a $4 billion high-bandwidth-memory packaging plant that it says will employ about 1,000 people once volume production starts in the second half of 2029. Together the two stories sound like an industrial revival: America, at last, making the chips that make the models.
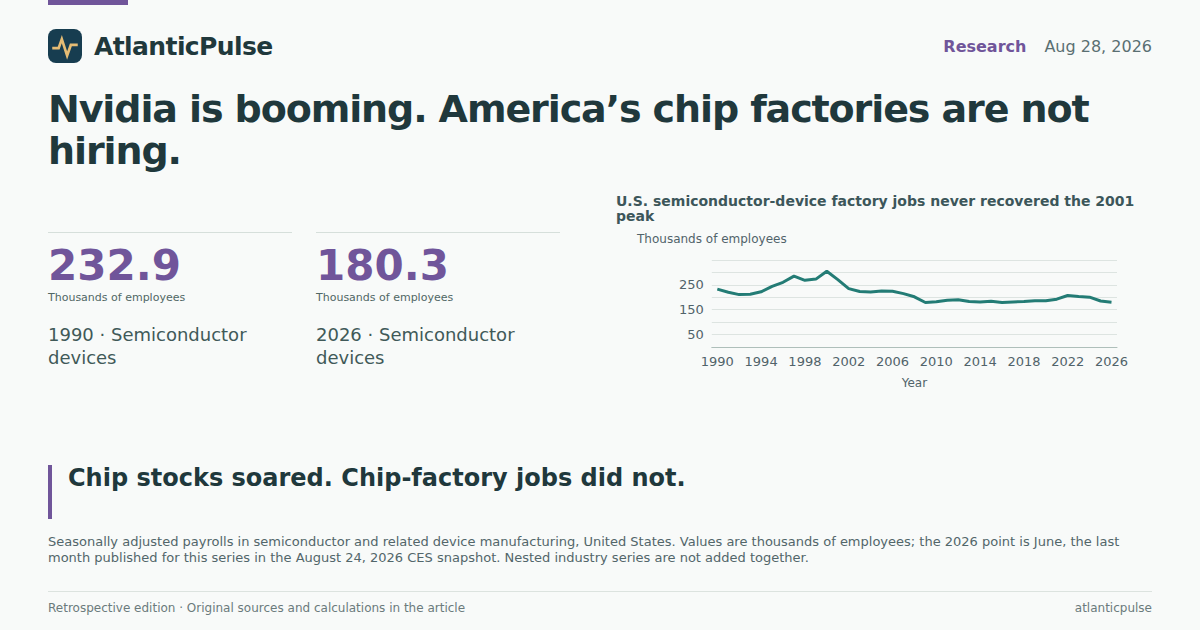
The official payroll books are less cinematic. In the Bureau of Labor Statistics Current Employment Statistics, seasonally adjusted jobs in semiconductor and related device manufacturing stood at 180,300 in June 2026, the last month published for that series in the August 24 snapshot. That is 24.7 percent below January 1990 and 42.1 percent below the series peak of 311,600 in February 2001. The AI boom did produce a bump — 193,000 jobs in January 2022 — and then gave it back. Since then the device-fab payroll is down 6.6 percent. It is also 2 percent below January 2019, before anyone had heard of ChatGPT.
Those are factory jobs, not Nvidia’s market value. CES counts people on U.S. payrolls in a narrow NAICS cell, not wafers, not HBM stacks, and not the contractors who pour concrete for a plant that will not open for three years. The point is simpler, and more awkward for ribbon-cuttings: the country is celebrating a chip renaissance in an industry whose U.S. headcount peaked the winter George W. Bush took office.
U.S. semiconductor-device factory jobs never recovered the 2001 peak

View exact chart values
| year | employees_thousands | as_of |
|---|---|---|
| 1990 | 232.9 | 1990-12 |
| 1991 | 220.5 | 1991-12 |
| 1992 | 211 | 1992-12 |
| 1993 | 212.1 | 1993-12 |
| 1994 | 222 | 1994-12 |
| 1995 | 243.8 | 1995-12 |
| 1996 | 260.4 | 1996-12 |
| 1997 | 285.1 | 1997-12 |
| 1998 | 268.2 | 1998-12 |
| 1999 | 273.2 | 1999-12 |
| 2000 | 305 | 2000-12 |
| 2001 | 271 | 2001-12 |
| 2002 | 234.8 | 2002-12 |
| 2003 | 223.3 | 2003-12 |
| 2004 | 221.3 | 2004-12 |
| 2005 | 224.9 | 2005-12 |
| 2006 | 223.9 | 2006-12 |
| 2007 | 214.9 | 2007-12 |
| 2008 | 202.1 | 2008-12 |
| 2009 | 179.1 | 2009-12 |
| 2010 | 182 | 2010-12 |
| 2011 | 188.2 | 2011-12 |
| 2012 | 189.8 | 2012-12 |
| 2013 | 183 | 2013-12 |
| 2014 | 180.6 | 2014-12 |
| 2015 | 184.4 | 2015-12 |
| 2016 | 179.3 | 2016-12 |
| 2017 | 181.5 | 2017-12 |
| 2018 | 182.5 | 2018-12 |
| 2019 | 185.8 | 2019-12 |
| 2020 | 186 | 2020-12 |
| 2021 | 192.3 | 2021-12 |
| 2022 | 207 | 2022-12 |
| 2023 | 203.5 | 2023-12 |
| 2024 | 200.4 | 2024-12 |
| 2025 | 185.1 | 2025-12 |
| 2026 | 180.3 | 2026-06 |
Software took the boom. The plants did not.
Index the same payrolls to January 2019 and the split is hard to miss. Total private employment is about 6 percent higher. Computer systems design and related services — the closest CES stand-in for the software and IT-services complex that actually ships models — is about 10 percent higher, at 2.37 million jobs in July 2026. That is 13 times the semiconductor-device factory payroll. Semiconductor devices, computer and electronic product manufacturing, and manufacturing as a whole are all still below where they stood on the eve of the pandemic expansion.
The nesting matters. Semiconductor and related devices sit inside “semiconductor and other electronic component manufacturing” (370,200 jobs in July) which sits inside “computer and electronic product manufacturing” (998,000). Those three numbers are layers, not a sum. Even the broadest of them, NAICS 334, is barely half its January 1990 level. Device fabs are 1.43 percent of all U.S. manufacturing jobs. A thousand new packaging jobs in Indiana would be 0.55 percent of the current device-fab payroll.
None of this says Nvidia’s customers are imaginary. It says the people getting paid to design, code, and rack servers are not the same people getting paid to make the silicon. Computer systems design has cooled a little since January 2022, down 1.7 percent, but it is still a much larger, still-larger-than-2019 workforce. The factory series did the opposite: it rose into 2022 and then rolled over while the models, and the capital budgets, kept going. Huang can be right about tokens and still be describing an industry whose American production jobs are not tracking the revenue.
Since ChatGPT, software payrolls held up. Chip factories did not.

View exact chart values
| year | semiconductor_devices | computer_electronic_products | all_manufacturing | computer_systems_design | total_private |
|---|---|---|---|---|---|
| 2019 | 101 | 101.1 | 99.8 | 102.8 | 101.2 |
| 2020 | 101.1 | 97.9 | 95 | 103.2 | 94.8 |
| 2021 | 104.6 | 99.4 | 98 | 111 | 100.2 |
| 2022 | 112.6 | 102.7 | 100.8 | 115.3 | 103.5 |
| 2023 | 110.7 | 101.1 | 100.6 | 113.8 | 104.9 |
| 2024 | 109 | 98 | 99.2 | 112.9 | 105.7 |
| 2025 | 100.7 | 95.9 | 98.4 | 110.5 | 105.9 |
| 2026 | 98 | 96.7 | 98.6 | 109.9 | 106.3 |
The software payroll is more than ten times the chip-factory payroll

View exact chart values
| industry | employees_thousands |
|---|---|
| Semiconductor devices (NAICS 334413) | 180.3 |
| Semiconductor and other electronic components (3344) | 370.2 |
| Computer and electronic products (334) | 998 |
| Computer systems design (5415) | 2366.4 |
The pay is real. The headcount is not the story the groundbreaking tells.
Chip-factory work is not cheap. Average hourly earnings for all employees in semiconductor and related device manufacturing were $57.80 in June 2026, about 1.5 times the $37.62 total-private figure in July and well above manufacturing’s $36.87. Computer systems design pays more still, $63.69. Since January 2019, though, device-fab hourly pay is up 36.8 percent — almost the same as the 36.4 percent rise for the private sector as a whole. The premium was already there. The boom did not widen it. Average weekly hours in the device plants were 40.4 in both January 2019 and the latest month, so this is not a story of a shrunken crew working heroic overtime either.
SK hynix’s promised 1,000 jobs would land in a state that already employs 512,000 people in manufacturing, as of July 2026. That is 0.2 percent of Indiana’s factory payroll, and Indiana’s factory payroll is itself 6 percent below January 2019 and 15.5 percent below January 1990. The plant will package HBM from DRAM wafers made in South Korea, not stand up a greenfield wafer fab. Tom’s Hardware noted production is about a year later than first advertised. A thousand well-paid packaging jobs are not nothing. They are also not a rewrite of the state’s industrial base, or of the national chip-factory series.
The honest reading of the official books is therefore narrow. America still has a semiconductor manufacturing workforce, it pays well, and it is smaller than it was a generation ago and smaller than it was when the generative-AI spending wave began. Nvidia’s quarter measures demand for compute. SK hynix’s shovel measures a 2029 packaging line. Neither is visible yet as a hiring boom in the CES cell that actually counts chip-device makers. If that boom arrives, it will show up as a rise in a series that, as of June 2026, was still heading the other way.
Chip-factory pay is high. It has not pulled away from the rest of the private sector.

View exact chart values
| year | semiconductor_devices | computer_systems_design | manufacturing | total_private |
|---|---|---|---|---|
| 2007 | 36.07 | 39.79 | 21.76 | 21.16 |
| 2008 | 36.18 | 40.53 | 22.63 | 21.95 |
| 2009 | 37.19 | 40.41 | 23.13 | 22.37 |
| 2010 | 38.61 | 40.3 | 23.47 | 22.76 |
| 2011 | 40.23 | 40.8 | 23.81 | 23.22 |
| 2012 | 40.11 | 41.45 | 24.06 | 23.72 |
| 2013 | 42.13 | 42 | 24.59 | 24.18 |
| 2014 | 43.41 | 43.16 | 24.9 | 24.63 |
| 2015 | 42.49 | 44.76 | 25.51 | 25.25 |
| 2016 | 42.11 | 45.6 | 26.3 | 25.93 |
| 2017 | 43.6 | 47.17 | 26.75 | 26.63 |
| 2018 | 42.16 | 48.21 | 27.28 | 27.56 |
| 2019 | 43.26 | 48.92 | 28.14 | 28.38 |
| 2020 | 43.46 | 50.32 | 28.99 | 29.91 |
| 2021 | 48.07 | 53.43 | 30.34 | 31.39 |
| 2022 | 46.28 | 55.75 | 31.48 | 32.94 |
| 2023 | 47.43 | 56.61 | 33.23 | 34.29 |
| 2024 | 54.58 | 60.64 | 34.56 | 35.69 |
| 2025 | 57.71 | 63.05 | 36.08 | 37.02 |
| 2026 | 57.8 | 63.69 | 36.87 | 37.62 |
Indiana already has half a million factory jobs. One thousand more is a rounding error.

View exact chart values
| year | employees_thousands |
|---|---|
| 1990 | 591.4 |
| 1991 | 591.3 |
| 1992 | 600.6 |
| 1993 | 619.8 |
| 1994 | 644.2 |
| 1995 | 655.2 |
| 1996 | 647.1 |
| 1997 | 654.1 |
| 1998 | 654.8 |
| 1999 | 671.3 |
| 2000 | 649.3 |
| 2001 | 590.8 |
| 2002 | 585.2 |
| 2003 | 570.7 |
| 2004 | 572.3 |
| 2005 | 570.8 |
| 2006 | 556.1 |
| 2007 | 544.2 |
| 2008 | 487.3 |
| 2009 | 437.9 |
| 2010 | 453 |
| 2011 | 469 |
| 2012 | 485.4 |
| 2013 | 496.8 |
| 2014 | 514.7 |
| 2015 | 520.4 |
| 2016 | 526.2 |
| 2017 | 538.3 |
| 2018 | 543.8 |
| 2019 | 537.8 |
| 2020 | 517.3 |
| 2021 | 533.3 |
| 2022 | 541.9 |
| 2023 | 528.1 |
| 2024 | 519.5 |
| 2025 | 515.4 |
| 2026 | 512 |
Sources and methods
This is retrospective enrichment using pinned catalogue snapshots, not an as-known-on-the-edition-date reconstruction. Research was compiled on 11 September 2026 from extracts retrieved that day. The AtlanticPulse edition date is 28 August 2026. Later BLS revisions may already be in the snapshots.
Employment, hours and earnings are monthly Current Employment Statistics series from the U.S. Bureau of Labor Statistics, seasonally adjusted, United States, CES snapshot dated 24 August 2026 (release id bls-ce-snapshot-2026-08-24). Semiconductor and related device manufacturing employment, hours and hourly earnings end in June 2026 in that snapshot; the broader manufacturing, computer-and-electronic-products, semiconductor-and-other-electronic-components, computer-systems-design and total-private series used here run through July 2026. Units are thousands of employees or dollars per hour as labelled. Average hourly earnings are not adjusted for inflation.
Indiana manufacturing employment is the seasonally adjusted statewide SAE series from the BLS State and Area Employment snapshot dated 24 August 2026, through July 2026.
NAICS nesting is preserved: semiconductor and related devices (334413) is inside semiconductor and other electronic component manufacturing (3344), which is inside computer and electronic product manufacturing (334). Those levels are not added. Computer systems design and related services is a separate professional-and-business-services industry, not a factory count. Missing values were not treated as zero; the first observation per period was kept.
The SK hynix figure of about 1,000 jobs and a second-half 2029 start is from 28 August 2026 reporting, not from BLS. Comparing that promised future headcount with current CES/SAE levels is a scale check, not a forecast of whether the plant will be built or staffed. Nvidia’s revenue figures are from the same day’s earnings reporting and are not in the payroll extracts. No causal claim is made that AI revenue should have raised factory headcount one-for-one.
Research completed 2026-09-11, for the August 28, 2026 news edition. This is retrospective analysis, not a reconstruction of information available that day.