Research
Ninety dollars, three days of average care
The cheque in the mail
Four weeks before the midterms, the White House is putting money in seniors’ accounts. The Centers for Medicare & Medicaid Services is sending a one-time $90 payment, drawn from the Medicare Improvement Fund, to about 20.8 million people enrolled in Medicare Part B who do not get Medicaid premium help and do not pay an income-related surcharge. Medicare Advantage members are excluded. Direct deposits are due around October 8, with paper cheques later in the month, a Nexstar explainer reported. The administration says the money is meant to offset premium costs. That same reporting puts typical Part B monthly costs starting around $200, which would make $90 a bit less than half of one month’s sticker price — if you qualify, and if you are not on Advantage.
It is a real cheque. It is also a small one next to the health bill already on the books. The latest complete year of Bureau of Economic Analysis state consumption accounts is 2024, published in the SAPCE release dated 26 September 2025. Those accounts are not a Medicare ledger. They record what households in a given place consumed, divided by the resident population, in current dollars. They do not tell you what a 74-year-old in Tampa paid for Part B. They do tell you how large the country’s ordinary health-care bill had already become before anyone printed “Medicare Improvement Fund Payment” on a Treasury cheque.
The $90 cheque next to a month of average care

View exact chart values
| item | usd |
|---|---|
| One-time $90 rebate | 90 |
| Average daily per-person health-care services, US 2024 | 26.7 |
| Average monthly per-person health-care services, US 2024 | 812 |
What $9,747 actually buys
In 2024, Americans spent $9,747 per person on health-care services — outpatient care, hospitals and nursing homes — according to BEA’s per capita personal consumption series. That is $812 a month, or about $26.70 a day if you simply divide the year by 365. Against that average, a $90 rebate covers 3.4 days of per-person health-care services, or 0.92 percent of the annual total. It is 11 percent of one average month. The comparison is generous to the cheque: the BEA figure is an all-resident average, so it blends children, working-age adults and retirees. Medicare enrollees typically use more care than that average. If the typical senior’s services bill is higher than $9,747, $90 covers even fewer days.
That $9,747 is also not the whole medical tab. BEA’s per capita “health care” line is services. It does not include prescription drugs, and it does not include net health insurance — the service of being insured, recorded under financial services. Even on the narrower services definition, the bill has grown faster than the rest of the household budget. Per-person health-care services were $2,901 in 1997. They have risen 236 percent in current dollars, against a 188 percent rise in total per capita consumption. Health-care services were 14.3 percent of all personal consumption in 1997 and 16.7 percent in 2024, after a brief 2020 dip when people deferred care. In 2024 the services line was still climbing: 7.3 percent above 2023.
Per-person U.S. health-care services spending, 1997–2024

View exact chart values
| year | pcap_health_usd | pcap_total_usd | health_share_of_pce_pct | yoy_health_pct | index_1997 | function_health_bil | net_health_ins_bil |
|---|---|---|---|---|---|---|---|
| 1997 | 2901 | 20308 | 14.29 | — | 100 | 919.9 | 73.5 |
| 1998 | 3016 | 21306 | 14.16 | 3.96 | 104 | 979.7 | 80.8 |
| 1999 | 3095 | 22519 | 13.74 | 2.62 | 106.7 | 1033.3 | 85.7 |
| 2000 | 3255 | 23983 | 13.57 | 5.17 | 112.2 | 1109.6 | 94.4 |
| 2001 | 3497 | 24823 | 14.09 | 7.43 | 120.5 | 1209.4 | 101.1 |
| 2002 | 3765 | 25550 | 14.74 | 7.66 | 129.8 | 1317.1 | 106.5 |
| 2003 | 3978 | 26682 | 14.91 | 5.66 | 137.1 | 1410.7 | 116.7 |
| 2004 | 4231 | 28114 | 15.05 | 6.36 | 145.8 | 1514.9 | 116.5 |
| 2005 | 4469 | 29674 | 15.06 | 5.63 | 154.1 | 1612.3 | 129.4 |
| 2006 | 4665 | 31092 | 15 | 4.39 | 160.8 | 1715 | 130.6 |
| 2007 | 4907 | 32356 | 15.17 | 5.19 | 169.1 | 1823.2 | 131.3 |
| 2008 | 5115 | 33049 | 15.48 | 4.24 | 176.3 | 1909.3 | 129.1 |
| 2009 | 5322 | 32243 | 16.51 | 4.05 | 183.5 | 1999.3 | 122.4 |
| 2010 | 5493 | 33164 | 16.56 | 3.21 | 189.3 | 2078.1 | 143 |
| 2011 | 5635 | 34309 | 16.42 | 2.59 | 194.2 | 2153.2 | 153.3 |
| 2012 | 5794 | 35145 | 16.49 | 2.82 | 199.7 | 2230.7 | 145.8 |
| 2013 | 5884 | 35956 | 16.36 | 1.55 | 202.8 | 2285.2 | 154.1 |
| 2014 | 6094 | 37194 | 16.38 | 3.57 | 210.1 | 2395.1 | 177 |
| 2015 | 6400 | 38213 | 16.75 | 5.02 | 220.6 | 2536.3 | 187.1 |
| 2016 | 6674 | 39238 | 17.01 | 4.28 | 230.1 | 2652.1 | 200.1 |
| 2017 | 6875 | 40693 | 16.89 | 3.01 | 237 | 2745.5 | 215.2 |
| 2018 | 7137 | 42415 | 16.83 | 3.81 | 246 | 2867 | 248.9 |
| 2019 | 7487 | 43720 | 17.12 | 4.9 | 258.1 | 3028.3 | 232 |
| 2020 | 7100 | 42920 | 16.54 | -5.17 | 244.7 | 2944.5 | 238.7 |
| 2021 | 7956 | 48539 | 16.39 | 12.06 | 274.3 | 3254.9 | 245.6 |
| 2022 | 8440 | 52961 | 15.94 | 6.08 | 290.9 | 3479.9 | 251.9 |
| 2023 | 9087 | 55917 | 16.25 | 7.67 | 313.2 | 3785.3 | 259.9 |
| 2024 | 9747 | 58499 | 16.66 | 7.26 | 336 | 4088.3 | 270.1 |
Health-care services as a share of all household spending

View exact chart values
| year | pcap_health_usd | pcap_total_usd | health_share_of_pce_pct | yoy_health_pct | index_1997 | function_health_bil | net_health_ins_bil |
|---|---|---|---|---|---|---|---|
| 1997 | 2901 | 20308 | 14.29 | — | 100 | 919.9 | 73.5 |
| 1998 | 3016 | 21306 | 14.16 | 3.96 | 104 | 979.7 | 80.8 |
| 1999 | 3095 | 22519 | 13.74 | 2.62 | 106.7 | 1033.3 | 85.7 |
| 2000 | 3255 | 23983 | 13.57 | 5.17 | 112.2 | 1109.6 | 94.4 |
| 2001 | 3497 | 24823 | 14.09 | 7.43 | 120.5 | 1209.4 | 101.1 |
| 2002 | 3765 | 25550 | 14.74 | 7.66 | 129.8 | 1317.1 | 106.5 |
| 2003 | 3978 | 26682 | 14.91 | 5.66 | 137.1 | 1410.7 | 116.7 |
| 2004 | 4231 | 28114 | 15.05 | 6.36 | 145.8 | 1514.9 | 116.5 |
| 2005 | 4469 | 29674 | 15.06 | 5.63 | 154.1 | 1612.3 | 129.4 |
| 2006 | 4665 | 31092 | 15 | 4.39 | 160.8 | 1715 | 130.6 |
| 2007 | 4907 | 32356 | 15.17 | 5.19 | 169.1 | 1823.2 | 131.3 |
| 2008 | 5115 | 33049 | 15.48 | 4.24 | 176.3 | 1909.3 | 129.1 |
| 2009 | 5322 | 32243 | 16.51 | 4.05 | 183.5 | 1999.3 | 122.4 |
| 2010 | 5493 | 33164 | 16.56 | 3.21 | 189.3 | 2078.1 | 143 |
| 2011 | 5635 | 34309 | 16.42 | 2.59 | 194.2 | 2153.2 | 153.3 |
| 2012 | 5794 | 35145 | 16.49 | 2.82 | 199.7 | 2230.7 | 145.8 |
| 2013 | 5884 | 35956 | 16.36 | 1.55 | 202.8 | 2285.2 | 154.1 |
| 2014 | 6094 | 37194 | 16.38 | 3.57 | 210.1 | 2395.1 | 177 |
| 2015 | 6400 | 38213 | 16.75 | 5.02 | 220.6 | 2536.3 | 187.1 |
| 2016 | 6674 | 39238 | 17.01 | 4.28 | 230.1 | 2652.1 | 200.1 |
| 2017 | 6875 | 40693 | 16.89 | 3.01 | 237 | 2745.5 | 215.2 |
| 2018 | 7137 | 42415 | 16.83 | 3.81 | 246 | 2867 | 248.9 |
| 2019 | 7487 | 43720 | 17.12 | 4.9 | 258.1 | 3028.3 | 232 |
| 2020 | 7100 | 42920 | 16.54 | -5.17 | 244.7 | 2944.5 | 238.7 |
| 2021 | 7956 | 48539 | 16.39 | 12.06 | 274.3 | 3254.9 | 245.6 |
| 2022 | 8440 | 52961 | 15.94 | 6.08 | 290.9 | 3479.9 | 251.9 |
| 2023 | 9087 | 55917 | 16.25 | 7.67 | 313.2 | 3785.3 | 259.9 |
| 2024 | 9747 | 58499 | 16.66 | 7.26 | 336 | 4088.3 | 270.1 |
A $4.1 trillion function, and a much smaller insurance line
Widen the lens to BEA’s “health” function — services plus medical products — and the 2024 total is $4.09 trillion. Hospitals were $1.49 trillion, 36.5 percent of that function. Physician services were $793 billion, pharmaceuticals $669 billion, nursing homes $249 billion. The leftover $884 billion is dental care, other paramedical services and medical equipment. Those are national aggregates, not household averages, and they are not Medicare outlays. They are what the consumption accounts say American households absorbed in a single year.
Health insurance sits next door, not inside that $4.09 trillion. BEA’s “net health insurance” line — premiums less benefits, the cost of the insurance service itself — was $270 billion in 2024, of which $229 billion was medical care and hospitalization insurance. Multiply 20.8 million enrollees by $90 and the rebate pool is $1.87 billion. That is 0.7 percent of the 2024 net health-insurance line. It is a rounding error on hospitals. It is not nothing in a checking account. The political design is obvious: a visible deposit, a letter from the president, a premium-offset caption. The books’ design is less cinematic. They keep adding hospitals, drugs and nursing homes in nine- and ten-figure increments, year after year, while $90 arrives once.
Where the $4.1 trillion health bill went in 2024

View exact chart values
| category | billions_2024 | share_of_function_health_pct |
|---|---|---|
| Hospitals | 1493.6 | 36.5 |
| Physician services | 793.3 | 19.4 |
| Pharmaceutical products | 669 | 16.4 |
| Nursing homes | 248.7 | 6.1 |
| Other health (dental, paramedical, equipment) | 883.7 | 21.6 |
The same $90 in New York and Texas
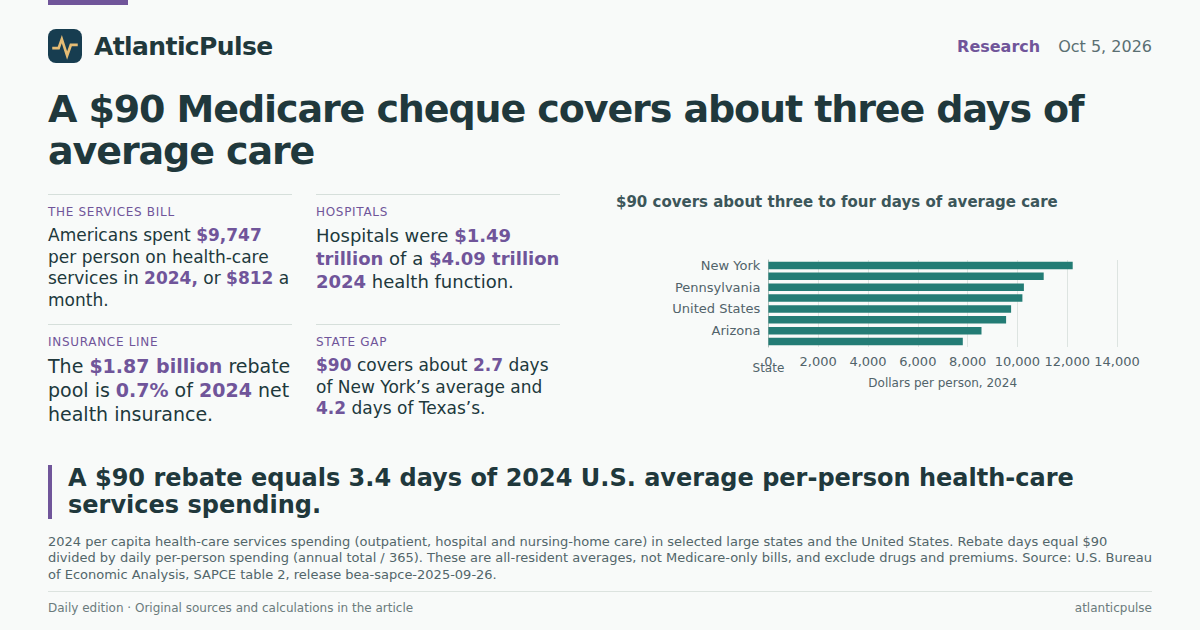
The per-person services bill is not uniform. Among a handful of large states in the 2024 accounts, New York spent $12,221 per resident on health-care services. California spent $11,054, Pennsylvania $10,262, Ohio $10,202. Florida, which has more than its share of Medicare-age residents, was $9,545 — close to the national average. Arizona was $8,556. Texas was $7,807. The $90 cheque therefore “covers” about 2.7 days of average care in New York and 4.2 days in Texas, if you use the same crude daily conversion. That is not because Texans got a better rebate. It is because the state’s average services bill is lower. BEA does not say whether Texas seniors face cheaper Part B premiums — they do not; Part B is federal — or cheaper local hospital and physician consumption. The state gap is real. It is also an average of everyone who lives there, including people who will never see this cheque.
Florida is the reminder not to confuse a retirement magnet with a high services bill. Its 2024 per-person health-care services figure sat slightly below the U.S. average even as the state’s politics run through Medicare. California and New York, with younger mixes than Florida, still posted much higher per-person services spending. Price, intensity of care and what gets counted as consumption all differ. The rebate does not. Ninety dollars is ninety dollars in Buffalo and in Brownsville. The underlying bill is not.
$90 covers about three to four days of average care

View exact chart values
| state | pcap_health_2024_usd | monthly_usd | rebate_days | rebate_share_annual_pct |
|---|---|---|---|---|
| New York | 12221 | 1018 | 2.69 | 0.74 |
| California | 11054 | 921 | 2.97 | 0.81 |
| Pennsylvania | 10262 | 855 | 3.2 | 0.88 |
| Ohio | 10202 | 850 | 3.22 | 0.88 |
| United States | 9747 | 812 | 3.37 | 0.92 |
| Florida | 9545 | 795 | 3.44 | 0.94 |
| Arizona | 8556 | 713 | 3.84 | 1.05 |
| Texas | 7807 | 651 | 4.21 | 1.15 |
What the books cannot say
Three caveats sit on top of every comparison. First, 2024 is the last closed year in this vintage. It is not 2026, and it is not a forecast of October premiums. Second, BEA consumption is not a senior’s invoice. Per-person services spending understates what Medicare patients consume and overstates what a healthy 30-year-old consumes. Third, net health insurance is not a premium. It is premiums minus benefits, a national control total, not what CMS deducts from a Social Security check. The reporting that Part B “starts around $200” a month is a better match for the $90 offset than any BEA line, and even that $200 is a starting point that varies with income.
What the books can say is simpler, and enough. By 2024 the country was already spending $9,747 a head on health-care services, $4.09 trillion on the broader health function, and $270 billion on the insurance service. A $90 deposit, sent to a subset of Part B enrollees, covers a few days of the average services bill and less than one percent of the insurance line. That does not make the deposit fake. It makes it a midterm instrument — visible, one-time, and small next to a bill that has more than tripled per person since 1997.
Sources and methods
Observation vintage is BEA SAPCE state personal consumption, release bea-sapce-2025-09-26, calendar years 1997–2024. The last closed year is 2024, not 2026. Provider lag is normal; these are not current-month observations.
Per capita ‘health care’ (SAPCE table 2) is outpatient, hospital and nursing-home services in current dollars per resident. It excludes prescription drugs and net health insurance. The ‘health’ function (SAPCE table 4) adds medical products, including pharmaceuticals. Net health insurance is a financial-services line (premiums less benefits), not a premium schedule.
Dollar figures labelled billions are millions of current dollars divided by 1,000. Daily and monthly rates divide annual per-person services by 365 or 12. Rebate days divide $90 by that daily rate. The $1.87 billion pool multiplies the reported 20.8 million Part B recipients by $90. Nulls were not treated as zero; no status flags appeared on used rows.
State figures are all-resident averages for selected large states, not a ranking of all 50 and not a Medicare-enrollee sample. New York’s higher per-person total does not mean Part B premiums differ by state. No causal claim is made that the rebate changes utilization, premiums or votes.
Research completed 2026-10-06, for the October 5, 2026 news edition. The available source data may cover earlier periods; see the observation periods and source vintages above.