Research
New Jersey’s layoff year is showing up in payrolls — just not as a warehouse collapse
A closing, a WARN pile, and a quieter payroll tape
HelloFresh told New Jersey it will shut the Swedesboro distribution center by November 17 and cut 374 jobs, folding a 170,000-square-foot site into the rest of its network. The notice landed on a statewide pile: more than 11,500 announced cuts in 2026, from Amazon Fresh stores to Samsung, Novartis, Verizon and Spirit Airlines. That is a lot of pink-paper theater for one year. It is not, by itself, a labor-market measurement.
WARN notices are promises to fire people on a date. Payrolls are a count of people who still had a job last month. The two files are cousins, not twins. The official tape that can answer whether New Jersey has already lost the jobs is the Bureau of Labor Statistics State and Area Employment series, not a running total of press releases. Through July 2026 — the latest month in the pinned snapshot — the state is no longer setting records. It is also not falling off a cliff.
Seasonally adjusted total nonfarm employment in New Jersey stood at 4,357,600 in July 2026, down 19,600, or 0.45 percent, from July 2025. The peak in this extract is earlier: 4,391,300 in May 2025. From January 2026 to July the state lost 26,400 jobs, a 0.6 percent slip. That is a downturn. It is also still 3.45 percent above December 2019. The pandemic hole of April 2020, when payrolls fell to 3,501,600, has been filled for years. What has changed is the direction.
New Jersey payrolls peaked in 2025, then slipped

View exact chart values
| month | date | jobs_thousands |
|---|---|---|
| 2019-01 | 2019-01-01 | 4187.8 |
| 2019-02 | 2019-02-01 | 4187.4 |
| 2019-03 | 2019-03-01 | 4192.9 |
| 2019-04 | 2019-04-01 | 4196.2 |
| 2019-05 | 2019-05-01 | 4193.8 |
| 2019-06 | 2019-06-01 | 4200.6 |
| 2019-07 | 2019-07-01 | 4206.1 |
| 2019-08 | 2019-08-01 | 4201.4 |
| 2019-09 | 2019-09-01 | 4201.4 |
| 2019-10 | 2019-10-01 | 4203.2 |
| 2019-11 | 2019-11-01 | 4215.5 |
| 2019-12 | 2019-12-01 | 4212.3 |
| 2020-01 | 2020-01-01 | 4219.5 |
| 2020-02 | 2020-02-01 | 4225.3 |
| 2020-03 | 2020-03-01 | 4195.6 |
| 2020-04 | 2020-04-01 | 3501.6 |
| 2020-05 | 2020-05-01 | 3516 |
| 2020-06 | 2020-06-01 | 3576.5 |
| 2020-07 | 2020-07-01 | 3705.2 |
| 2020-08 | 2020-08-01 | 3780.1 |
| 2020-09 | 2020-09-01 | 3869.6 |
| 2020-10 | 2020-10-01 | 3900.5 |
| 2020-11 | 2020-11-01 | 3905.2 |
| 2020-12 | 2020-12-01 | 3909.3 |
| 2021-01 | 2021-01-01 | 3935.9 |
| 2021-02 | 2021-02-01 | 3941.8 |
| 2021-03 | 2021-03-01 | 3958.4 |
| 2021-04 | 2021-04-01 | 3983.5 |
| 2021-05 | 2021-05-01 | 3995 |
| 2021-06 | 2021-06-01 | 4004.2 |
| 2021-07 | 2021-07-01 | 4050.6 |
| 2021-08 | 2021-08-01 | 4058 |
| 2021-09 | 2021-09-01 | 4073 |
| 2021-10 | 2021-10-01 | 4131.3 |
| 2021-11 | 2021-11-01 | 4147.5 |
| 2021-12 | 2021-12-01 | 4168.8 |
| 2022-01 | 2022-01-01 | 4170.5 |
| 2022-02 | 2022-02-01 | 4208.5 |
| 2022-03 | 2022-03-01 | 4218.2 |
| 2022-04 | 2022-04-01 | 4225.4 |
| 2022-05 | 2022-05-01 | 4229.8 |
| 2022-06 | 2022-06-01 | 4228 |
| 2022-07 | 2022-07-01 | 4261 |
| 2022-08 | 2022-08-01 | 4268.4 |
| 2022-09 | 2022-09-01 | 4265.6 |
| 2022-10 | 2022-10-01 | 4266.4 |
| 2022-11 | 2022-11-01 | 4277.4 |
| 2022-12 | 2022-12-01 | 4281 |
| 2023-01 | 2023-01-01 | 4298.8 |
| 2023-02 | 2023-02-01 | 4301.7 |
| 2023-03 | 2023-03-01 | 4303.5 |
| 2023-04 | 2023-04-01 | 4288.4 |
| 2023-05 | 2023-05-01 | 4310.9 |
| 2023-06 | 2023-06-01 | 4322.3 |
| 2023-07 | 2023-07-01 | 4317.3 |
| 2023-08 | 2023-08-01 | 4324.6 |
| 2023-09 | 2023-09-01 | 4337.9 |
| 2023-10 | 2023-10-01 | 4328 |
| 2023-11 | 2023-11-01 | 4333.9 |
| 2023-12 | 2023-12-01 | 4342.6 |
| 2024-01 | 2024-01-01 | 4340.1 |
| 2024-02 | 2024-02-01 | 4345.6 |
| 2024-03 | 2024-03-01 | 4350.8 |
| 2024-04 | 2024-04-01 | 4349.3 |
| 2024-05 | 2024-05-01 | 4351.1 |
| 2024-06 | 2024-06-01 | 4359.6 |
| 2024-07 | 2024-07-01 | 4348.4 |
| 2024-08 | 2024-08-01 | 4350.8 |
| 2024-09 | 2024-09-01 | 4365.7 |
| 2024-10 | 2024-10-01 | 4369.1 |
| 2024-11 | 2024-11-01 | 4370.8 |
| 2024-12 | 2024-12-01 | 4375.4 |
| 2025-01 | 2025-01-01 | 4374.1 |
| 2025-02 | 2025-02-01 | 4377.3 |
| 2025-03 | 2025-03-01 | 4377.6 |
| 2025-04 | 2025-04-01 | 4380.8 |
| 2025-05 | 2025-05-01 | 4391.3 |
| 2025-06 | 2025-06-01 | 4379.1 |
| 2025-07 | 2025-07-01 | 4377.2 |
| 2025-08 | 2025-08-01 | 4369.5 |
| 2025-09 | 2025-09-01 | 4373.8 |
| 2025-10 | 2025-10-01 | 4373.4 |
| 2025-11 | 2025-11-01 | 4375.1 |
| 2025-12 | 2025-12-01 | 4380.5 |
| 2026-01 | 2026-01-01 | 4384 |
| 2026-02 | 2026-02-01 | 4375.8 |
| 2026-03 | 2026-03-01 | 4378.9 |
| 2026-04 | 2026-04-01 | 4386 |
| 2026-05 | 2026-05-01 | 4387.4 |
| 2026-06 | 2026-06-01 | 4383.2 |
| 2026-07 | 2026-07-01 | 4357.6 |
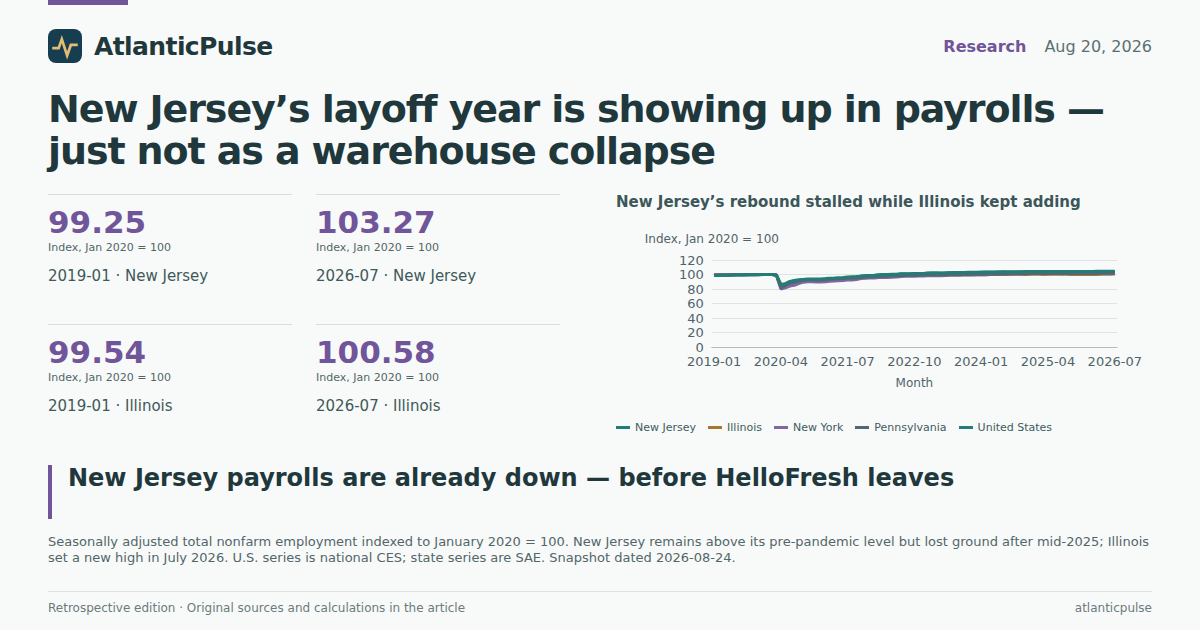
Illinois really is at a high. New Jersey is not.
The contrast with Illinois is the point of the week’s other jobs headline. Illinois seasonally adjusted nonfarm employment reached 6,176,400 in July 2026, the highest reading in this 2015–2026 extract, up 11,900, or 0.19 percent, from a year earlier. The United States, on the national Current Employment Statistics payroll survey, was up 0.20 percent over the same twelve months, to 158.86 million. New Jersey underperformed both.
Neighbors did not copy New Jersey’s slide. New York was up 0.21 percent year over year in July. Pennsylvania was up 0.52 percent. Indexed to January 2020, New Jersey is still ahead of Illinois — the Garden State recovered faster after 2020 — but the lines have stopped telling the same story. Illinois kept grinding out small gains into mid-2026. New Jersey’s index rolled over after the 2025 peak.
None of that converts 11,500 announced layoffs into 11,500 missing paychecks. Establishment payrolls are a net. Firms hire while other firms send WARN letters. Some of 2026’s announced cuts had not taken effect by July; HelloFresh’s 374 jobs are dated to November. Some earlier cuts are already in the numbers. The honest reading is narrower and more useful: by last summer, New Jersey had already given back its late-cycle gains, and Illinois had not.
New Jersey’s rebound stalled while Illinois kept adding

View exact chart values
| month | date | nj | il | ny | pa | us |
|---|---|---|---|---|---|---|
| 2019-01 | 2019-01-01 | 99.25 | 99.54 | 99.29 | 99.29 | 98.7 |
| 2019-02 | 2019-02-01 | 99.24 | 99.51 | 99.35 | 99.26 | 98.71 |
| 2019-03 | 2019-03-01 | 99.37 | 99.55 | 99.51 | 99.4 | 98.86 |
| 2019-04 | 2019-04-01 | 99.45 | 99.78 | 99.62 | 99.51 | 99.05 |
| 2019-05 | 2019-05-01 | 99.39 | 99.85 | 99.62 | 99.56 | 99.07 |
| 2019-06 | 2019-06-01 | 99.55 | 99.88 | 99.7 | 99.54 | 99.22 |
| 2019-07 | 2019-07-01 | 99.68 | 99.87 | 99.56 | 99.66 | 99.28 |
| 2019-08 | 2019-08-01 | 99.57 | 99.85 | 99.57 | 99.9 | 99.43 |
| 2019-09 | 2019-09-01 | 99.57 | 99.82 | 99.76 | 99.85 | 99.56 |
| 2019-10 | 2019-10-01 | 99.61 | 99.8 | 99.65 | 99.86 | 99.62 |
| 2019-11 | 2019-11-01 | 99.91 | 99.73 | 99.82 | 99.94 | 99.76 |
| 2019-12 | 2019-12-01 | 99.83 | 99.8 | 99.81 | 99.94 | 99.84 |
| 2020-01 | 2020-01-01 | 100 | 100 | 100 | 100 | 100 |
| 2020-02 | 2020-02-01 | 100.14 | 99.95 | 100.07 | 99.93 | 100.17 |
| 2020-03 | 2020-03-01 | 99.43 | 99.09 | 98.91 | 99.16 | 99.25 |
| 2020-04 | 2020-04-01 | 82.99 | 86.67 | 79.91 | 81.49 | 85.79 |
| 2020-05 | 2020-05-01 | 83.33 | 86.94 | 81.51 | 84.81 | 87.51 |
| 2020-06 | 2020-06-01 | 84.76 | 88.83 | 83.95 | 88.26 | 90.55 |
| 2020-07 | 2020-07-01 | 87.81 | 90.66 | 85.14 | 90.28 | 91.6 |
| 2020-08 | 2020-08-01 | 89.59 | 91.85 | 87.25 | 91.2 | 92.63 |
| 2020-09 | 2020-09-01 | 91.71 | 92.22 | 89.32 | 92.06 | 93.25 |
| 2020-10 | 2020-10-01 | 92.44 | 92.73 | 90.01 | 92.63 | 93.7 |
| 2020-11 | 2020-11-01 | 92.55 | 92.22 | 90.13 | 92.77 | 93.88 |
| 2020-12 | 2020-12-01 | 92.65 | 92.1 | 89.84 | 92.09 | 93.76 |
| 2021-01 | 2021-01-01 | 93.28 | 92.69 | 89.84 | 92.62 | 93.97 |
| 2021-02 | 2021-02-01 | 93.42 | 93.19 | 90.1 | 92.88 | 94.31 |
| 2021-03 | 2021-03-01 | 93.81 | 93.67 | 90.67 | 93.57 | 94.87 |
| 2021-04 | 2021-04-01 | 94.41 | 93.99 | 91.12 | 93.69 | 95.1 |
| 2021-05 | 2021-05-01 | 94.68 | 93.88 | 91.32 | 94 | 95.42 |
| 2021-06 | 2021-06-01 | 94.9 | 94.15 | 91.53 | 94.35 | 95.91 |
| 2021-07 | 2021-07-01 | 96 | 94.79 | 92.22 | 94.91 | 96.53 |
| 2021-08 | 2021-08-01 | 96.17 | 94.89 | 92.44 | 95.13 | 96.9 |
| 2021-09 | 2021-09-01 | 96.53 | 95.06 | 93.12 | 95.12 | 97.2 |
| 2021-10 | 2021-10-01 | 97.91 | 96.05 | 94.39 | 96.02 | 97.72 |
| 2021-11 | 2021-11-01 | 98.29 | 96.4 | 94.78 | 96.42 | 98.16 |
| 2021-12 | 2021-12-01 | 98.8 | 96.91 | 95.2 | 96.75 | 98.54 |
| 2022-01 | 2022-01-01 | 98.84 | 96.94 | 95.04 | 96.8 | 98.67 |
| 2022-02 | 2022-02-01 | 99.74 | 97.33 | 95.76 | 97.41 | 99.21 |
| 2022-03 | 2022-03-01 | 99.97 | 97.53 | 95.97 | 97.69 | 99.53 |
| 2022-04 | 2022-04-01 | 100.14 | 97.92 | 96.04 | 98.03 | 99.73 |
| 2022-05 | 2022-05-01 | 100.24 | 97.89 | 96.31 | 98.18 | 99.93 |
| 2022-06 | 2022-06-01 | 100.2 | 98.04 | 96.62 | 98.15 | 100.22 |
| 2022-07 | 2022-07-01 | 100.98 | 98.71 | 97.32 | 98.69 | 100.68 |
| 2022-08 | 2022-08-01 | 101.16 | 98.81 | 97.55 | 98.76 | 100.88 |
| 2022-09 | 2022-09-01 | 101.09 | 98.87 | 97.52 | 98.92 | 101.02 |
| 2022-10 | 2022-10-01 | 101.11 | 98.87 | 97.69 | 98.99 | 101.26 |
| 2022-11 | 2022-11-01 | 101.37 | 98.98 | 97.83 | 99.06 | 101.45 |
| 2022-12 | 2022-12-01 | 101.46 | 98.86 | 97.8 | 99.15 | 101.52 |
| 2023-01 | 2023-01-01 | 101.88 | 99.53 | 98.2 | 99.57 | 101.81 |
| 2023-02 | 2023-02-01 | 101.95 | 99.49 | 98.24 | 99.58 | 102 |
| 2023-03 | 2023-03-01 | 101.99 | 99.58 | 98.33 | 99.67 | 102.04 |
| 2023-04 | 2023-04-01 | 101.63 | 99.49 | 98.32 | 99.73 | 102.2 |
| 2023-05 | 2023-05-01 | 102.17 | 99.47 | 98.66 | 99.73 | 102.38 |
| 2023-06 | 2023-06-01 | 102.44 | 100.14 | 98.99 | 100.08 | 102.53 |
| 2023-07 | 2023-07-01 | 102.32 | 99.74 | 99 | 100.04 | 102.64 |
| 2023-08 | 2023-08-01 | 102.49 | 99.7 | 99.05 | 100.17 | 102.78 |
| 2023-09 | 2023-09-01 | 102.81 | 99.86 | 99.18 | 100.23 | 102.88 |
| 2023-10 | 2023-10-01 | 102.57 | 99.6 | 99.18 | 100.18 | 102.99 |
| 2023-11 | 2023-11-01 | 102.71 | 99.68 | 99.25 | 100.27 | 103.07 |
| 2023-12 | 2023-12-01 | 102.92 | 99.63 | 99.54 | 100.43 | 103.17 |
| 2024-01 | 2024-01-01 | 102.86 | 99.68 | 99.65 | 100.45 | 103.29 |
| 2024-02 | 2024-02-01 | 102.99 | 99.75 | 99.78 | 100.56 | 103.42 |
| 2024-03 | 2024-03-01 | 103.11 | 99.95 | 100.08 | 100.7 | 103.57 |
| 2024-04 | 2024-04-01 | 103.08 | 99.95 | 100.36 | 100.63 | 103.62 |
| 2024-05 | 2024-05-01 | 103.12 | 100.07 | 100.49 | 100.73 | 103.67 |
| 2024-06 | 2024-06-01 | 103.32 | 100.06 | 100.8 | 100.82 | 103.73 |
| 2024-07 | 2024-07-01 | 103.05 | 100.22 | 100.51 | 100.81 | 103.76 |
| 2024-08 | 2024-08-01 | 103.11 | 100.25 | 100.57 | 100.96 | 103.77 |
| 2024-09 | 2024-09-01 | 103.46 | 100.24 | 100.94 | 101.08 | 103.87 |
| 2024-10 | 2024-10-01 | 103.55 | 100.21 | 100.88 | 101.13 | 103.89 |
| 2024-11 | 2024-11-01 | 103.59 | 100.2 | 101.01 | 101.12 | 103.98 |
| 2024-12 | 2024-12-01 | 103.69 | 100.23 | 101.15 | 101.2 | 104.13 |
| 2025-01 | 2025-01-01 | 103.66 | 100.29 | 101.33 | 101.29 | 104.1 |
| 2025-02 | 2025-02-01 | 103.74 | 100.26 | 101.4 | 101.18 | 104.13 |
| 2025-03 | 2025-03-01 | 103.75 | 100.14 | 101.59 | 101.29 | 104.17 |
| 2025-04 | 2025-04-01 | 103.82 | 100.36 | 101.05 | 101.3 | 104.25 |
| 2025-05 | 2025-05-01 | 104.07 | 100.43 | 101.25 | 101.4 | 104.25 |
| 2025-06 | 2025-06-01 | 103.78 | 100.23 | 101.2 | 101.43 | 104.24 |
| 2025-07 | 2025-07-01 | 103.74 | 100.38 | 101.11 | 101.34 | 104.28 |
| 2025-08 | 2025-08-01 | 103.55 | 100.32 | 101.18 | 101.38 | 104.24 |
| 2025-09 | 2025-09-01 | 103.66 | 100.16 | 101.23 | 101.31 | 104.29 |
| 2025-10 | 2025-10-01 | 103.65 | 100.05 | 101.17 | 101.45 | 104.19 |
| 2025-11 | 2025-11-01 | 103.69 | 99.94 | 101.28 | 101.41 | 104.22 |
| 2025-12 | 2025-12-01 | 103.82 | 100.13 | 101.55 | 101.58 | 104.21 |
| 2026-01 | 2026-01-01 | 103.9 | 100.23 | 101.73 | 101.8 | 104.32 |
| 2026-02 | 2026-02-01 | 103.7 | 99.94 | 101.49 | 101.47 | 104.21 |
| 2026-03 | 2026-03-01 | 103.78 | 100.11 | 101.51 | 101.65 | 104.35 |
| 2026-04 | 2026-04-01 | 103.95 | 100.29 | 101.5 | 101.85 | 104.45 |
| 2026-05 | 2026-05-01 | 103.98 | 100.36 | 101.66 | 101.98 | 104.49 |
| 2026-06 | 2026-06-01 | 103.88 | 100.39 | 101.55 | 101.98 | 104.51 |
| 2026-07 | 2026-07-01 | 103.27 | 100.58 | 101.32 | 101.86 | 104.49 |
The warehouse boom cooled. It did not vanish.
Swedesboro is a warehouse story, so the industry series matters. New Jersey warehousing and storage employment is published only on a not-seasonally-adjusted basis, which means December looks like Christmas and July does not. Comparing Julys is the clean way to read it. In July 2026 the state had 75,600 warehousing jobs, down 1,300, or 1.69 percent, from July 2025, and down from 81,800 in July 2022. The peak month in the extract is February 2022, at 89,700.
That is a retrenchment from the pandemic logistics boom, not a return to the old world. July 2019 had 62,400 warehousing jobs. July 2026 is still 21 percent above that. The broader, seasonally adjusted transportation, warehousing and utilities supersector — which includes trucking, air, utilities and the warehouses — was 259,500 in July 2026, up 1,200, or 0.46 percent, from a year earlier, and well above 229,700 in December 2019. The boxes left the building. The supersector did not.
Food manufacturing, another not-seasonally-adjusted July-to-July read, does not rescue the HelloFresh metaphor either. Those jobs rose to 44,800 in July 2026 from 44,200 a year earlier. Meal-kit fulfillment is a warehouse, not a cannery. If Swedesboro’s 374 jobs disappear in November, they will show up, if they show up, as a small nick in a warehousing series that has already given back several thousand jobs from its 2022 high.
New Jersey warehouses never fully kept the pandemic boom

View exact chart values
| year | july_jobs_thousands |
|---|---|
| 2015 | 32.8 |
| 2016 | 38.6 |
| 2017 | 52 |
| 2018 | 57 |
| 2019 | 62.4 |
| 2020 | 77.5 |
| 2021 | 73.9 |
| 2022 | 81.8 |
| 2023 | 78.5 |
| 2024 | 75.3 |
| 2025 | 76.9 |
| 2026 | 75.6 |
Manufacturing is the quieter bleed
The sector that actually looks sick in the seasonally adjusted file is manufacturing. New Jersey factories employed 248,300 in July 2026, down 3,800, or 1.51 percent, from July 2025, and 1.15 percent below December 2019. That is a slow leak, not a shutdown wave, and it predates this week’s meal-kit notice. Chemical plants, pharma lines and food factories are in the mix; so are the kinds of plants that file WARN letters and never make the national recap.
Put the pieces on one table and the 11,500-layoff year looks less like a single warehouse story and more like a broad late-cycle fade. Total payrolls are off 19,600 from a year earlier. Manufacturing accounts for 3,800 of that. Warehousing, on a July-to-July not-seasonally-adjusted comparison, accounts for 1,300. Transportation and utilities as a group added jobs. The rest of the decline is scattered across a large state economy that still employs more than 4.3 million people.
That math is why a year of layoff announcements can feel worse than the payroll survey. Each notice is a concentrated local blow — 374 people in Gloucester County, 739 at a headquarters, 871 at grocery warehouses. The survey averages those blows with every diner that hired a cook. Readers can hold both facts: Swedesboro is a real loss, and New Jersey’s official job count has been drifting down from a 2025 high without anything that looks like a 2008-style break.
In a 17-state cut, New Jersey is near the bottom
Among the 17 states extracted for this comparison — a set chosen for size and for being in this week’s news, not a full 50-state file — New Jersey’s July-to-July decline ranks second-worst. Indiana is last at minus 0.55 percent. Georgia, Delaware and Maryland also lost jobs over the year, Maryland by a rounding error. Minnesota led this set at plus 1.39 percent. Texas followed at 1.16 percent. California, often the villain in a different New Jersey story, was up 0.63 percent.
A weak year is not automatically a two-year slump. New Jersey is still 0.21 percent above July 2024 even after the latest twelve-month drop. Indiana is merely flat over two years. Maryland and Massachusetts are the two-year laggards in this group; Massachusetts is slightly up over the latest year and slightly down from July 2024. Texas and North Carolina compounded gains in both windows. The scatter is a reminder not to narrate one WARN season as a regional depression.
What the payrolls can say, and what they cannot, should be kept in separate drawers. They can say New Jersey’s 2026 layoff year is already visible as a small, real decline from a 2025 peak, that factories — not warehouses — are the weaker official sector, and that Illinois’s record is not a trick of seasonal adjustment in this snapshot. They cannot say HelloFresh caused the statewide drop, cannot count jobs that will disappear in November, and cannot convert announced cuts into a net payroll total. For that, wait for the next few surveys. The boxes in Swedesboro will still be there until then.
Among large states, only a handful lost jobs over the year

View exact chart values
| state | july_2025_thousands | july_2026_thousands | yoy_percent | yoy_thousands |
|---|---|---|---|---|
| Indiana | 3270.1 | 3252.2 | -0.55 | -17.9 |
| New Jersey | 4377.2 | 4357.6 | -0.45 | -19.6 |
| Georgia | 4993.2 | 4977.5 | -0.31 | -15.7 |
| Delaware | 496.2 | 495.1 | -0.22 | -1.1 |
| Maryland | 2816.5 | 2815.9 | -0.02 | -0.6 |
| Massachusetts | 3706.7 | 3712.5 | 0.16 | 5.8 |
| Michigan | 4490.2 | 4498.4 | 0.18 | 8.2 |
| Illinois | 6164.5 | 6176.4 | 0.19 | 11.9 |
| New York | 9940.1 | 9960.7 | 0.21 | 20.6 |
| Ohio | 5672.6 | 5690 | 0.31 | 17.4 |
| Florida | 9996.3 | 10037.3 | 0.41 | 41 |
| Pennsylvania | 6169.2 | 6201.1 | 0.52 | 31.9 |
| California | 18020.3 | 18133 | 0.63 | 112.7 |
| Connecticut | 1716.7 | 1730.5 | 0.8 | 13.8 |
| North Carolina | 5060.4 | 5112 | 1.02 | 51.6 |
| Texas | 14302.4 | 14468 | 1.16 | 165.6 |
| Minnesota | 3021.7 | 3063.6 | 1.39 | 41.9 |
A weak year is not the same as a two-year slide

View exact chart values
| state | yoy_percent | two_year_percent | july_2026_thousands |
|---|---|---|---|
| New Jersey | -0.45 | 0.21 | 4357.6 |
| New York | 0.21 | 0.81 | 9960.7 |
| Pennsylvania | 0.52 | 1.04 | 6201.1 |
| Illinois | 0.19 | 0.36 | 6176.4 |
| California | 0.63 | 1.03 | 18133 |
| Texas | 1.16 | 2.51 | 14468 |
| Florida | 0.41 | 0.93 | 10037.3 |
| Ohio | 0.31 | 0.59 | 5690 |
| Michigan | 0.18 | 0.42 | 4498.4 |
| Connecticut | 0.8 | 1.06 | 1730.5 |
| Massachusetts | 0.16 | -0.36 | 3712.5 |
| Delaware | -0.22 | 0.84 | 495.1 |
| Maryland | -0.02 | -0.89 | 2815.9 |
| Georgia | -0.31 | 0.13 | 4977.5 |
| Minnesota | 1.39 | 1.68 | 3063.6 |
| Indiana | -0.55 | 0 | 3252.2 |
| North Carolina | 1.02 | 1.87 | 5112 |
Sources and methods
Research date: 11 September 2026, using pinned local snapshots, not a live Bureau of Labor Statistics download on the edition date. Historical edition date: 20 August 2026. This is retrospective enrichment; later BLS revisions may differ from the snapshot.
Payroll observations are monthly, January 2015 through July 2026 where extracted. Year-over-year comparisons use July 2025 and July 2026. Two-year comparisons use July 2024 and July 2026. New Jersey history charts begin in January 2019 for readability; the underlying extract starts in January 2015.
Data vintage: BLS State and Area Employment snapshot created 24 August 2026 (release_id bls-sm-snapshot-2026-08-24); national total nonfarm from the Current Employment Statistics snapshot of the same day. Units are thousands of jobs. Seasonally adjusted series are used for statewide totals and manufacturing. Warehousing and storage and food manufacturing are not seasonally adjusted; those comparisons are July-to-July only so the holiday spike is not mistaken for a trend.
Nulls were skipped and not treated as zero. Duplicate period keys were checked in each extract; none conflicted. Aggregate payrolls are not household averages and are not WARN counts. HelloFresh’s November 2026 closing is not in the July 2026 survey. The 17-state ranking includes only states extracted for this article, not all 50 states. Indexed comparisons use January 2020 = 100 and do not imply identical industry mix across states. No causal claim is made that any single layoff notice moved the statewide total.
Research completed 2026-09-11, for the August 20, 2026 news edition. This is retrospective analysis, not a reconstruction of information available that day.